Newfoundland and Labrador Hurricane Season Outlook 2019
←
→
Page content transcription
If your browser does not render page correctly, please read the page content below
Newfoundland and Labrador Hurricane
        Season Outlook 2019

                         Submitted to:
            Water Resources Management Division
       Department of Municipal Affairs and Environment
          4th Floor, West Block, Confederation Building
              PO Box 8700, St. John’s, NL A1B 4J6

                         Submitted by:
        Wood Environment & Infrastructure Solutions,
                       133 Crosbie Road
                         PO Box 13216
                     St. John’s, NL A1B 4A5

                         11 June 2019
                  Wood Project #: TA1912750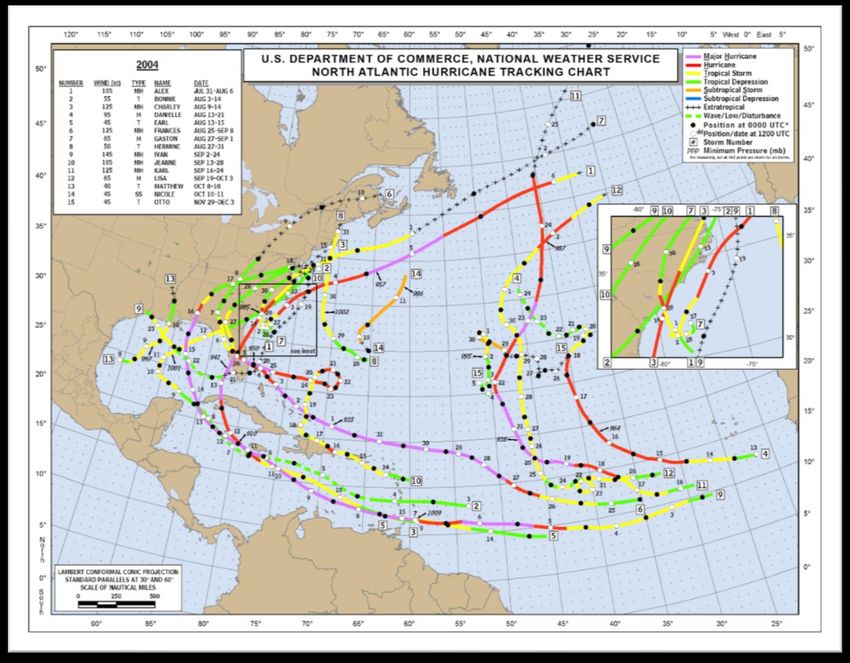
Hurricane Season Outlook 2019
                                                                   NL Water Resources Management Division

                                      Important Notice

              This report was prepared exclusively for Water Resources
              Management Division Department of Municipal Affairs and
              Environment by Wood Environment & Infrastructure Solutions. The
              quality of the information, conclusions and estimates contained
              herein is consistent with the level of effort involved in Wood services
              and based on: i) information available at the time of preparation, ii)
              data supplied by outside sources and iii) the assumptions,
              conditions and qualifications set forth in this report. This report is
              intended to be used by Water Resources Management Division
              Department of Municipal Affairs and Environment only, subject to
              the terms and conditions of its contract with Wood. Any other use
              of, or reliance on, this report by any third party is at that party’s sole
              risk.

| June 2019                                                                                      Page 2 of 19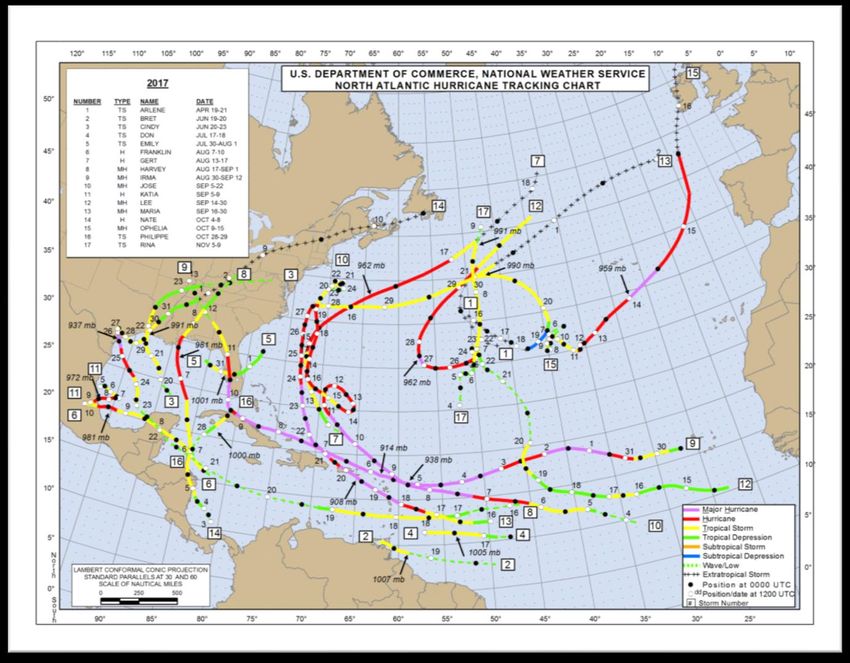
Hurricane Season Outlook 2019
                                                                                                                                        NL Water Resources Management Division

                                                                                          Table of Contents

                Atlantic Hurricane Season Outlook 2019 ......................................... 4

                Historical Newfoundland and Labrador Hurricane Season .......... 10

                Analog Years and Historical Tracks ................................................. 12

                Newfoundland and Labrador Hurricane Season Outlook 2019 ... 17

                Closure............................................................................................... 19

                                                                                            Table of Figures

Figure 1. NINO Regions. .......................................................................................................................................................................... 5
Figure 2. ENSO Probability Forecast (©IRI/CPC). ........................................................................................................................... 6
Figure 3. Global SST Anomaly on May 2 (above) and May 27 (below), 2019. The red boxes show the MDR
region and the purple boxes show the Niño 3.4 region (©NOAA). ....................................................................................... 8
Figure 4. Tropical storm frequency by year for Newfoundland (A) and Labrador (B) between 1901 and 2000
(©ECCC). ......................................................................................................................................................................................................10
Figure 5. Tropical storm frequency by month for Newfoundland (A) and Labrador (B) between 1901 and 2000.
.........................................................................................................................................................................................................................11
Figure 6. Newfoundland tropical cyclone probability using 1886-2016 historical track (©FSU). ............................12
Figure 7. Upper air (500 hPa) Geopotential Heights (m) composite anomaly (1981-2010 climatology) for June
through November of the analogy years (1980, 2004, 2017) (©NOAA). ...........................................................................13
Figure 8. North Atlantic Hurricane Tracking Chart (1980) (©NHC). .....................................................................................14
Figure 9. North Atlantic Hurricane Tracking Chart (2004) (©NHC). .....................................................................................15
Figure 10. North Atlantic Hurricane Tracking Chart (2017) (©NHC). ..................................................................................16
Figure 11. Newfoundland and Labrador Hurricane Season Risk Map. ...............................................................................18

Table 1. Atlantic basin 2019 hurricane forecast by NOAA, CSU, and UCL. .......................................................................... 4

| June 2019                                                                                                                                                                                          Page 3 of 19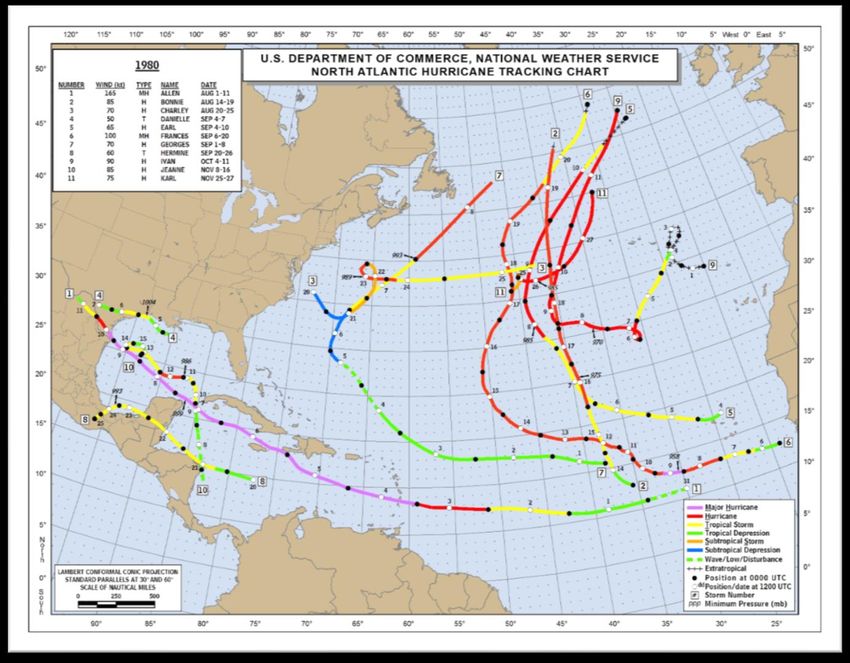
Hurricane Season Outlook 2019
                                                               NL Water Resources Management Division

              Atlantic Hurricane Season Outlook 2019
June 1st marks the beginning of the Atlantic hurricane season. Although the season stretches
for the period between June 1st to November 30th, hurricanes and tropical storms can form
prior to or beyond that period. Nevertheless, the season’s climatological activity peak occurs
around September 10 each season.
There are numerous sources of weather data used in this hurricane outlook. The major
sources are based on the prediction of the ENSO condition, sea surface temperatures (SSTs)
model prediction, and weather patterns. The ENSO condition forecast has limited long-range
skill. Models have limited long-range skill in predicting SSTs, vertical wind shear, moisture
availability, stability, and predicting weather patterns. The seasonal weather pattern
prediction is an outlook to an overall season, but it doesn’t convey the daily and weekly
changes in the pattern. The short-term variability in the weather pattern play a major role in
development, intensification, and track of tropical storms and hurricanes. Furthermore, the
intensity and duration of the predicted tropical storms and hurricanes can occur under
different combinations of climatic signals which amplifies the uncertainty of such
predictions.
Several agencies issue an Atlantic hurricane season outlook, including the National Oceanic
and Atmospheric Administration (NOAA), Colorado State University (CSU), and the
University College London (UCL). The NOAA’s 2019 Atlantic Hurricane Seasonal Outlook
predicts a most likely near-normal season (40%), followed by a 30% chance of an above-
normal season and a 30% chance of below-normal season. The Colorado State University
(CSU) predicts a near normal activity. It is worth noting that the NOAA and CSU use a 30-
year (1981-2010) based-climatology. Meanwhile, the University College London (UCL)
predicts that the 2019 Atlantic hurricane season is expected to be slightly below (10%) the
long-term (1950-2018) normal and about 20% below the recent (2009-2018) ten-year
normal. Table 1 below summaries the prediction from each source.

                    Table 1. Atlantic basin 2019 hurricane forecast by NOAA, CSU, and UCL.

                                           NOAA             CSU              UCL
                   Named Storms             9-15             13               12
                    Hurricanes              4-8              6                 6
                  Major Hurricanes          2-4              2                 2

The El Niño-Southern Oscillation (ENSO) is a measure of the SST anomaly in different Niño
regions in the equatorial Pacific as seen in Figure 1. The neutral phase is determined when
the Niño 3.4 region is within ±0.5 °C. The La Niña and El Niño are terms used when the
Niño 3.4 region is in the negative and positive phase, respectively.

| June 2019                                                                                  Page 4 of 19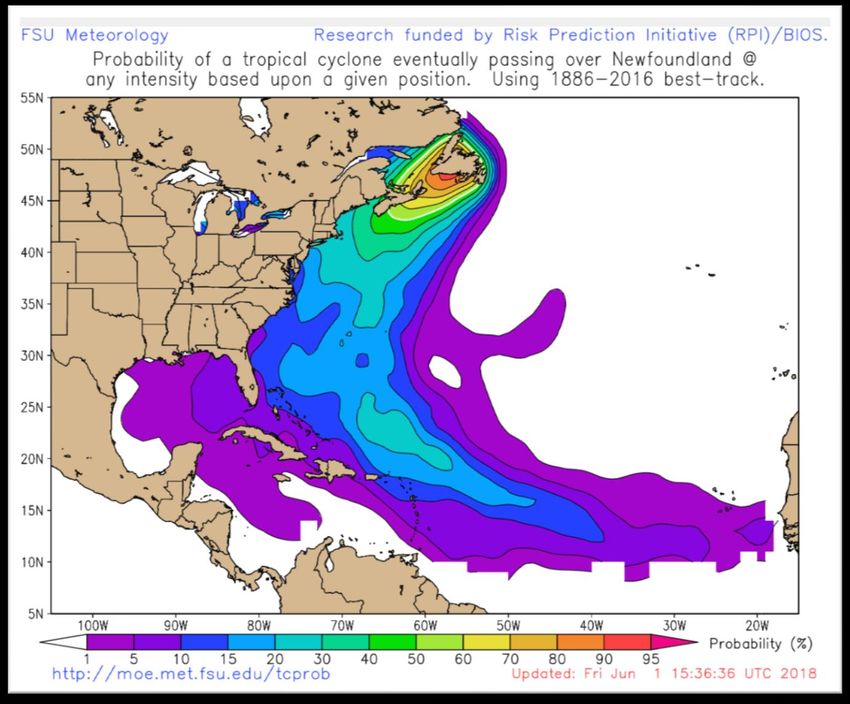
Hurricane Season Outlook 2019
                                                           NL Water Resources Management Division

                                       Figure 1. NINO Regions.

The La Niña phase is climatologically associated with weaker vertical wind shear, weaker
trade winds, and increased atmospheric instability across the Atlantic basin which in turn
helps the overall organizational structure of any tropical storm. Meanwhile, the El Niño
phase suppresses storm organization due to stronger wind shear, stronger trade winds,
and greater atmospheric stability across the Atlantic basin. It is also worth noting that both
ENSO phases have opposite effects on the Pacific and Atlantic basins.
Figure 2 shows the probabilistic ENSO forecast based on the Niño 3.4 SST anomaly. The
figure shows that the current El Niño phase is expected to persist into the fall. During the
peak hurricane season months of August, September, and October, there’s a 60% chance
of the Pacific basin remaining in El Niño conditions, with a 35% chance of ENSO neutral
conditions, and only a 5% chance of La Niña conditions. Most of the ENSO models indicate
the El Niño will remain weak through the summer and into the fall. Given this, it is likely the
ENSO state will suppress Atlantic tropical cyclone activity somewhat.

| June 2019                                                                           Page 5 of 19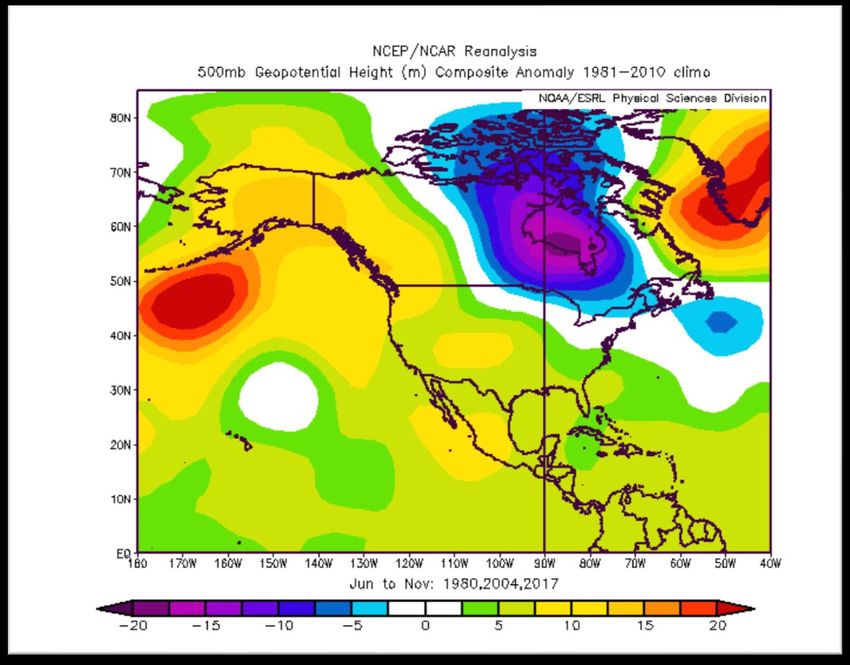
Hurricane Season Outlook 2019
                                                                         NL Water Resources Management Division

                                 ENSO state based on NINO 3.4 SST Anomaly
                                                Neutral ENSO: ± 0.5 °C

                                                 La Niña     Neutral   El Niño

                         100
                          90
                          80
       Probability (%)

                          70
                           60
                           50
                           40
                           30
                            20
                            10
                             0
                                                                                            El Niño
                                                                                          Neutral
                                                                                         La Niña

                                               Time Period

                                      Figure 2. ENSO Probability Forecast (©IRI/CPC).

Hurricane season predictions consider the various and complex interactions of intra-
seasonal variables such as the ENSO and Atlantic Multidecadal Oscillation (AMO), Madden-
Julian Oscillation (MJO), mid-level moisture, and Atlantic sea level pressure and upper air
patterns. The MJO is an index that measures the variability (1 to 3 months) in the tropical
atmosphere. The AMO is a mode that measures the decadal SST variability in the Atlantic
basin. The current positive phase of the AMO (above normal SST in the North Atlantic) is
conducive to lower surface pressures over the tropical Atlantic with moister atmospheric
mid-levels.

| June 2019                                                                                           Page 6 of 19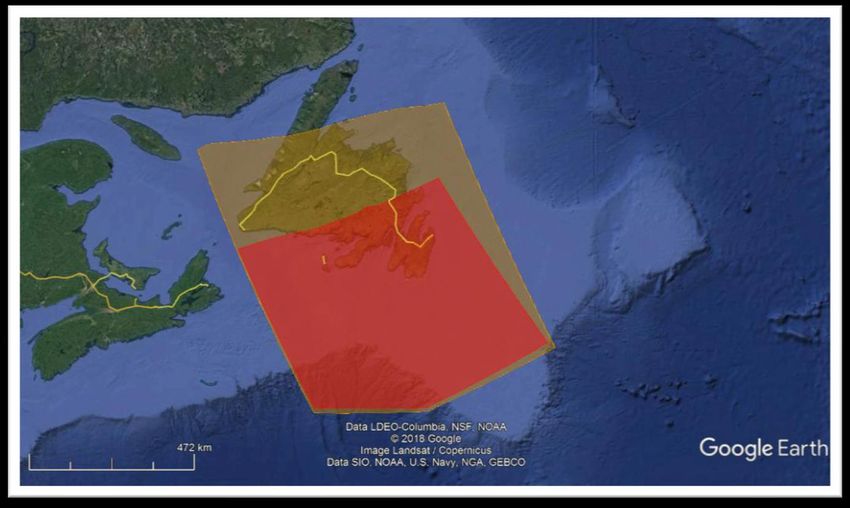
Hurricane Season Outlook 2019
NL Water Resources Management Division
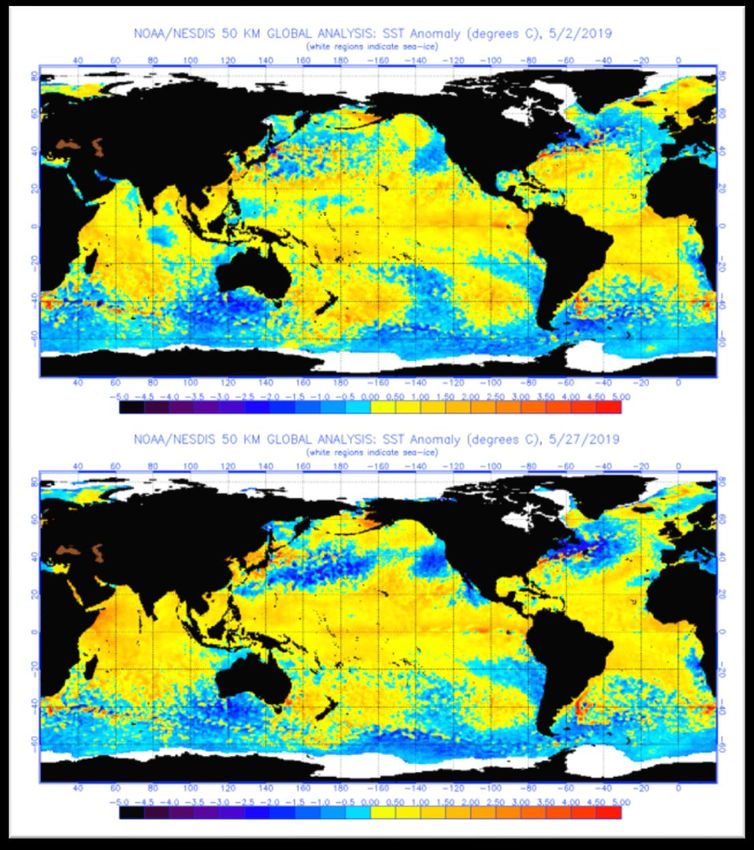
The latest SST observations (Figure 3) indicate an increasing warming anomaly in the tropical
Atlantic, near the Main Development Region (MDR), 10-20 °N and 60-20 °W. The figure
shows the tropical Atlantic (red boxes) temperature anomaly on May 2 and May 27, 2019,
respectively. Such relatively warmer temperatures are expected to be associated with
moister mid-levels and lower surface pressure in the tropical Atlantic, which in turn increases
the formation of tropical cyclones. The slightly warmer anomaly in the tropical Atlantic
correlates with a weak positive phase of AMO. There is some disagreement between the
agencies on the AMO phase, given that the colder SSTs in north Atlantic, near
Newfoundland, are usually more associated with the negative phase of the AMO, as noted
by CSU. In the Pacific Ocean, the positive anomaly in NIÑO 3.4 region can also be noticed in
Figure 3 (purple boxes).
| June 2019 Page 7 of 19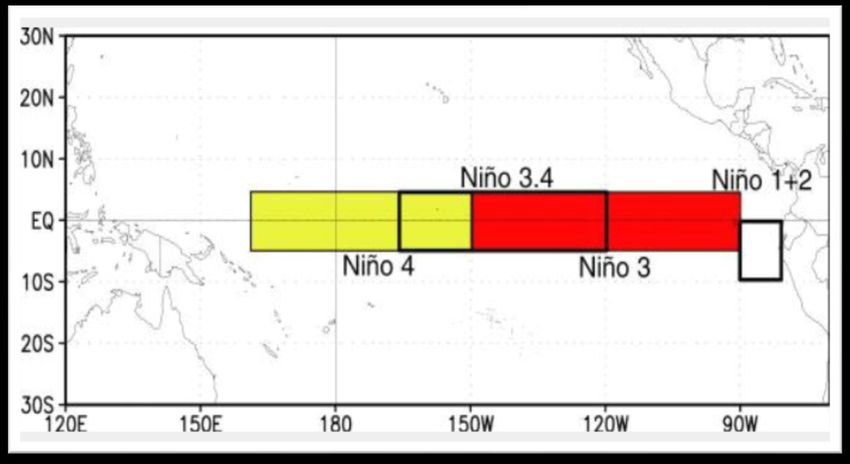
Hurricane Season Outlook 2019
                                                                NL Water Resources Management Division

              Figure 3. Global SST Anomaly on May 2 (above) and May 27 (below), 2019. The red boxes
                  show the MDR region and the purple boxes show the Niño 3.4 region (©NOAA).

An additional observation that can be made from Figure 3 is the SST anomaly has reversed
from negative to positive in the Gulf of Mexico. The SST anomalies near Atlantic Canada
have cooled through May.

| June 2019                                                                                Page 8 of 19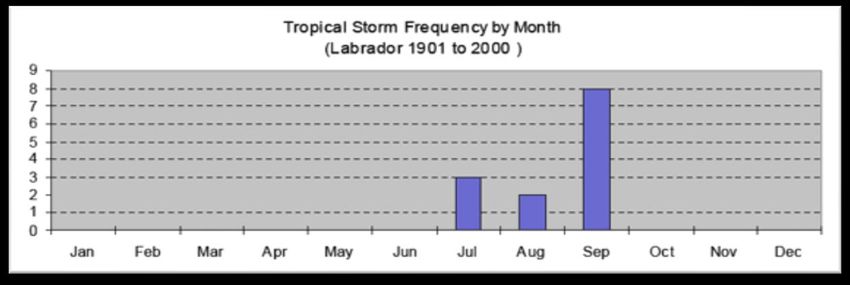
Hurricane Season Outlook 2019
                                                         NL Water Resources Management Division

The Wood Seasonal Outlook Team has noticed a few anomalies over the past month such
as positive anomalies of rainfall over the southern African Sahel region, a growing positive
SST anomaly in the MDR as mentioned above, and a weaker than normal Bermuda-Azores
High. If such anomalies continue, it could aid in the development of tropical storms in the
MDR region. The current global atmospheric models are depicting a drier Sahel region and
a normal-strength Bermuda-Azores High throughout September followed by a wetter Sahel
region on October.
The Wood Seasonal Outlook Team is anticipating a near normal Atlantic Hurricane Season
with a noticeable monthly variation in tropical wave activity; peaking in late September and
into October.

| June 2019                                                                         Page 9 of 19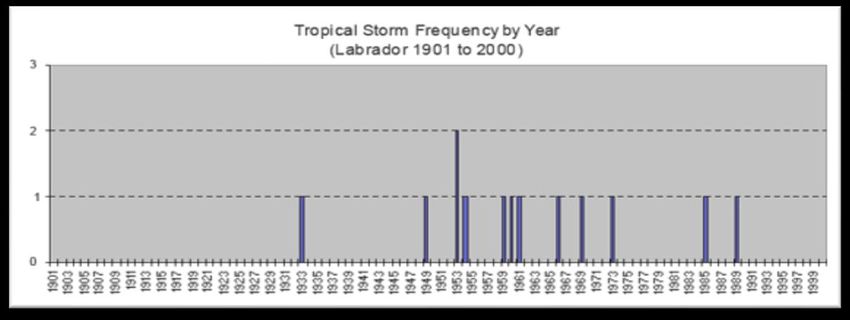
Hurricane Season Outlook 2019
                                                                  NL Water Resources Management Division

              Historical Newfoundland and Labrador Hurricane Season
The Environment and Climate Change Canada (ECCC) records show Newfoundland being
impacted by a higher number of tropical storms than Labrador as seen in Figure 4. This figure
shows the frequency of tropical storms by year for Newfoundland (a) and Labrador (b)
between 1901 and 2000.

              (A)

              (B)

              Figure 4. Tropical storm frequency by year for Newfoundland (A) and Labrador (B) between
                                               1901 and 2000 (©ECCC).

The same records reveal the month of September as the peak month for tropical storm
activity, followed by October (Figure 5).

| June 2019                                                                                 Page 10 of 19
Hurricane Season Outlook 2019
NL Water Resources Management Division
(A)
(B)
Figure 5. Tropical storm frequency by month for Newfoundland (A) and Labrador (B) between
1901 and 2000.
The database of Newfoundland tropical (TC) and post-tropical cyclone (PTC) landfalls was
extended to include the 2001-2018 seasons. Since 1950, there have been 51 TC or PTC that
have made landfall on the Island of Newfoundland. During the same period, there were 30
neutral ENSO years, 19 La Niña years and 20 El Niño years.
Figure 6 below shows the Florida State University (FSU) probabilistic tropical cyclones
trekking over Newfoundland using 1886-2016 historical data. Storms which affect
Newfoundland most regularly approach from the south-southwest and generally pass near
or west of Bermuda before arriving on the Newfoundland Coast.
| June 2019 Page 11 of 19Hurricane Season Outlook 2019
NL Water Resources Management Division
Figure 6. Newfoundland tropical cyclone probability using 1886-2016 historical track (©FSU).
Analog Years and Historical Tracks
Establishing ENSO as our base index and considering the AMO, SSTs, North Atlantic
Oscillation (NAO), and Pacific-North America Index (PNA), the best analog years are 1980
and 2017. Figure 7 shows the upper air (500 hPa) geopotential height (m) composite
anomaly based on 1981-2010 climatology for the period from June and through to
November for the combined analog years. The main features in this figure are the
anomalously lower heights over the Labrador Sea and the Bermuda High. Such a pattern
creates a storm track along the eastern seaboard of the United States and Atlantic Canada.
| June 2019 Page 12 of 19Hurricane Season Outlook 2019
NL Water Resources Management Division
Figure 7. Upper air (500 hPa) Geopotential Heights (m) composite anomaly (1981-2010
climatology) for June through November of the analogy years (1980, 2004, 2017) (©NOAA).
The hurricane track charts for the analog years is given in Figures 8 to 10. The analog years
are near-normal to above normal hurricane season. There was no noticeable major impact
to Newfoundland and Labrador during the three analog years. Hurricane Nate in 2017
tracked into Newfoundland as a post-tropical remnant and produced about 20 mm of rain
in Stephenville and wind gusts to 60 km/h in St. Lawrence. Hurricane Gaston in 2004 tracked
just southeast of the Avalon Peninsula and produced 10 to 20 mm of rainfall and a wind gust
of 70 km/h in St. John’s.
| June 2019 Page 13 of 19Hurricane Season Outlook 2019
NL Water Resources Management Division
Figure 8. North Atlantic Hurricane Tracking Chart (1980) (©NHC).
| June 2019 Page 14 of 19Hurricane Season Outlook 2019
NL Water Resources Management Division
Figure 9. North Atlantic Hurricane Tracking Chart (2004) (©NHC).
| June 2019 Page 15 of 19Hurricane Season Outlook 2019
NL Water Resources Management Division
Figure 10. North Atlantic Hurricane Tracking Chart (2017) (©NHC).
| June 2019 Page 16 of 19Hurricane Season Outlook 2019
NL Water Resources Management Division
Newfoundland and Labrador Hurricane Season Outlook 2019
The current Atlantic Hurricane Season is forecast to be near normal given the different global
indices discussed earlier. The analog years show lower pressure over the northeast USA and
eastern Canada extending eastward through the Grand Banks with a normal-strength
Bermuda High. Such a weather pattern promotes a storm track east of Atlantic Canada with
substantial risk to areas over the Grand Banks.
This season holds a lower risk of 1 to 2 tropical or extratropical cyclones tracking through
Newfoundland and Labrador with the highest impact expected to be along southern
Newfoundland as seen in Figure 11. Although the records show storms affecting
Newfoundland in the first five months of the season, September appears the month with the
highest number of storms passing near or through Newfoundland.
The current area of below-normal SSTs from Nova Scotia to Newfoundland could weaken
any storm tracking toward Atlantic Canada. However, the Wood team believes the general
steering pattern and enhancement from upper level troughs is more important for intense
tropical cyclone impacts in Atlantic Canada. While the overall pattern and analogs don’t
appear to be conducive for larger tropical cyclone impact, we can never rule out the
possibility of an intense tropical cyclone impact to Newfoundland and Labrador. The most
likely impact to Newfoundland and Labrador from a tropical or post-tropical cyclone will
always remain heavy rain and flooding.
| June 2019 Page 17 of 19Hurricane Season Outlook 2019
NL Water Resources Management Division
Figure 11. Newfoundland and Labrador Hurricane Season Risk Map.
| June 2019 Page 18 of 19Hurricane Season Outlook 2019
NL Water Resources Management Division
Closure
We trust that this report meets your needs. Please do not hesitate to contact the author if you have any
questions or comments regarding the hurricane season outlook.
Yours sincerely,
Wood Environment & Infrastructure Solutions
Dr. Diar Hassan
Sr. Scientist, Product & Business Development
Nick Camizzi
Protean Lead/Meteorologist
Reviewed by:
J. Chris Innes
Branch Manager
| June 2019 Page 19 of 19You can also read