HEARTLAND BANCCORP COLUMBUS, OHIO - Q4 2020 FINANCIAL UPDATE

Page created by Clyde Ortega
 
CONTINUE READING
HEARTLAND BANCCORP COLUMBUS, OHIO - Q4 2020 FINANCIAL UPDATE
Heartland BancCorp
Columbus, Ohio

Q4 2020 Financial Update
As of January 15, 2020

                           (OTCQX: HLAN)
HEARTLAND BANCCORP COLUMBUS, OHIO - Q4 2020 FINANCIAL UPDATE
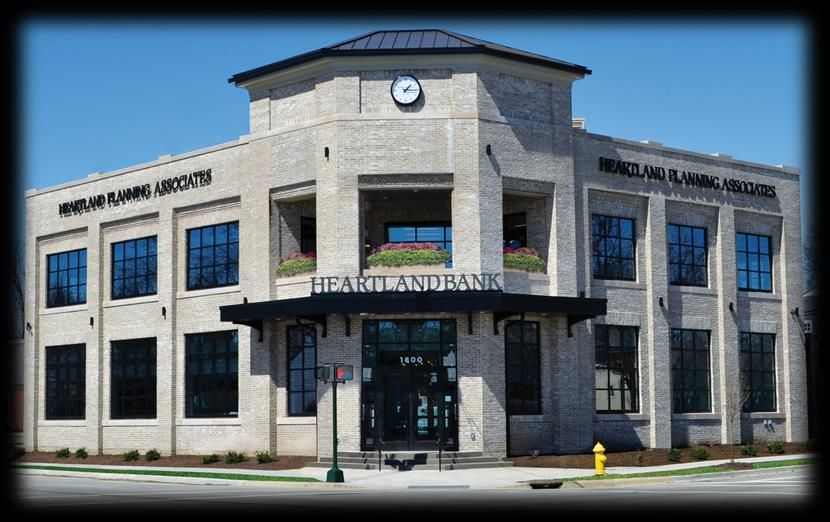
Safe Harbor Statement

This presentation contains forward-looking statements within the meaning of the Private Securities Litigation Reform Act of 1995.
These forward-looking statements include, but are not limited to, statements about (i) Heartland’s plans, objectives, expectations and
intentions and other statements contained in this presentation that are not historical facts; and (ii) other statements identified by
words such as “expects,” “anticipates,” “intends,” “plans,” “believes,” “seeks,” “estimates,” “targets,” “projects,” or words of similar
meaning generally intended to identify forward-looking statements. These forward-looking statements are based upon the current
beliefs and expectations of Heartland’s management and are inherently subject to significant business, economic and competitive
uncertainties and contingencies, many of which are beyond the control of Heartland. In addition, these forward-looking statements
are subject to assumptions with respect to future business strategies and decisions that are subject to change. Actual results may
differ materially from the anticipated results discussed in these forward-looking statements because of the following factors, among
others: (1) the assumptions and estimates used by Heartland’s management include both assumptions as to certain business decisions
that are subject to change and, in many respects, subjective judgment, and thus are susceptible to multiple interpretations and
periodic revisions based on actual experience and business developments, and thus, may not be realized; (2) the businesses of
Heartland Bank and Victory Community Bank may not be combined successfully, or such combination may take longer, be more
difficult, time-consuming or costly to accomplish than expected, and the expected growth opportunities or cost savings from the
merger may not be fully realized or may take longer to realize than expected; (3) legislative or regulatory changes, including changes
in accounting standards, may adversely affect the businesses in which Heartland is engaged; (4) changes in the interest rate
environment may adversely affect net interest income; (5) results may be adversely affected by continued diversification of assets and
adverse changes to credit quality; (6) competition from other financial services companies in Heartland’s markets could adversely
affect operations; (7) the impact of the coronavirus (COVID-19) pandemic on the employees and customers of Heartland, as well as the
resulting effect on the business, financial condition and results of operations on Heartland; and (8) the current economic slowdown
could adversely affect credit quality and loan originations.

Heartland cautions that the foregoing list of factors is not exclusive. All subsequent written and oral forward-looking statements are
expressly qualified in their entirety by the cautionary statements above. You are cautioned not to place any undue reliance on forward-
looking statements. Heartland does not undertake any obligation to update any forward-looking statement to reflect circumstances or
events that occur after the date the forward-looking statements are made, except as required by law.

                                                                   2
HEARTLAND BANCCORP COLUMBUS, OHIO - Q4 2020 FINANCIAL UPDATE
Heartland BancCorp
(OTCQX: HLAN)

           It is Heartland Bank’s mission to provide the best-personalized financial
          services at competitive prices for the economic growth and well-being of
            individuals and businesses within our communities. This goal shall be
         accomplished through well-trained, caring employees, with unquestionable
          integrity, who practice sound and innovative banking principles, which will
                              maximize bank profits and growth.

                                               3
2020 Full-Year Financial Highlights
Fourth consecutive year of record net income

             Revenue                          Net Income                             TBVPS
         $60.5 million                       $14.8 million                         $63.87
          ↑ 25% y/y                           ↑ 12% y/y                           ↑ 2.2% y/y

              ROAA                                ROATCE                               EPS
              1.08%                               12.00%                           $7.33
          ↓ 13 bps y/y                       ↑ 118 bps y/y                        ↑ 14% y/y

     ➢ Net loans increased 26% y/y to $1.13 billion
     ➢ Total deposits increased 39% y/y to $1.31 billion
     ➢ Noninterest DDA increased 67% y/y to $427 million
     ➢ Net interest margin (NIM) of 3.63% (including PPP effects), down 31 bps from the prior year
     ➢ Efficiency ratio of 59.92%, down 356 bps from the prior year
     ➢ TBVPS increased by 2% y/y, or $1.38 to $63.87
     ➢ Credit quality and capital remain strong

                                                      4
2020 Fourth Quarter Financial Highlights

           Revenue                           Net Income                             TBVPS
       $17.2 million                        $5.8 million                          $63.87
        ↑ 37% y/y                            ↑ 67% y/y                           ↑ 2.2% y/y

             ROAA                               ROATCE                                EPS
            1.50%                               18.39%                            $2.87
        ↑ 29 bps y/y                       ↑ 745 bps y/y                         ↑ 71% y/y

   ➢ Net loans decreased 4% q/q to $1.13 billion
   ➢ Total deposits increased 2% q/q to $1.31 billion
   ➢ Noninterest DDA increased 10% q/q to $427 million
   ➢ Net interest margin (NIM) of 3.50% (including PPP effects), up 12 bps from the prior quarter
   ➢ Efficiency ratio of 55.07%, down 521 bps from the prior year
   ➢ TBVPS increased 4% q/q to $63.87
   ➢ Credit quality and capital remain strong

                                                    5
PPP Update

                                                                                                                   919 loans
                                                                                                                 remaining for
                                                                                                                 $101.3 million
                                                                                                  157 loans        507 loans
                                                                                                 forgiven for    have applied
                                                                                                $28.0 million         for
                                                                                                    in Q4         forgiveness

                                                           $2.0 million in      $120k in
                  Recognition                                 salaries          salaries
                 Breakdown by
                   Line Item                               $306k in              $346k in          $764k in
                                                       interest income       interest income   interest income

Notes: Graph in 000s, PPP data as of December 31st, 2020
                                                                                   6
Deferments Update
                                        Business Detail                                      Business Detail

             ➢ 22 loans still on deferment with a balance of               ➢ Deferments by Quarter to resume regular
                    $51.2 million                                              payment:
                        ➢ 1st Time – 9 loans, $23.2 million                      ➢ Q1 2021 - $43.9 million
                                  ➢ All hotels, all on interest only                   ➢ 1st Time - $23.2 million
                                  ➢ Most expected to request 2nd                       ➢ 2nd Time - $20.7 million
                                         deferment                               ➢ Q2 2021 - $0
                        ➢ 2nd Time – 13 loans, $28.0 million                     ➢ Q3 2021 - $7.3 million
                                  ➢ $4.7 million on full deferment                           Consumer Detail
                                  ➢ $23.3 million on interest only
                                                                           ➢ 7 loans still on deferment with a balance of
             ➢ Deferments by sector:
                                                                              $0.7 million
                        ➢ Accommodation & Food - $44.5 million
                                                                                 ➢ $0.7 million on full deferment
                        ➢ RE Rental & Leasing - $3.8 million
                                                                                 ➢ All set to resume regular payments in
                        ➢ Manufacturing - $2.7 million
                                                                                     Q1 2021
                        ➢ Retail Trade - $0.2 million
                                                                           ➢ 22 FHLB loans with a balance of $5.2 million in
                                                                              forbearance process

Notes: Deferment data as of December 31st, 2020
                                                                       7
Credit Risk Management

                                                                                        ALLL as % of Total Loans
                                                                                                                       1.36%
                                                                                                            1.31%

                                                                                                                       1.24%
                                                                                                  1.04%     1.17%

                                                                             0.97%      0.97%
                                                                                                  0.93%

                                                                             Q4 19      Q1 20     Q2 20     Q3 20      Q4 20

                           Past Due Loans (30+) to Total Loans                       Nonaccrual Loans to Total Loans
                                                       0.65%
                                                                                                            0.40%
                                                                                                  0.35%
                                                       0.59%                                                           0.29%
                                               0.40%
                                                                 0.37%                                      0.36%
                  0.49%
                                                                                                  0.31%
                                    0.35%      0.36%                                    0.25%                          0.26%
                                                                 0.33%
                                                                             0.21%

                  Q4 19             Q1 20      Q2 20   Q3 20     Q4 20       Q4 19      Q1 20     Q2 20     Q3 20      Q4 20

Note: Dashed line metrics excludes PPP loans
                                                                         8
Balance Sheet Concentrations

                              Industry                                                                      Outstanding
                                                                        Further Breakout
                     (based on 2-digit NAICS)                                                                Balance
                                                         ▪   Hotels - $95 million                             $105 million
         Accommodation and Food Services
                                                         ▪   Restaurants - $8 million                     (10.0% of total loans)

                                                         ▪   Religious Organizations - $55 million            $73 million
                           Other Services
                                                         ▪   Personal Service - $5 million                (7.0% of total loans)

                                                         ▪   Assisted Living Facilities - $20 million
                                                                                                              $42 million
           Healthcare and Social Assistance              ▪   Skilled Nursing Facilities - $7 million
                                                                                                          (4.0% of total loans)
                                                         ▪   Continuing Care - $4 million

                                                         ▪   Breweries - $15 million                          $36 million
                           Manufacturing
                                                         ▪   Sign Manufacturing - $3 million              (3.5% of total loans)

                                                         ▪   Supermarket & Other Grocery - $8 million
                                                                                                              $21 million
                             Retail Trade                ▪   Gas Stations with Convenience - $4 million
                                                                                                          (2.0% of total loans)
                                                         ▪   Used Car Dealers - $3 million

Note: Data as of December 31, 2020, Excludes PPP loans
                                                                           9
Balance Sheet
                                                      Loans

      ➢ Net loans up $235.5m, or 26% y/y
                                                                                                                                        $1,168.9         $1,126.3
                 ➢ 1-4 family up $95.6m, or 41% y/y
                                                                                                                          $890.9
                            ➢ Includes $120.2 million in acquired loans
                 ➢ C&I up $106.3m, or 97% y/y
                            ➢ Includes $101.3m in PPP loans
      ➢ ALLL/Total loans now 1.24%, up from 1.17% in 3Q 2020
                 ➢ ALLL/Total loans is 1.36% excluding PPP loans                                                         4Q 2019        3Q 2020          4Q 2020

                                                                                                                            Deposits
                                      $1,287.4                  $1,312.8

                                                                                           ➢ Total deposits up $368.6m, or 39% y/y
             $944.2
                                                                                                        ➢ Includes $149.9 million in acquired deposits
                                                                                                        ➢ DDA up $170.8m, or 67% y/y
                                                                                                        ➢ Savings, NOW and MMDA up $172.4m, or 48% y/y
                                                                                                        ➢ CDs up $25.4m, or 8% y/y
                                                                                           ➢ $265 million in CDs set to reprice in next 12 months, with
           4Q 2019                    3Q 2020                   4Q 2020
                                                                                                  an average current rate of 1.17%

Note: Data as of December 31, 2020 unless otherwise noted. Graphs in millions. VCB acquired loans net
of loans held for sale.
                                                                                                         10
Diversified Loan Portfolio
                          Total Loan Portfolio (Q4 2019)                            Total Loan Portfolio (Q4 2020)

                                      HELOCs       Consumer                                  HELOCs     Consumer
                                        4%            1%                     Commercial        4%          1%
               Commercial
                  12%                                                           11%

                                                      CRE (Non                                             CRE (Non
                                                       Owner                                                Owner
                                                        Occ.)                                                Occ.)
                                                        31%                                                  30%
                                                       $277m     Total CRE                                             Total CRE
                                                                                                            $307m
                                                                   57%                                                   53%
                               1-4 Family                                             1-4 Family
                                                                  $516m                                                 $547m
                                  26%                                                    31%           CRE (Owner
                                                  CRE (Owner
                                 $232m                                                  $359m             Occ.)
                                                     Occ.)
                                                     26%                                                  23%
                                                    $238m                                                $240m

                                    1-4 Family Serviced Loans:                            1-4 Family Serviced Loans:
                                           $25 million                                    $366 million, ↑ 8% q/q

                                                                                          Due to acquisition of VCB

Note: Balances excludes PPP loans
                                                                       11
Diversified Deposit Portfolio
    Total Deposit Portfolio (Q4 2019)        Total Deposit Portfolio (Q4 2020)

                                                    Time
                           Demand                   27%
                            27%                                    Demand
         Time
                           $256 m                                    33%
         35%
                                                                   $427 m

                     Saving,
                      NOW,                           Saving,
                     MMDA                             NOW,
                       38%                           MMDA
                                                       40%

          Cost of Deposits: 1.15%                  Cost of Deposits: 0.45%

                                                   Down from 0.56% q/q

                                        12
NIM Walk forward

                            Positive
           157 loans      impacts of
          forgiven for     repricing
                                                Negative
         $28.0 million     liabilities                       Reduced
                                              impacts of
                          downward                           benefit of
                                                 excess
                         quicker than                         net free
                                              liquidity at
                         assets in Q4                          funds
                                                the FRB
                                                earning
                                                 0.10%

                                         13
Noninterest Income
                                                           Year over Year Change

                                        ➢ Noninterest income up $2.5m, or 111%
                                        ➢ Growth drivers
                                             ➢ Net gains and commissions on loan sales and

                           $4,790,000
                                                 servicing up $2.0m, or 266%
                                             ➢ Heartland Planning Associates income up $106k, or
              $3,755,000                         53%
                                             ➢ Total TCTA contribution of $649k during 4Q20, up
                                                 from $499k in 4Q19
 $2,272,000

                                                         Linked Quarter Change

                                        ➢ Noninterest income up $1.0m, or 28%
                                        ➢ Growth drivers
 4Q 2019      3Q 2020      4Q 2020
                                             ➢ Net gains and commissions on loan sales and
                                                 servicing up $778k, or 38%
                                                    ➢ Primarily driven by mortgage segment

                                               14
Noninterest Income Detail
      Net Gains and Commissions on Loan Sales and Servicing Breakout

                                                                                 Segment Detail
                                                 $2,807
                                                           ➢ Mortgage driven by gain on loan sales to Freddie Mac &
                                                  $197
                                                  $150        FHLB, gain on mortgage servicing asset, LRA fee income and
                                                              recurring servicing fee income
                                $2,029
                                 $106                           ➢ $366 million in off b/s serviced loans
                                 $300

                                                           ➢ Agribusiness driven by recurring servicing income from
                                                 $2,460
                                                              Farmer Mac I and II and gain on sale of loans
                $766
                                $1,622                          ➢ $80 million in off b/s serviced loans
                $246
                $240
                                                           ➢ Commercial driven by SWAP referral fees and recurring
                $280
                                                              servicing income (SBA, Participations)
              4Q 2019          3Q 2020           4Q 2020

                   Mortgage   Agribusiness   Commercial
                                                                ➢ $105 million in off b/s serviced loans

Note: Graph in thousands
                                                                  15
Noninterest Expense
                                                           Year over Year Change
                                        ➢ Noninterest expense up $1.4m, or 17%
                                        ➢ Growth drivers
                                              ➢ Salaries and employee benefits up $832k, or 17%
              $9,421,000   $9,371,000
                                                     ➢ 36 new associates YoY to support strong
                                                        balance sheet and income growth
                                                     ➢ Elevated expenses related to production-based
 $7,995,000
                                                        compensation in Mortgage division
                                              ➢ Occupancy and equipment expense up $181k, or 17%
                                                     ➢ Continued investment in infrastructure and
                                                        digital platform

                                                          Linked Quarter Change
                                        ➢ Noninterest expense down $50k, or 1%
 4Q 2019      3Q 2020      4Q 2020
                                        ➢ Cost saves from VCB acquisition fully realized in the 4th
                                           Quarter

                                                16
Heartland BancCorp Total Return
                                                Value of $100 invested at January 1, 2016
         $240

         $220                                                                                                                      $221.49

         $200

         $180

         $160
                                                                                                                                    $152.30

                                                                                                                                    $150.10
         $140

         $120

         $100
                          1/1/2016           2016                  2017             2018          2019                2020   1/15/2021

                                               HLAN Total Return          SNL U.S. Bank $1B-$5B   SNL Midwest U.S. Bank

Note: Uses 1/15/2021 stock price of $87.50                                        17
Heartland BancCorp (OTCQX: HLAN)
                       Investment Metrics                                                                             Investment Value

                       Stock Price                              $87.50                              Sustained track record of strong earnings performance –
                                                                                                       strong NIM, healthy NII, attractive dividend yield
                 Shares Outstanding                            1.99 M
                                                                                                                  Diversified revenue streams
                       Market Cap                            $174.4 M

                    P/E Ratio (ttm)                             12.0x                                            Strong senior leadership team

               TBV per Share (MRQ)                              $63.87
                                                                                                         Infrastructure in place for future expansion
                                                                                                    17.2% CAGR asset growth since 2015 ($684m -> $1.5b)
                        Price/TBV                               137%

                      ROAA (MRQ)                                1.50%                                 Solid credit quality & CRE risk management culture

                    ROATCE (MRQ)                               18.39%
                                                                                                             Focus on growing core deposit franchise
              Efficiency Ratio (MRQ)                           55.07%

                    Dividend Yield                              2.61%                           Strong Northern Kentucky Regional team poised for growth

Notes: Metrics use 1/15/2021 stock price of $87.50. Shares outstanding is net of Treasury Shares.       18
Contact Information
G. Scott McComb
Chairman, President & Chief Executive Officer
614-337-4600
Scott.McComb@heartland.bank
Carrie Almendinger
EVP & Chief Financial Officer
614-337-4600
Carrie.Almendinger@heartland.bank

Benjamin Babcanec
SVP & Chief Operating Officer
614-337-4600
Benjamin.Babcanec@heartland.bank

Jennifer Eckert
SVP & Head of Investor Relations
614-337-4600
Jennifer.Eckert@heartland.bank
You can also read