First Quarter FY 2021 Earnings Call Presentation - Thursday, September 24, 2020 ADD COVER IMAGE HERE - Investor ...

Page created by Kathleen Bennett
 
CONTINUE READING
First Quarter FY 2021 Earnings Call Presentation - Thursday, September 24, 2020 ADD COVER IMAGE HERE - Investor ...
ADD COVER IMAGE HERE

First Quarter FY 2021 Earnings Call Presentation
Thursday, September 24, 2020                          Art © Dav Pilkey. DOG MAN ™/® Dav Pilkey
First Quarter FY 2021 Earnings Call Presentation - Thursday, September 24, 2020 ADD COVER IMAGE HERE - Investor ...
Forward-Looking Statements

This presentation contains certain forward-looking statements. Such forward-looking
statements are subject to various risks and uncertainties, including those arising from
the continuing impact of COVID-19 related measures taken by governmental authorities
or suppliers or other business providers which may curtail or otherwise adversely affect
certain of the Company’s business operations, and the conditions of the children’s book
and educational materials markets and acceptance of the Company’s products in those
markets, as well as other risks and factors identified from time to time in the Company’s
filings with the Securities and Exchange Commission. Actual results could differ
materially from those currently anticipated.
    2
First Quarter FY 2021 Earnings Call Presentation - Thursday, September 24, 2020 ADD COVER IMAGE HERE - Investor ...
Regulation G

Today’s comments include references to certain non-GAAP financial measures as
defined in Regulation G. The reconciliation of these non-GAAP financial measures with
the relevant GAAP financial information and other information required by Regulation G
is provided in the Company’s earnings release, which is posted on the Company’s
investor relations website at investor.scholastic.com.

   3
First Quarter FY 2021 Earnings Call Presentation - Thursday, September 24, 2020 ADD COVER IMAGE HERE - Investor ...
Richard Robinson
Chairman, President
and Chief Executive Officer

4
First Quarter FY 2021 Earnings Call Presentation - Thursday, September 24, 2020 ADD COVER IMAGE HERE - Investor ...
First Quarter FY 2021

• Scholastic is intently focused on managing the effects of COVID-19 on its business, while
  supporting school and family customers as they acclimate to new learning environments.

• Substantially completed our previously announced $100 million cost savings program.
     o Reduced seasonal operating loss by $38.1 million, excluding one‐time items, and meaningfully
        lowered free cash use in the first quarter.
     o Savings realized in the first quarter were largely related to labor, resulting in a one‐time pre‐tax
        severance charge of $12.0 million.

• Trade and Education well-positioned for continued success.

• Transition to a more flexible model enables the Company to match our offering with best
  revenue potential.

    5
First Quarter FY 2021 Earnings Call Presentation - Thursday, September 24, 2020 ADD COVER IMAGE HERE - Investor ...
First Quarter FY 2021

• First quarter revenue of $215.2 million was 7% lower than Q1 of last year, mainly due to
  COVID-related disruptions in schools.

• Excluding one-time items, operating loss in the first quarter was $45.0 million, a 46%
  improvement from the prior year period’s operating loss of $83.1 million, also excluding one-
  time items.

    6
First Quarter FY 2021 Earnings Call Presentation - Thursday, September 24, 2020 ADD COVER IMAGE HERE - Investor ...
Children’s Book Publishing &
Distribution

• Strong sales of favorite Trade titles and series:
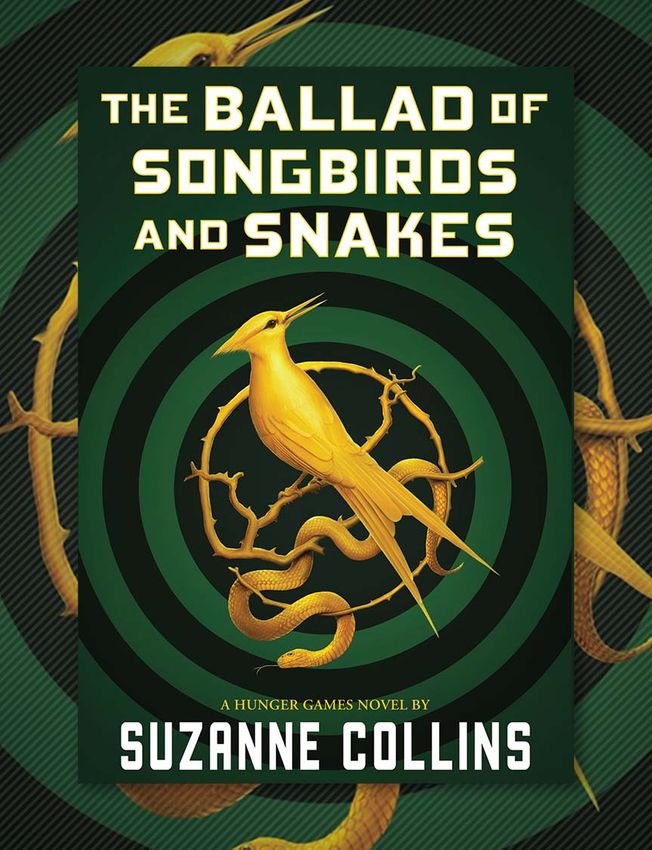
        o   The Ballad of Songbirds and Snakes by Suzanne Collins
        o   The Baby-Sitters Club® by Raina Telgemeier
        o   Captain Underpants by Dav Pilkey
        o   The Bad Guys™ by Aaron Blabey                            ADD IMAGE HERE;
        o   Nat Enough by Maria Scrivan
                                                                      FULL WIDTH AND
                                                                    HEIGHT OF GREY BOX
        o   You Should See Me in a Crown by Leah Johnson

• Dav Pilkey’s Dog Man: Grime and Punishment
  launched on September 1st—already the #1 bestseller.

• High demand for our characters and IP, with recent
  Entertainment deals for Caster™, Goosebumps®,
  Animorphs®, and The Magic School Bus®.

    7
Children’s Book Publishing &
Distribution

• Anticipated lower book fair counts this fall, although
  we expect the pace of club and fair activity to
  increase toward the end of the 2nd quarter and in the
  second half of the year.
                                                            ADD IMAGE HERE;
                                                             FULL WIDTH AND
• Schools remain motivated to host fairs, which are
                                                           HEIGHT OF GREY BOX
  crucial fund raisers and give kids a sense of
  normalcy.

• Converting physical fairs to our new virtual model.

• Scholastic is working with schools to schedule safe
  and easy physical fairs that solve for space, time,
  and people limitations.

    8
Children’s Book Publishing &
Distribution

• Book Clubs seeing lower volumes of orders from
  teachers as a result of delayed openings and
  changes to classroom environments.

• Scholastic is decreasing costs by reducing SKUs          ADD IMAGE HERE;
                                                            FULL WIDTH AND
  and encouraging migration to clubs’ digital platform.
                                                          HEIGHT OF GREY BOX
• Re-imagined flyers are being distributed, designed to
  help teachers spark discussion, teach
  understanding, and engage young readers.

                                                                               Image courtesy of Kelsey Zeilinger
    9
Education

• Digital subscription billings showed 15% growth in

                                                                            Photo © PeopleImages/Getty Images
  the first quarter, with a high, steady volume of
  smaller transactions for digital components.
         o LAUSD purchased digital literacy programs
           Scholastic F.I.R.S.T.® and Literacy Pro™.    ADD IMAGE HERE;
                                                         FULL WIDTH AND
• Grab and Go reading packs and LitCamp® at Home       HEIGHT OF GREY BOX
  to help mitigate the “summer slide.”

• Scholastic Classroom Magazines launched popular
  digital-only subscription model.

• Launched 100th Anniversary Scholastic Bookshelf,
  with free excerpts from over 60 stories to support
  teachers and parents.
    10
International

• International businesses seeing similar trends as in
  the United States.

• Lower book fair volumes, primarily caused by school
  closings in Canada, Australia, and the U.K., and        ADD IMAGE HERE;
                                                           FULL WIDTH AND
  lower direct sales in Asia were partially offset by
                                                         HEIGHT OF GREY BOX
  stronger Trade publishing globally and strong
  Australia book club performance.

    11
Fiscal Year 2021

• Will not be providing a fiscal year 2021 outlook.

• Expect clubs and fairs sales to increase toward the end of the 2nd fiscal quarter, and to continue to
  strengthen in the second half of the year.

• On an annual basis, expect total club and fair revenue to be down somewhat from prior year
  levels due to loss of important September and October selling months this year.

• Taking action within the Company designed to lower costs and gain efficiencies, and are
  supporting revenue streams by cementing Scholastic’s position as a trusted partner to educators
  and parents.

   12
Kenneth Cleary
 Chief Financial Officer

13
Income Statement

                                              In $ Millions (except per share)                                             First Quarter 2021                                    First Quarter 2020
                                                                                                                      As     One-Time     Excluding                         As     One-Time     Excluding
                                                                                                                   Reported    Items One-Time Items                      Reported    Items One-Time Items
                         Revenues                                                                                      $215.2            $0.0              $215.2           $232.6            $0.0            $232.6
                           Cost of goods sold                                                                           123.2              -                123.2             137.1                 -          137.1
                                                                                        1
                           Selling, general and administrative expenses                                                 132.1           (12.0)              120.1             165.9            (4.3)           161.6
                           Bad debt expense                                                                                1.4             -                   1.4               1.6                -             1.6
                           Depreciation and amortization                                                                  15.5             -                  15.5             15.4                 -            15.4

                         Total operating costs and expenses                                                             272.2           (12.0)              260.2             320.0            (4.3)           315.7
                         Operating income (loss)                                                                         (57.0)          12.0                (45.0)           (87.4)            4.3             (83.1)
                           Interest income (expense), net                                                                 (1.2)            -                  (1.2)              0.7                -             0.7
                           Other components of net periodic benefit (cost)                                                (0.2)            -                  (0.2)             (0.4)               -            (0.4)
                                                                                2
                           Gain (loss) on sale of assets and other                                                         6.6             -                   6.6                -                 -               -

                         Earnings (loss) before income taxes                                                             (51.8)          12.0                (39.8)           (87.1)            4.3             (82.8)
                           Provision (benefit) for income taxes 3                                                        (12.0)           3.1                 (8.9)           (28.6)            1.2             (27.4)
                         Net Income (loss)                                                                               (39.8)           8.9                (30.9)           (58.5)            3.1             (55.4)
                           Less: Net income (loss) attributable to noncontrolling interests                                0.0             -                   0.0               0.0                -             0.0
                       Net Income (loss) attributable to Scholastic Corporation                                        ($39.8)           $8.9              ($30.9)           ($58.5)          $3.1            ($55.4)
                         Earnings (loss) per diluted share                                                             ($1.16)          $0.26              ($0.90)           ($1.68)         $0.09            ($1.59)

      1.   In the three months ended August 31, 2020, the Company recognized pretax severance of $12.0. In the three months ended August 31, 2019, the Company recognized pretax severance of $2.8 and a pretax settlement expense of $1.5.

      2.   In the three months ended August 31, 2020, the Company recognized pretax gain on the sale of its Danbury facility of $6.6.

      3.   In the three months ended August 31, 2020 and August 31, 2019, the Company recognized a benefit for income taxes in respect to one-time pretax charges of $3.1 and $1.2, respectively.

 14
Adjusted EBITDA

                                                                                                                                                                                  Three Months Ended

                                                                                                                                                                              8/31/2020                           8/31/2019

                   Earnings (loss) before income taxes as reported                                                                                                                       ($51.8)                             ($87.1)
                   One-time items before income taxes                                                                                                                                      12.0                                 4.3
                   Earnings (loss) before income taxes excluding one-time items                                                                                                           (39.8)                              (82.8)

                      Interest (income) expense                                                                                                                                                1.2                                (0.7)
                                                                                           1
                      Depreciation and amortization                                                                                                                                           16.4                                16.1
                      Amortization of prepublication costs                                                                                                                                     6.3                                 6.4

                                                          2
                   Adjusted EBITDA                                                                                                                                                       ($15.9)                             ($61.0)

      1.   For the three months ended August 31, 2020 and August 31, 2019, amounts include depreciation of $0.8 and $0.6, respectively, recognized in cost of goods sold, amortization of deferred financing costs of $0.1 and $0.1, respectively, and
           amortization of capitalized cloud software of $0.0 and $0.0, respectively, recognized in selling, general and administrative expenses.

      2.   Adjusted EBITDA is defined by the Company as earnings (loss), excluding one-time items, before interest, taxes, depreciation and amortization. The Company believes that Adjusted EBITDA is a meaningful measure of operating profitability and
           useful for measuring returns on capital investments over time as it is not distorted by unusual gains, losses, or other items.

 15
Selected Balance Sheet,
Free Cash Flow & Net Debt

                                                                                In $ Millions                                                                                     Aug 31, 2020 Aug 31, 2019
                                                                                                                             1
                Free cash flow (use) (3 month period ending)                                                                                                                                      ($34.9)                            ($118.5)
                Accounts receivable, net                                                                                                                                                         $219.6                                $226.1
                Inventories, net                                                                                                                                                                 $323.2                                $403.6
                Accounts payable                                                                                                                                                                 $168.3                                $226.4
                Accrued royalties                                                                                                                                                                   $56.2                                 $63.3
                Total debt                                                                                                                                                                       $219.9                                   $13.0
                Cash and cash equivalents                                                                                                                                                        $355.5                                $199.4
                                     2
                Net debt                                                                                                                                                                       ($135.6)                              ($186.4)

      1.   Free cash flow (use) is defined by the Company as net cash provided by or used in operating activities (which includes royalty advances) and cash acquired through acquisitions and from sale of assets, reduced by spending on property, plant
           and equipment and prepublication costs. The Company believes that this non-GAAP financial measure is useful to investors as an indicator of cash flow available for debt repayment and other investing activities, such as acquisitions. The
           Company utilizes free cash flow as a further indicator of operating performance and for planning investing activities.

      2.   Net debt is defined by the Company as lines of credit and short-term debt plus long-term-debt, net of cash and cash equivalents. The Company utilizes this non-GAAP financial measure, and believes it is useful to investors, as an indicator of the
           Company’s effective leverage and financing needs.

 16
Segment Results

                                                                                                              First Quarter 2021                                        First Quarter 2020
                                              In $ Millions
                                                                                                        As    One-Time       Excluding                            As    One-Time       Excluding
                                                                                                     Reported    Items    One-Time Items                       Reported    Items    One-Time Items
           Children's Book Publishing and Distribution
             Revenues
                 Book Clubs                                                                                $5.8           $0.0                      $5.8              $8.0           $0.0                      $8.0
                 Book Fairs                                                                                13.2              -                      13.2              27.5              -                      27.5
                 Consolidated Trade                                                                        71.9              -                      71.9              74.1              -                      74.1
             Total Revenues                                                                                90.9              -                      90.9            109.6               -                    109.6
             Operating income (loss)                                                                      (29.2)             -                     (29.2)            (41.7)             -                     (41.7)
             Operating margin                                                                                  -                                        -                 -                                       -
           Education
             Revenues                                                                                      53.6              -                      53.6              48.4              -                      48.4
             Operating income (loss)                                                                        (2.2)            -                      (2.2)            (13.4)             -                     (13.4)
             Operating margin                                                                                  -                                        -                 -                                       -
           International
             Revenues                                                                                      70.7              -                      70.7              74.6              -                      74.6
                                              1
             Operating income (loss)                                                                         5.2            1.0                       6.2             (3.7)             -                      (3.7)
             Operating margin                                                                              7.4%                                     8.8%                  -                                       -
                                      2
           Corporate overhead                                                                              30.8          (11.0)                     19.8              28.6           (4.3)                     24.3
           Operating income (loss)                                                                       ($57.0)         $12.0                   ($45.0)           ($87.4)           $4.3                   ($83.1)

      1.   In the three months ended August 31, 2020, the Company recognized pretax severance of $1.0.

      2.   In the three months ended August 31, 2020, the Company recognized pretax severance of $11.0. In the three months ended August 31, 2019, the Company recognized pretax severance of $2.8 and a pretax settlement expense
           of $1.5.

 17
Question & Answer

Participants

• Richard Robinson

• Kenneth Cleary

   18
You can also read