Visitor Demand Mapping - for Queenstown Short term 90 day forward outlook & long term scenarios Published on Friday 30 April 2021
←
→
Page content transcription
If your browser does not render page correctly, please read the page content below

Visitor Demand Mapping
   for Queenstown
      Short term 90 day forward outlook & long term scenarios
      Published on Friday 30 April 2021

                                                                Visitor Demand Mapping for Queenstown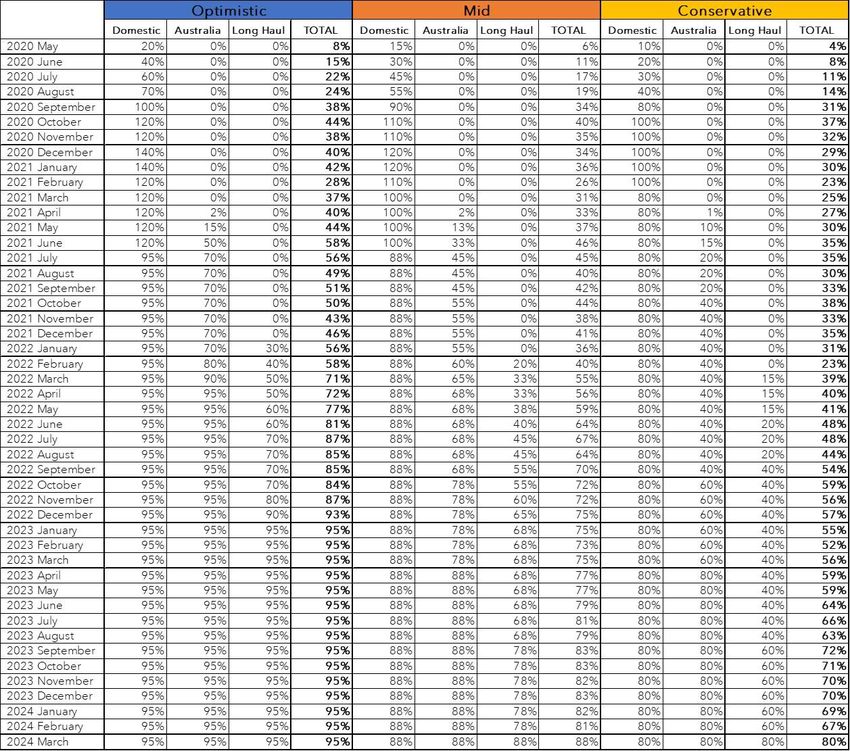
Short term visitation
 90 Day Forward Outlook
Overview                                                              Data Sources

Destination Queenstown has developed a 90 day forward out-
look chart indicating the current levels of accommodation oc-
cupancy in Queenstown. This is based on collated information
from multiple data sets covering commercial and non-com-
mercial accommodation. The 90 day forward outlook chart is
weighted 80% on currently booked forward occupancy rates
and 20% on predictive forward booking data.

The objective of this 90 day forward outlook chart is to assist
local tourism businesses like activities, attractions, retail, bars
and restaurants to manage their operating days/hours, supply
and staffing in alignment with the forward outlook.

Frequency
DQ will publish the report at the end of the month for the
upcoming 90 day period included in the Visitor Demand Map-
ping Resource. There will be weekly refreshes of the forward

                                                                                     Visitor Demand Mapping for Queenstown
outlook chart which will be posted in the DQ Member (Visitor
Demand Mapping) area of the DQ website. Click HERE to
access previous outlooks.

Feedback

For feedback, more information or clarifications about the
content below or if you are interested in supplying
your accomodations data toward the dataset please contact
Kiran Nambiar.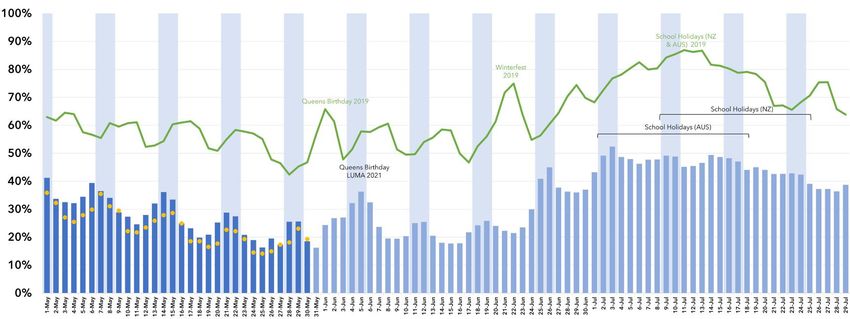
Next 30 Days

                                                                                                                                                                             Following 60 Days

                Short term visitation                                                                                                                                        Weekend

                                                                                                                                                                             Pick up (from last publication)

                 90 Day Forward Outlook                                                                                                                                      Historical (pre-COVID - 2019)

                                                                                                                                                                             Ski Field opens
Occupancy (%)

                                                                                                                                                           Welcome to
                                                                                                                                                           winter event

                                                                                                                                                                                                                    Visitor Demand Mapping for Queenstown
                                                                                                                   Cardrona                      Remarkables
                                                                                                                   Coronet Peak                  Treble Cone

                This edition published on Friday 30 April 2021 indicates the current demand for the 30 day period 1 May 2021 to 30 May 2021 (plus the following 60
                days). The next update will be on Friday 7 May for the following 30 days (plus 60 days).

                Disclaimer: This tool represents only a potential scenario for what occupancy could look like over the coming period, it is not an actual forecast. This tool has been created solely for the use
                of Destination Queenstown Members, and is not for publication or dissemination.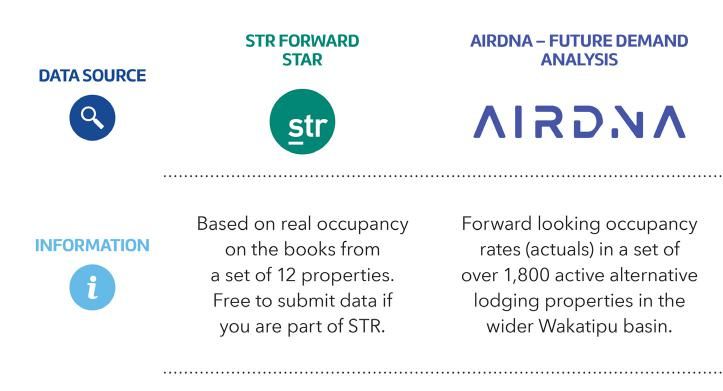
Long term visitation
  Visitor Demand Mapping
This is an update to the Visitor Demand Mapping for Queenstown-Lakes (2020 to 2024) report published on Thursday, May 14, 2020. You can view the full
version of the earlier report here. For further feedback, more information or clarifications about the content below please contact Kiran Nambiar.

Covid-19 Situation                                        Vaccine                                                    Global Vaccination Campaign
At the time of publishing, there have been 148.3 mil-     Currently there are 91 vaccines in clinical evaluation     Doses administered per 100 people
lion confirmed cases of Covid-19 globally. As different   with 27 reaching the final phases of testing in large
variants emerge, different countries are experiencing     scale efficacy tests in human candidates. A total of
some of the worst peaks of their outbreaks to date.       eight vaccines are now available for early or limited
                                                          use with a further five approved in early or limited
The split of vaccinated vs non vaccinated popula-         use. There are a further 184 potential vaccines in pre-
tions is becoming evident with countries such as          clinical evaluation.
America, England and Canada experiencing lower
infection rates and lower death rates compared to         For further information about vaccine development
other countries like India, Brazil, Iran and Paraguay.    and approvals check out the New York Times Corona-
India for example, set a new global daily case record     virus Vaccine Tracker by clicking HERE.
with 349,641 confirmed infections in just one day on
Sunday 25 April.                                          New Zealand has agreements in place with four sup-
                                                          pliers for vaccines. The vaccines are Pfizer (10 million
Daily Global new cases & 7 day average                    doses, approved by Medsafe), Janssen Pharmaceu-
                                                          tica (5 million doses), Novavax (10.72 million doses)
                                                          and AstraZeneca (3.8 million doses). For further infor-    Global Vaccination Campaign
                                                          mation about each of the vaccines that New Zealand         Top 10 countries in vacination progress
                                                          will have access to, click HERE.

                                                                                                                                                               Visitor Demand Mapping for Queenstown
                                                          Vaccine Roll Out
                                                          At the time of publishing, 1.08 billion doses in 172
                                                          countries have been administered, according to data
                                                          collected by Bloomberg. The latest global vaccination
                                                          rate was roughly 20.3 million doses a day on average.

                                                          For Bloomberg’s full breakdown of vaccination prog-
                                                          ress, vaccine contracts in place for each country click
                                                          HERE.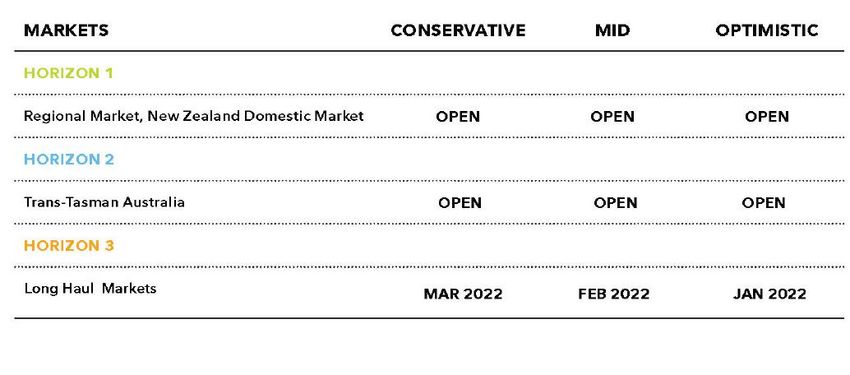
Long term visitation
  Visitor Demand Mapping
New Zealand Roll Out                                      NZ Doses Administered by Day                                Vaccines & Travel
As New Zealand enters its third month of vaccine roll                                                                 Vaccination rates are increasing globally - albeit at
out, 172,564 first doses have been administered with                                                                  a highly inconsistent rate in different countries – but
a further 60,024 second doses administered taking                                                                     there continues to be a lack of consistency around the
New Zealand’s total dose number to 232,588 as of                                                                      implementation of travel passports. Because of this,
27 April 2021. The pace of vaccination is gradually                                                                   it is becoming apparent that reaching some form of
increasing with 49,237 doses being administered                                                                       travel as we once knew may be a long way off yet.
in the seven days prior to 27 April 2021 as the sec-
ond group of people (high risk frontline workers                                                                      In an effort to curb potential outbreaks at the New
and people living in high risk places) are receiving                                                                  Zealand border, a new “very high risk” country catego-
vaccinations. Depending on vaccine supply, group                                                                      ry has been created which applies further restrictions
three (people who are at risk of getting very sick from                                                               on travel from certain countries. Currently the coun-
COVID-19) is expected to receive vaccinations in late                                                                 tries in this category are: India, Brazil, Pakistan, and
May followed by group four (general population) in        Australia Roll Out                                          Papua New Guinea.
July (time frames dependent on vaccination supply).       Australia is in a similar situation to New Zealand with
                                                          vaccine supply constraints and slower than expected         The USA’s national public health agency, The Centers
The Ministry of Health is expecting 8,000,000 doses       roll outs. So far there have been 1.97 million doses        for Disease Control and Prevention (CDC), has updat-
to have been administered by end of November              delivered - approximately enough to cover 3.9% of           ed its travel recommendations saying both domestic
2021. Currently the major constraint is physically        their total population.                                     and international travel is low risk for fully vaccinated
getting the vaccines to New Zealand – the bulk of the                                                                 Americans but travellers must continue to take pre-
Pfizer vaccine is expected in the country in the later    The Australian Government has secured a total of            cautions like mask wearing. US officials are still urging
half of 2021. For further details about the progress of   170 million doses. Their roll out strategy has been         Americans not to travel unless they absolutely must.
New Zealand’s vaccine roll out, click HERE.               affected by supply issues and vaccine nationalism

                                                                                                                                                                                  Visitor Demand Mapping for Queenstown
                                                          due to the European Union barring delivery of over
NZ Cumulative planned and projected doses                 3 million Pfizer vaccines from Italy. The Australian
                                                          roll out strategy is also heavily based and reliant on
                                                          the locally made AstraZeneca vaccine; however the
                                                          Health Ministry has officially advised Australians over
                                                          50 not to have this vaccine. The roll out is likely to be
                                                          a key focus, particularly due to the fact that 2021 is
                                                          election year.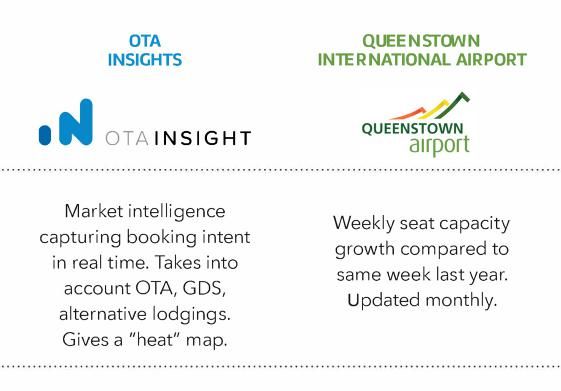
Long term visitation
  Visitor Demand Mapping
Updates to timeline                                       Timeline
Several sources have been checked and com-
pared in order to develop the timeline expecta-
tions. For this update, we have moved forward the
start date for the Australian horizon to April - inline
with the announcement made on 6 April and the
border opening 19 April 2021.

We have kept our assumptions conservative for
the first few months prior to ski season as Tourism
New Zealand and the Government have suggest-
ed that majority of travel will likely be for those
visiting friends and relatives. Winter is shaping up
to be a different story with Air New Zealand stating
that “Queenstown will see an influx of Aussies in
July and September” and its expected there will
be pent up demand for travel from our Australian
neighbours.

In this update, we have also compared the time            For reference please find links to:
frames and recovery projections with Tourism New

                                                                                                                                            Visitor Demand Mapping for Queenstown
Zealand’s scenario modelling, the Tourism Export
Council’s Forecasts and 6 April post-Cabinet press        New Zealand Government: 6 April post-Cabinet press conference
conference (link HERE). As mentioned, the Austra-
lia market is now open but the Long Haul Markets          Tourism New Zealand (released 17 December, 2020): December Scenario Modelling
time frames have remained the same.
                                                          Tourism Export Council Modelling visual roadmap: Best case forecast, Acceptable
                                                          fore-cast, Worst case forecast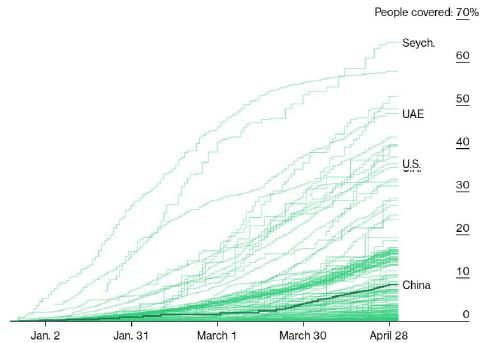
Long term visitation
  Visitor Demand Mapping

                                                                                                                                                                                                                 Visitor Demand Mapping for Queenstown
Note regarding MRTE’s
Please note that we have used the Monthly Regional Tourism Estimates as the measure for these scenarios. MBIE have acknowledged that there have been significant changes within the tourism industry which has
impacted the underlying assumptions within their modelling. MBIE encourage caution when interpreting results. Please interpret these scenerios with caution.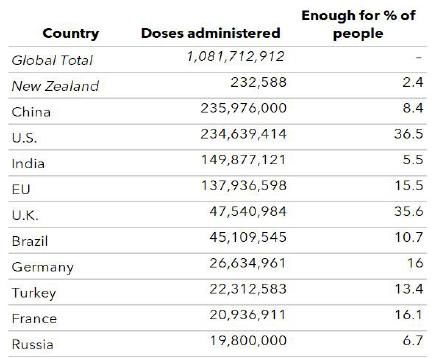
Long term visitation
  Visitor Demand Mapping - COVID cases (WHO)
New Zealand            Austalia

China                  United States

                       South Korea
United Kingdom

                                               Visitor Demand Mapping for Queenstown
Japan                  Germany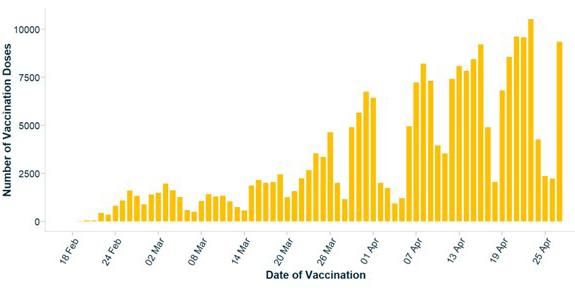
Long term visitation
  Visitor Demand Mapping - WHO COVID cases
Canada                 India

Singapore              Global

                                             Visitor Demand Mapping for Queenstown
You can also read