Q3 2018 Trading update and guidance change - 15 October 2018
←
→
Page content transcription
If your browser does not render page correctly, please read the page content below

Q3 2018 Trading update and
guidance change
15 October 2018

                     0
Disclaimer
THIS PRESENTATION IS NOT FOR RELEASE, PUBLICATION OR DISTRIBUTION, IN WHOLE OR IN PART, IN OR INTO THE UNITED STATES OF AMERICA, ITS TERRITORIES OR POSSESSIONS, OR TO ANY
RESIDENT THEREOF OR ANY OTHER JURISDICTION WHERE SUCH DISTRIBUTION WOULD BE UNLAWFUL OR TO ANY OTHER PERSON.

This presentation (the “Presentation”) is being furnished to each recipient in connection with ConvaTec Group Plc (“ConvaTec” and, together with its subsidiaries, the “Group”) and has been prepared from publicly available
information. For the purposes of this notice, “Presentation” means this document, its contents or any part of it, any oral presentation, any question or answer session and any written or oral material discussed or distributed
before, during or after the Presentation meeting. This information, which does not purport to be comprehensive, has not been verified by or on behalf of the Group.
The information, statements and opinions contained in this Presentation do not constitute an offer to sell or a solicitation of an offer to buy any securities, and are not for publication or distribution in, the US or to persons in the
US (within the meaning of Regulation S under the US Securities Act of 1933, as amended (the “Securities Act”)), Canada, Japan, Australia or any other jurisdiction where such distribution or offer is unlawful. Any securities
referred to in this Presentation and herein have not been, and will not be, registered under the Securities Act, and may not be offered or sold in the United States absent registration under the Securities Act except to qualified
institutional buyers (“QIBs”) as defined in Rule 144A under the Securities Act (“Rule 144A”) or pursuant to another exemption from, or in transactions not subject to, the registration requirements of the Securities Act. Subject to
certain limited exceptions, neither this Presentation nor any copies of it may be taken, transmitted or distributed, directly or indirectly, into the US, its territories or possessions. The distribution of this Presentation in other
jurisdictions may be restricted by law and persons into whose possession this Presentation comes should inform themselves about, and observe, any such restrictions. Any failure to comply with the foregoing restrictions may
constitute a violation of securities laws.
This Presentation does not constitute an offer or invitation for the sale or purchase of securities or any businesses or assets described in it, nor should any recipients construe the Presentation as legal, tax, regulatory, or
financial or accounting advice and are urged to consult with their own advisers in relation to such matters. Nothing herein shall be taken as constituting investment advice and this Presentation should not be construed as a
prospectus or offering document and investors should not subscribe for or purchase any securities on the basis of this Presentation and it is not intended to provide, and must not be taken as, the basis of any decision and
should not be considered as a recommendation to acquire any securities of the Group. The recipient must make its own independent assessment and such investigations as it deems necessary.
This Presentation includes statements that are, or may be deemed to be, “forward looking statements”. These forward-looking statements involve known and unknown risks and uncertainties, many of which are beyond the
Group’s control. “Forward-looking statements” are sometimes identified by the use of forward-looking terminology, including the terms “believes”, “estimates”, “aims” “anticipates”, “expects”, “intends”, “plans”, “predicts”, “may”,
“will”, “could”, “shall”, “risk”, “targets”, forecasts”, “should”, “guidance”, “continues”, “assumes” or “positioned” or, in each case, their negative or other variations or comparable terminology. These forward-looking statements
include all matters that are not historical facts. They appear in a number of places and include, but are not limited to, statements regarding the Group’s intentions, beliefs or current expectations concerning, amongst other
things, results of operations, financial condition, liquidity, prospects, growth, strategies and dividend policy of the Group and the industry in which it operates.
By their nature, forward-looking statements involve risks and uncertainties because they relate to events and depend on circumstances that may or may not occur in the future. These statements are necessarily based upon a
number of estimates and assumptions that, while considered reasonable by the Company, are inherently subject to significant business, economic and competitive uncertainties and contingencies. As such, no assurance can
be given that such future results, including guidance provided by the Group, will be achieved; actual events or results may differ materially as a result of risks and uncertainties facing the Group. Such risks and uncertainties
could cause actual results to vary materially from the future results indicated, expressed, or implied in such forward-looking statements. Forward-looking statements are not guarantees of future performance and the actual
results of operations, financial condition and liquidity, and the development of the industry in which the Group operates, may differ materially from those made in or suggested by the forward-looking statements set out in this
Presentation. Past performance of the Group cannot be relied on as a guide to future performance. Forward-looking statements speak only as at the date of this Presentation and the Company and its directors, officers,
employees, agents, affiliates and advisers expressly disclaim any obligations or undertaking to release any update of, or revisions to, any forward-looking statements in this Presentation.
To the extent available, the industry and market data contained in this Presentation has come from third party sources. Third party industry publications, studies and surveys generally state that the data contained therein have
been obtained from sources believed to be reliable, but that there is no guarantee of the accuracy or completeness of such data. In addition, certain of the industry and market data contained in this Presentation come from the
Company's own internal research and estimates based on the knowledge and experience of the Company's management in the market in which the Company operates. While the Company believes that such research and
estimates are reasonable and reliable, they, and their underlying methodology and assumptions, have not been verified by any independent source for accuracy or completeness and are subject to change without notice.
Accordingly, undue reliance should not be placed on any of the industry or market data contained in this Presentation.
Unless otherwise stated all stated financial metrics in this presentation are adjusted; for a full definition of the adjustments see 2017 Annual Report.

                                                                                                                1
Q3 2018 Key points
            •     Guidance for FY 2018 revised
                      •     Primarily due to change in inventory policy by biggest customer in Infusion Devices:
                            $18 to $23 million impact in Q4
                      •     Challenging dynamics in specific Wound Care markets
                      •     FY 2018 organic revenue growth now expected to be flat to +1.0%
                      •     Adjusted EBIT margin guidance now 23% to 24%, reflecting lower revenues and
                            adverse mix
            •     Q3 Group revenue +0.4% organic1; +2.9% CER2; +1.5% reported
                      •     Advanced Wound Care disappointing
                      •     Ostomy Care improved performance vs Q2
                      •     Continence & Critical Care impacted by Slovakia repackaging, as previously indicated
                      •     Infusion Devices negative growth, as expected

1 Organic growth is growth at constant exchange rates (“CER”), excluding M&A activities
2 Constant exchange rates
                                                                                          2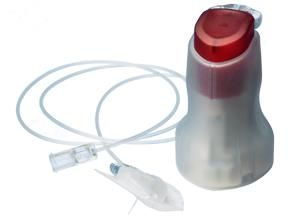
Q3 2018: Franchise Summary
                                                                               Q3 2018 Revenue ($m)                                                 Q3 Organic Growth1

                         Advanced                                                               146.8                                                             +0.8%
                        Wound Care

                       Ostomy Care                                                              131.4                                                             +1.5%

                       Continence &                                                             107.5                                                             +1.4%
                       Critical Care

                             Infusion                                                             66.5                                                             -3.7%
                             Devices

                      Total Revenue                                                             452.2                                                             +0.4%

1 Organic growth is growth at constant exchange rates (“CER”), excluding M&A activities. M&A contributed $12.3 million of revenue in Q3 2018, all in Continence & Critical Care. In addition, Q3 2017
included $1.4 million of revenue for the Symbius respiratory business which was divested on 1 March 2018.

                                                                                                             3
Advanced Wound Care
Growth below expectations

       Q1 18 +2.2%1                                    Q2 18 -0.2%1
                                                                                          • Good performance from AQUACELTM Ag+
                                                                                            anti-biofilm and Foam

                                Q3       +0.8%1                                           • Trends in Base AQUACELTM and DuoDERMTM
                                                                                            normalising. Skin care remains a drag
                                                                                          • Surgical cover dressing recovery taking longer
                                                                                            than expected
                                                                                          • UK challenging market dynamics
                                                                                          • AQUACELTM Ag Advantage2 launched in US

1 Organic growth is growth at constant exchange rates (“CER”), excluding M&A activities
2 AQUACELTM Ag Advantage is the US brand name for AQUACELTM Ag+

                                                                                          4
Ostomy Care
New products and impact of patient losses
Q1 18 -2.5%1 Q2 18 +0.3%1
• Impact of patient loss at top of 50 – 100 bps
range for Group organic revenue growth
• Good performance in Latam, Asia Pacific,
Q3 +1.5%1 positive trends in smaller European markets
• Strong performance from new products:
Natura™ Accordion Flange, Esteem™+ Flex
Convex, and EuroTec’s Varimate strips
• me+™ momentum continues
• Vizient GPO contract 2 year extension2
1 Organic growth is growth at constant exchange rates (“CER”), excluding M&A activities
2.Contract extension until June 2021
5Continence & Care
Strong underlying momentum offset by expected headwinds
Q1 18 +5.6%1 Q2 18 +5.9%1 • c. 5.5% organic growth excluding packaging
recall and product rationalisation
• Strong performance from US Home
Distribution Group3
Q3 +1.4%1
• GentleCath™ Glide performing well in US
• Q3 impacted by Slovakia packaging recall
c.$3.5m and product rationalisation2 c.$0.5m
• Next gen catheter CE marked and being
trialled in Europe
1 Organic growth is growth at constant exchange rates (“CER”), excluding M&A activities. CER growth of 12.8% in Q3 18 included $9.7 million revenue from Woodbury Holdings and $2.6
million from J&R Medical. Revenue in Q3 2017 included $1.4 million from the Symbius respiratory business which was divested on 1 March 2018.
2 FY 2018 product rationalisation impact expected to be c.$2.4 million, $1.6 million YTD
3 Home Distribution Group, a business unit formed in 2017 for catheter and incontinence related products, encapsulating the US distribution companies of 180 Medical, Symbius Medical,
South Shore Medical Supply, Wilmington Medical Supply, Woodbury Holdings and J&R Medical.
6Infusion Devices
Performance impacted by inventory changes and ordering patterns
Q1 18 +16.3%1 Q2 18 +2.7%1
• Continuing good underlying demand in insulin
pump market
Q3 -3.7%1 • Q3 performance reflects strong tailwinds in H1
and prior year comparator
• Change in inventory policy by biggest
customer and distorted ordering patterns in Q4
• Expect $18 – $23 million lower revenue in
Q4
1 Organic growth is growth at constant exchange rates (“CER”), excluding M&A activities.
7Summary and Outlook
Q3 2018
• Advanced Wound Care disappointing
• Improved performance from Ostomy Care
• Performance in Continence & Critical Care reflects headwinds, as expected
• Infusion Devices performance reflects tailwinds in H1 and strong prior year comparator
FY 2018
• Anticipate $18 to $23 million lower revenue in Q4 in Infusion Devices
11.4% 11.9%
• FY 2018 organic revenue growth now expected to be flat to +1.0%1
• Adjusted EBIT margin guidance now 23% to 24%
23.1%
• Cost out 22.4%2019
update in February
1 Organic growth is growth at constant exchange rates (“CER”), excluding M&A activities
8Q&A 9
Appendix

           10
Quarterly Revenue Performance
Quarterly reported revenues by franchise Organic1 growth rate by franchise (%)
2017 2018 2017 2018
$m Q2 Q3 Q4 Q1 Q2 Q3 Q2 Q3 Q4 Q1 Q2 Q3
AWC 138.4 147.9 157.8 147.1 142.9 146.8 2.6 1.4 2.3 2.2 (0.2) 0.8
11.4%
Ostomy
132.9 132.1 11.9%
142.2 128.0 138.0 131.4 3.6 (1.8) 0.3 (2.5) 0.3 1.5
Care
C&CC 89.6 96.2 111.6 108.4 111.7 107.5 (2.0) 4.5 4.6 5.6 5.9 1.4
23.1% 22.4%
ID 67.3 69.3 76.2 74.7 70.5 66.5 1.7 17.3 6.3 16.3 2.7 (3.7)
Group 428.2 445.5 487.8 458.2 463.1 452.2 1.8 3.3 2.8 3.7 1.7 0.4
1 Organic growth presents year on year growth at constant exchange rates (“CER”), excluding M&A activities
11Revenues By Geography
Q3 2018 reported
Reported growth Organic growth1
($m)
EMEA 184.6 (0.4)% +1.3%
Americas 231.9 +2.8% (1.1)%
APAC 35.7 +3.2% +5.5%
Group 452.2 +1.5% +0.4%
1 Organic growth presents year on year growth at constant exchange rates (“CER”), excluding M&A activities
1213
You can also read