First Quarter 2021 Earnings Presentation - Oslo, April 22, 2021
←
→
Page content transcription
If your browser does not render page correctly, please read the page content below

First Quarter 2021 Earnings Presentation
Oslo, April 22, 2021

Cautionary Statement

     ▪ This presentation contains forward looking information

     ▪ Forward looking information is based on management
       assumptions and analyses

     ▪ Actual experience may differ, and those differences may be material

     ▪ Forward looking information is subject to significant uncertainties
       and risks as they relate to events and/or circumstances in the future

     ▪ This presentation must be read in conjunction with the Q1 2021 Earnings
       Release and the disclosures therein

                                                                                 -2-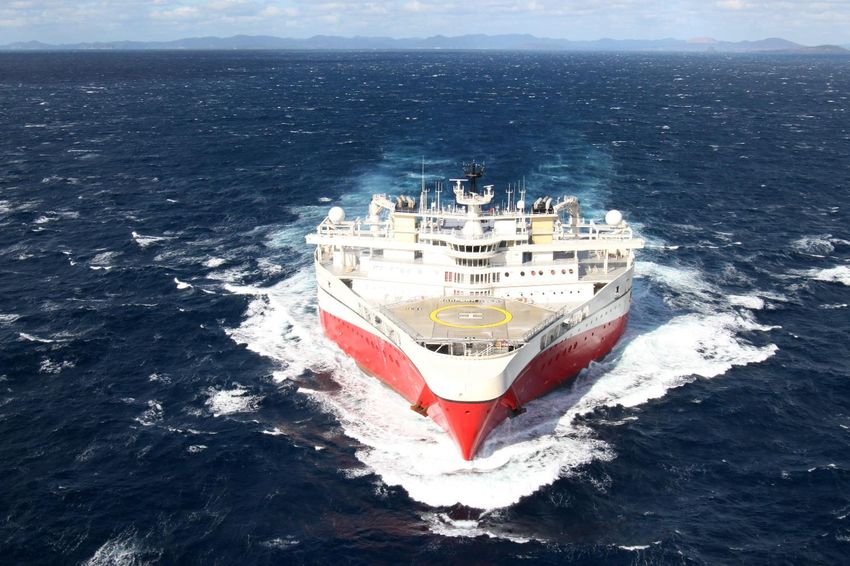
Q1 2021 Takeaways:
Encouraging MultiClient Sales – Improving Vessel Utilization

                                   ▪ Solid MultiClient performance
                                      – Late sales of $49.2 million
                                      – Strong client commitment for new projects

                                   ▪ Positive order book development
                                      – General demand increase
                                      – Deferred 2020 work coming back

                                   ▪ Reactivating Ramform Vanguard

                                   ▪ Established PGS New Energy headed by EVP Berit
                                     Osnes

                                   ▪ Completed deferral of debt maturities and amortizations
                                                                                               -3-
Financial Summary
Segment Revenues and Other Income Segment EBITDA*
194
300 288 200
160
234
216 150 135
130
USD million
USD million
200
168 173
99
142 100 88 84
139 132 81
116 67
100
50
0 0
100 Segment EBIT** Cash Flow from Operations
200
80 176
70
152
60 150
119
38
USD million
40
USD million
108
95
20 100 89
20 18
7 68 66
1 57
0
50
-20 -14
-16
-29 0
-40
*EBITDA, when used by the Company, means EBIT excluding Other charges, impairment and loss/gain on sale of long-term assets and depreciation and amortization as defined in Note 14 of the Q1 2021 earnings release published on April 22, 2021
**Excluding impairments and Other charges. -4-
Increasing Order Book

              300
                                ▪ Order book of $237 million on March 31,
                                  2021
                                   – $72 million relating to MultiClient
              200
                                   – Further order book added after quarter-
USD million

                                     end

              100
                                ▪ Vessel booking*
                                   – Q2 21: 17 vessel months
                                   – Q3 21: 15 vessel months
                                   – Q4 21: 4 vessel months
                0

       *As of April 20, 2021.                                              -5-
Financials
          Unaudited First Quarter 2021 Results

This presentation must be read in conjunction with the Q1 2021 Earnings Release and the disclosures therein.
Consolidated Key Financial Figures
Q1 Q1 Full year
(In millions of US dollars, except per share data) 2021 2020 2020
Profit and loss numbers Segment Reporting
Segment revenues and Other Income 132.2 168.3 595.9
Segment EBITDA 84.1 80.5 397.7
Segment EBIT ex. Impairment and other charges, net (13.9) (15.8) 12.2
Profit and loss numbers As Reported
Revenues and Other Income 165.7 128.8 512.0
EBIT (2.3) (80.2) (188.0)
Net financial items (33.6) (35.1) (118.4)
Income (loss) before income tax expense (35.9) (115.3) (306.4)
Income tax expense (3.2) (2.2) (15.1)
Net income (loss) to equity holders (39.1) (117.5) (321.5)
Basic earnings per share ($ per share) ($0.10) ($0.32) ($0.85)
Other key numbers
Net cash provided by operating activities 88.6 176.0 366.5
Cash Investment in MultiClient library 43.3 67.6 222.3
Capital expenditures (whether paid or not) 6.2 12.3 36.1
Total assets 1,971.2 2,335.9 2,093.8
Cash and cash equivalents 143.9 266.9 156.7
Net interest bearing debt 967.8 876.5 937.6
Net interest bearing debt, including lease liabilities following IFRS 16 1,116.8 1,052.5 1,096.2
Q1 2021 Net financial items include net charges of $6.2 million relating to various effects of implementing the agreements to amend
debt and accounting for the derivative element of the convertible bond. For details, see disclosures in the Q1 2021 Earnings Release.
The accompanying unaudited financial information has been prepared under IFRS. This information should be read in conjunction with the Q1 2021 Earnings Release issued April 22, 2021. -7-Q1 2021 Operational Highlights
Contract revenues Segment MultiClient revenues
120.0 100% 200 200%
104 90%
100.0 94
80%
85 150 150%
76 70%
80.0
USD million
USD million
69 56
60% 54 113
164
60.0 50% 100 84 70 100%
46
45 41 44 40% 36
34 49
40.0 31 28
30 30% 61 34
26 50 50%
21 94 96 95
20%
20.0 59 67 65 66 61
9 50 46
10% 34 41
30
0.0 0% 0 0%
Q1 18 Q2 18 Q3 18 Q4 18 Q1 19 Q2 19 Q3 19 Q4 19 Q1 20 Q2 20 Q3 20 Q4 20 Q1 21 Q1 18 Q2 18 Q3 18 Q4 18 Q1 19 Q2 19 Q3 19 Q4 19 Q1 20 Q2 20 Q3 20 Q4 20 Q1 21
MultiClient pre-funding MultiClient late sales Pre-funding as % of MC cash investments
Contract revenues % active 3D capacity allocated to contract
Targeted pre-funding level 80-120%
▪ Contract revenues of $25.5 million ▪ Total Segment MultiClient revenues of $95.5
– 38% of active time used for Contract acquisition million
– Ramform Sovereign used as a source vessel on – Pre-funding level of 107%
dual vessel contract project and included in – Late sales of $49.2 million
contract utilization statistics
-8-Pre-funding and Late Sales Revenues Combined:
Segment MultiClient Revenues by Region
200
175
▪ West Africa and Middle East
150
were the main contributors to
125
pre-funding revenues in Q1
USD million
2021
100
75
▪ Europe and Asia Pacific were
50 the main contributors to late
sales
25
0
Q1 19 Q2 19 Q3 19 Q4 19 Q1 20 Q2 20 Q3 20 Q4 20 Q1 21
Europe Africa Middle East N. America S. America Asia Pacific
9Seismic Streamer 3D Fleet Activity in Streamer Months:
Vessel Allocation* and Utilization
Quarterly vessel allocation
100%
▪ 89% active vessel time in Q1 2021
80%
– Five active vessels
– Ramform Sovereign operated as
60%
source vessel on contract project
40%
▪ Planned Q2 vessel allocation
– Overweight of contract work
20%
– Significant vessel relocations
– Six active vessels
0%
Q1 19 Q2 19 Q3 19 Q4 19 Q1 20 Q2 20 Q3 20 Q4 20 Q1 21
Contract MultiClient Steaming Yard Stacked/Standby
* The vessel allocation excludes cold-stacked vessels.
-10-Cost* Focus Delivers Results
Gross cash cost*
154 154
150
136
148
142 ▪ Sequential cost increase
driven by higher activity
110
USD million
100
92 ▪ Q2 cost will increase due to
82 80
one additional 3D vessel in
operation
50
-
Q1 19 Q2 19 Q3 19 Q4 19 Q1 20 Q2 20 Q3 20 Q4 20 Q1 21
Cost of Sales Research and development costs Selling, general and administrative costs
*Gross cash cost are defined as the sum of reported net operating expenses (excluding depreciation, amortization, impairments, deferred steaming and Other charges) and the cash operating costs capitalized as investments in the MultiClient library as
well as capitalized development costs. -11-Balance Sheet Key Numbers As Reported
March 31 March 31 December 31
In millions of US dollars 2021 2020 2020
Total assets 1,971.2 2,335.9 2,093.8
MultiClient Library 578.5 608.8 616.1
Shareholders' equity 370.9 611.8 396.4
Cash and cash equivalents (unrestricted) 143.9 266.9 156.7
Restricted cash 71.9 41.4 76.6
Gross interest bearing debt 1,183.6 1,184.8 1,170.9
Gross interest bearing debt, including lease liabilities following IFRS 16 1,332.6 1,360.8 1,329.5
Net interest bearing debt 967.8 876.5 937.6
Net interest bearing debt, including lease liabilities following IFRS 16 1,116.8 1,052.5 1,096.2
▪ Cash and cash equivalents (unrestricted) of $143.9 million
▪ MultiClient library of $578.5 million based on IFRS - $533.6 million according to Segment Reporting
▪ Debt re-scheduling process completed in Q1 2021, all interest-bearing debt re-classified to long term
The accompanying unaudited financial information has been prepared under IFRS. This information should be read in conjunction with the Q1 2021 Earnings Release issued April 22, 2021. -12-Consolidated Statements of Cash Flows Summary
Q1 Q1 Full year
In millions of US dollars 2021 2020 2020
Cash provided by operating activities 88.6 176.0 366.5
Investment in MultiClient library (43.3) (67.6) (222.1)
Capital expenditures (8.3) (10.4) (32.8)
Other investing activities (2.2) (2.4) 0.3
Net cash flow before financing activities 34.8 95.6 111.9
Proceeds, net of deferred loan costs, from issuance of non-current debt/net cash payment for debt amendment* (18.4) 124.2 124.2
Interest paid on interest bearing debt (19.9) (15.6) (73.7)
Repayment of interest bearing debt - (226.3) (240.3)
Net change drawing on RCF - 170.0 170.0
Payment of lease liabilities (recognized under IFRS 16) (11.9) (13.5) (53.8)
Decrease (increase) in non-current restricted cash related to debt service 2.6 - (14.1)
Proceeds from share issue - 91.9 91.9
Net increase (decr.) in cash and cash equiv. (12.8) 226.3 116.1
Cash and cash equiv. at beginning of period 156.7 40.6 40.6
Cash and cash equiv. at end of period 143.9 266.9 156.7
▪ Lower cash flow from operations compared to Q1 2020 driven by lower sales in the preceding quarter, partly offset by
lower cost base, and relatively less release of working capital as some receipts delayed into Q2
▪ Net payments of $18.4 million related to debt amendments represent the fees and expenses offset by cash proceeds
from the convertible bond issue
The accompanying unaudited financial information has been prepared under IFRS. This information should be read in conjunction with the Q1 2021 Earnings Release issued April 22, 2021. -13-Completing Debt Re-scheduling and Issuing Convertible Bond
▪ In Q1, 2021 the transaction to re-schedule debt maturities and amortizations became effective
▪ Deferral of all scheduled debt maturities and amortizations to September 2022 and beyond
▪ As a part of the transaction, the Company issued a NOK 116.2 million 3-year 5% unsecured convertible
bond in the quarter
– The conversion right is treated as a separate derivative financial instrument measured at fair value, resulting in an
equity conversion option valued to $9.9 million and a debt component valued to $3.5 million as of February 9, 2021
– The separate derivative financial instrument will, until conversion be reported as a liability (in “other current
liabilities”) at fair value with changes in fair value reported as gain or loss (in “Other Financial Expense, net”). Upon
conversion, the fair value will be reported as a contribution to equity
▪ Bondholders representing NOK 21.0 million have converted as of April 22, 2021 with NOK 95.2 remaining
of the convertible bond
14Main Terms of the Transaction
▪ No scheduled debt maturities until September 2022
– The $350 million RCF(1) converted into a new TLB on the same terms as the 2024 TLB
– The 5% annual amortization in 2021 and 2022 on the original 2024 TLB is removed
– The combined TLB facilities of ~$873 million(2) maturing in March 2024 will have following amortization profile:
• ~$135 million amortization payment in September 2022
• $200 million amortization payment in September 2023
• ~$9 million quarterly amortization starting March 2023
– ECF amortization totalling ~$106 million due over the next two years deferred and repaid over four quarters starting December 2022
▪ Excess liquidity sweep
– Excess liquidity sweep for liquidity reserve above $200 million at each quarter end to be applied to the deferred amortization amounts under the ECF and the ~$135
million TLB amortization until both have been repaid
– Thereafter, excess liquidity sweep for liquidity reserve above $175 million to be applied against the remaining TLB
▪ Financial maintenance covenants
– Maximum net leverage ratio of 4.5x through June 30, 2021, 4.25x through December 31, 2021, 3.25x through December 31, 2022 and 2.75x thereafter
– Minimum liquidity reserve of $75 million
▪ Convertible Bond
– Issuance of a NOK 116.2 million 3-year 5% unsecured convertible bond (the “CB”) convertible into new PGS shares at NOK 3 per share (maximum of 38,720,699
shares)
– PGS can require that bondholders convert the CB into shares if the PGS share price exceeds NOK 6 for 30 consecutive trading days
▪ Other
– Fees to lenders of $8.0 million payable in cash and $8.4 million payable in kind (excludes costs for legal and financial advisors for PGS and the lender groups)
– Strengthening of security package
(1) $135 million maturing September 2020 and $215 million maturing September 2023
(2) Includes increase in principal due to payment-in-kind fees and reduction in principal due to lenders electing to exchange part of their existing debt into convertible bonds. The net effect of these two adjustments is not material
15Rescheduled Debt Maturities to Preserve Liquidity
Pre-existing amortization profile New amortization profile
USD millions USD millions
600 600
14
47
500 500
47
400 400
300 300 138
47
501
26 439
200 200
24 28
3
237
100 215 100
215
135 135
47
24 24 42 42
26 13 13 26 18 26 18
0 0
2H 20 2021 1H 22 2H 22 2023 2024 2025 2026 2027 2H 20 2021 1H 22 2H 22 2023 2024 2025 2026 2027
2020 RCF 2023 RCF TLB ECF TLB ECF CB
▪ Quarterly excess liquidity sweep above $200 million to TLB and ECFs until the first $135 million amortization for TLB and
deferred amortizations for ECFs are repaid in full
▪ Thereafter, TLB to benefit from a quarterly excess liquidity sweep above $175 million, which will replace the current excess
cash flow sweep
16Operational Update and Market Outlook
Unaudited First Quarter 2021 Results
This presentation must be read in conjunction with the Q1 2021 Earnings Release and the disclosures therein.Fleet Activity April 2021
Ramform Hyperion
Ramform Vanguard
(UK/Norway)
Ramform Tethys
Ramform Sovereign
(Egypt)
Ramform Titan
(Steaming to Canada)
Ramform Atlas
(Steaming to Canada)PGS New Energy
▪ PGS New Energy established in Q1 and is
lead by Berit Osnes
▪ Will develop energy transition business
opportunities building on PGS expertise and
assets
▪ Activities can include:
– Carbon Capture & Storage (CCS)
– Marine minerals
– Geothermal
– Site surveying
– Near surface geo-hazards for wind farms
19Increasing 2021 Contract Leads Volume
2500
▪ Improving contract leads and bids
2000
– General demand increase combined with
1500
deferred 2020 work coming back
USD million
1000
▪ Most contract bids in EAME and South
America
500
0
Active Tenders Marine Contract All Sales Leads Marine Contract (Including Active Tenders)
PGS In-house Contract Bids+Leads
Contract bids to go (in-house PGS) and estimated $ value of bids + risk weighted leads as of end March 2021
20Lowest Quarterly Streamer Supply Since mid 1990s
Number of
streamers
700
600
500
▪ Below 190 active streamers in Q1
2021
400
300
▪ Moderate capacity increase for 2021
summer season
200
100
0
Q1 13 Q1 14 Q1 15 Q1 16 Q1 17 Q1 18 Q1 19 Q1 20 Q1 21
Source: PGS internal estimates
212021 Guidance
▪ Group gross cash cost of ~$400 million
▪ MultiClient cash investments of ~$150 million
– ~45% of 2021 active 3D vessel time allocated to MultiClient
▪ Capital expenditures of ~$40 million
-22-Summary
▪ Solid MultiClient performance
▪ Reactivating Ramform Vanguard to take
advantage of higher summer activity
▪ Established PGS New Energy
▪ 2021 expected to show improvement vs.
2020
– Positive order book development
– Increasing contract bids and leads
– Higher oil price
23Questions? COPYRIGHT The presentation, including all text, data, photographs, drawings and images (the "Content") belongs to PGS ASA, and/or its subsidiaries (“PGS”) and may be protected by Norwegian, U.S., and international copyright, trademark, intellectual property and other laws. Accordingly, neither the whole nor any part of this document shall be reproduced in any form nor used in any manner without express prior written permission by PGS and applicable acknowledgements. In the event of authorized reproduction, no trademark, copyright or other notice shall be altered or removed. © 2021 PGS ASA. All Rights Reserved. This presentation must be read in conjunction with the Q1 2021 Earnings Release and the disclosures therein.
Appendix
  Main Yard Stays* Next Six Months

                                     Vessel          When      Expected   Type of Yard Stay
                                                               Duration

                                     Ramform Atlas   Q2 2021   19 days    7.5 year classing

                                     Ramform         Q2 2021   9 days     5 year classing
                                     Tethys

*Subject to changes                                                                           -25-
You can also read


