Investor Presentation Year ended 30 June 2019 - September 2019 - Eureka Group Holdings
←
→
Page content transcription
If your browser does not render page correctly, please read the page content below
Investor Presentation
Year ended 30 June 2019
            September 2019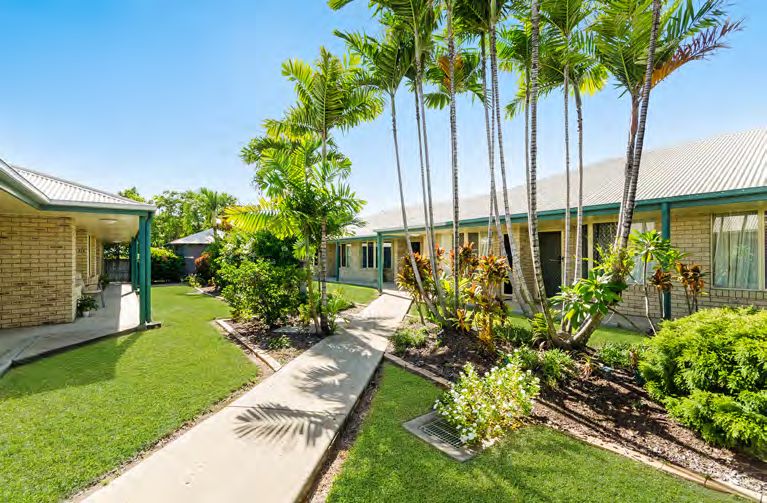
Disclaimer
No responsibility for contents of Presentation
To the maximum extent permitted by law Eureka Group Holdings Limited (ABN 15 097 241 159), its officers,
advisers and representatives:

• make no representation, warranty or undertaking, and accept no responsibility or liability express or implied,
  as to the adequacy, accuracy, completeness or reasonableness of this Presentation or any other written or
  verbal communication transmitted or made available to any recipient; and

• accept no responsibility for any errors in, or omissions from, this Presentation whether arising out of
   negligence or otherwise.

Accuracy of projections and forecasts
• This Presentation includes certain statements, opinions, estimates, projections and forward looking statements
   with respect to the expected future performance of Eureka Group Holdings Limited. These statements are
   based on, and are made subject to certain assumptions which may not prove to be correct or appropriate.
  Actual results may be materially affected by changes in economic and other circumstances which may be
  beyond the control of Eureka Group Holdings Limited. Except to the extent implied by law no representations
  or warranties are made by Eureka Group Holdings Limited, its officers, advisers or representatives as to the
  validity, certainty or completeness of any of the assumptions or the accuracy or completeness of the forward
  looking statements or that any such statement should or will be achieved. The forward looking statements
  should not be relied on as an indication of future value or for any other purpose.

No offer to sell or invitation to buy
• This Presentation does not, and should not be considered to constitute or form part of any offer to sell, or
   solicitation of an offer to buy any shares in Eureka Group Holdings Limited, and no part of this Presentation
   forms the basis of any contract or commitment whatsoever with any person. This Presentation does not
   constitute an offer or solicitation in any jurisdiction in which such offer or solicitation is not permitted
   under applicable law Distribution of this Presentation in or from certain jurisdictions may be restricted or
   prohibited by law Recipients must inform themselves of and comply with all restrictions or prohibitions in
  such jurisdictions. Neither Eureka Group Holdings Limited, its officers, advisers or representatives accept any
  liability to any person in relation to the distribution or possession of this Presentation from or in any jurisdiction.

• Any advice in this Presentation is general advice This advice has been prepared without taking into account
   the objectives, financial situation and needs of the recipients of this Presentation. For that reason, recipients
   should consider the appropriateness of the advice having regard to their own objectives, financial situation
   and needs and, if necessary seek appropriate independent legal, financial and other professional advice.

                                                                                                                            2
Contents
FY 2019 Highlights                     4
Eureka Business Model                  6
Eureka Strategy                        7
FY 2020 Initiatives and Outlook        8
Board and Executive                    9
Appendix – Key Financial Information   10

                                            3
FY2019 Highlights
• NPAT of $6.79M, up from a prior year loss of $0.28M

• EBITDA from core operations of $7.83M (prior to asset
   revaluations). An 11% improvement on FY18

• Operating cashflow $4.75M. Up 13% on FY18

• Dividend 1c unfranked – commencement of a dividend to
  shareholders demonstrates the progress the company has
  made this year and confidence in the future

• Strong occupancy levels of 91%

• Net Debt of $46.2M – 14% reduction on FY18

• NTA 33.1c up 11% on FY18 (29.8c)

• Net debt to total tangible assets of 36% (FY18 42%)

                                                           4
FY2019 Highlights (cont.)
• Management Team – the appointment of a new Chief
  Financial Officer (CFO) and Chief Operating Officer (COO) has
  strengthened the management team with renewed leadership
  focus on business and operational improvement

• Capital recycling and disposal on non-core assets of $5.9M
   through FY19

• Weighted average capitalisation rate of 10.22% (FY18 10.31%)

• Terranora – Regulatory approvals received (May 2019).
  An intensive marketing and sales campaign is underway

• Current portfolio consists of 39 villages (30 owned and
  9 managed) representing 2,119 units

                                                                  5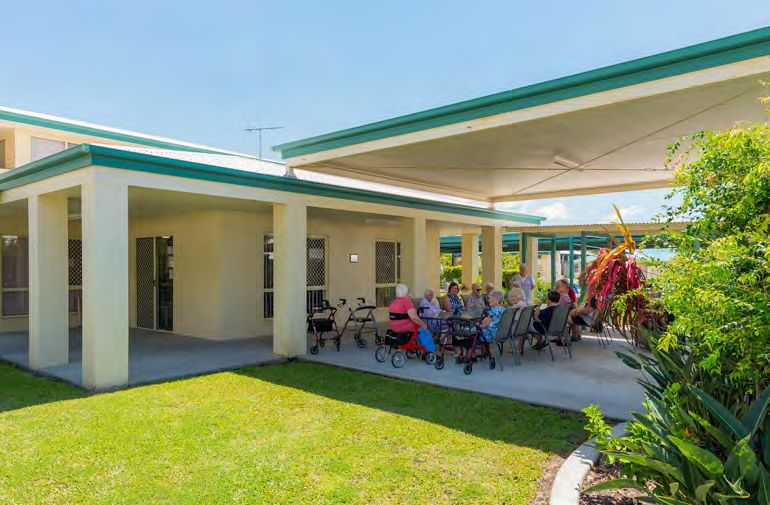
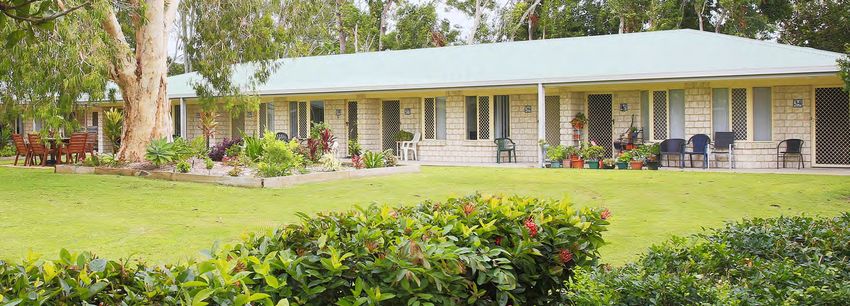
Eureka Business Model
✓ Owner/Operator of independent rental accommodation with a
   focus on independent retirees who are completely or primarily
   supported by the Australian Government pension
                                                                                           39
✓ Target market represents a significant portion of the growing                    19
   retirement population
                                                                              7
✓ Objective to grow and scale the business, through acquisition
   of traditional villages and development of existing assets.
                                                                                       6
   Portfolio and greenfield developments at a later stage
                                                                                   2
Investment Property
              State                     Investment ($M)
                                                                                   5
              QLD                             52.8
              NSW                             20.6
               VIC                             8.8                 30 Owned   9 Under Management
               SA                             23.2

                                                                   30 Owned   9 under management
             TOTAL                           105.4

                                                                                                       03

                                                                                                   6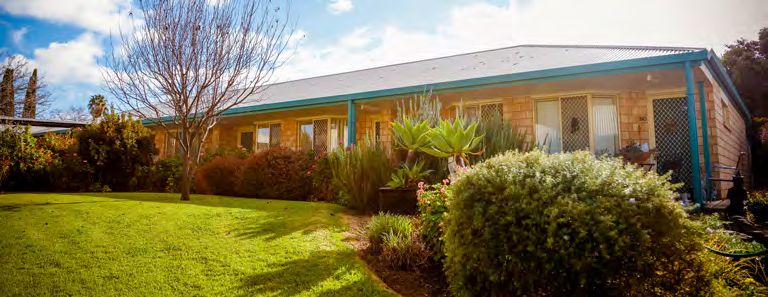
Eureka Strategy
FY21
Accelerate The
Business Growth + Scaling
Momentum
Acquisitions/Disposals – Recycle Capital Maintain Momentum
Full Benefits Of Cost Initiatives and Product improvement
Occupancy to flow from FY20
RESET THE OPERATING PLATFORM
Occupancy, Team Culture & Safety, Risk & Information Applications
Revenue & Cost Engagement Compliance Systems &
CRM and customer
Initiatives Technology analytics
Increase operating Ongoing
Improve referral intensity, commitment to Improve and
accountability and safety for all and M
arketing + Social
network to grow standardise
Media channels
FY20 occupancy & quick decision
making
standardisation of
policies to connect with
revenue
Regain Momentum customers and
C
ost reduction Village training and decision makers
Build The Basics initiatives development
Product Improvement
7
FY2020 Initiatives and Outlook
• Recommence acquiring and scaling the business (acquisition
   and development of existing assets)

• Continuous product improvement to maintain high occupancy
   and grow rental income

• Fully integrate finance and operations systems to capture
   efficiencies and facilitate cost effective scalability of
   the business

• Village Manager training and development as front
  line Ambassadors

• Cost saving initiatives – solar, waste and renegotiate
  supply contracts

• Continued recycling of non-core assets

• Key drivers –
                occupancy
               – efficiencies
               – margin

                                                                8
Board and Executive
✓ Experienced Board in Financial Management, Governance,
Health and Property
✓ Russell Banham appointed to the Board and chair of the Audit
& Risk Committee during FY19
✓ Ms Tracey Campion’s (CFO) appointment 21 January 2019
and Mr Cameron Taylor’s (COO) appointment 18 March 2019
strengthens the management team
9Appendix
Key Financial Information
The table below summarises the results for the year ended 30 June 2019

 ($’000)                                                                                           30-Jun-19                  30-Jun-18            • Improved revenue from core
                                                                                                                               15,674                 operations due to solid occupancy
 Rental income                                                                                        15,847
                                                                                                                                                      and additional service fees
 Catering income                                                                                      4,257                      4,274
 Service and caretaking income                                                                         3,132                     2,626             •R
                                                                                                                                                     evaluation net gain of $1.95M
 Revenue from asset sales - inventory                                                                 2,550                          -
 Revenue from ordinary activities                                                                    25,786                     22,574             • Improved EPS to 2.95 cents

 ($’000)                                                                                           30-Jun-19                  30-Jun-18            •N
                                                                                                                                                     o tax expense while Eureka has
 Profit/(loss) before and after tax                                                                   6,794                       (276)             unrecognised carried forward tax
 Depreciation and amortisation                                                                          225                        251              losses
 Finance costs                                                                                        2,766                      2,753
 EBITDA1                                                                                              9,785                      2,728
 Net (gain)/loss on revaluation of investment property and
 other property assets                                                                                (1,953)                     1,439
 Impairment of Couran Cove assets                                                                         -                      2,887
 EBITDA prior to asset revaluations
             1
                                                                                                      7,832                      7,054
 Basic & diluted earnings per share (cents)                                                            2.95                       (0.12)
1
  EBITDA (Earnings before interest, tax, depreciation and amortisation) is an unaudited non-IFRS measure however, the directors believe it is a
readily calculatedmeasure that has broad acceptance and is referred to by regular users of published financial statements as a proxy for overall
operating performance. EBITDA presented has been calculated from amounts disclosed in the financial statements.
                                                                                                                                                                                          11
Key Financial Information (cont.)
The table below summarises the balance sheet at 30 June 2019
($’000) 30-Jun-19 30-Jun-18 • Reduction in trade and other
Assets receivables and inventory due to
Cash and cash equivalents 3,060 1,986
partial realisation of Couran Cove
Trade and other receivables 1,503 2,930
Inventory 9,215 11,783 investment and Terranora sales
Joint Venture Investment 4,661 4,672
Assets held for sale 519 1,750 •P
roceeds received from realising
Investment property 105,406 100,756
Property, plant and equipment 659 682
non-core and under-performing
Intangible assets 5,348 6,035 assets used to repay debt
Other assets 2,701 2,706
Total Assets 133,072 133,300 • Terranora sales program under way
Liabilities
Trade and other payables 1,672 2,709 • Investment property valuation uplift
Other financial liabilities 49,490 55,483
Provisions 428 408 •C
ore debt facility matures
Total Liabilities 51,590 58,600
December 2021
Net Assets 81,482 74,700
12Key Financial Information (cont.)
The table below summarises the cash flows for the year ended 30 June 2019
($’000) 30-Jun-19 30-Jun-18 • Net cash from core operating
Cash Flows from Operating Activities activities remained strong
Receipts from customers 23,925 24,439
Payments to suppliers and employees (17,150) (17,456)
Net interest paid (2,030) (2,769) •D
ebt reduction achieved during
Net Cash provided by Operating Activities 4,745 4,214 the period from proceeds from
partial realisation of Couran Cove
Cash Flows from Investing Activities
Payments for additions to investment property (1,589) (8,704)
investment and sale of
Payments for additions to inventory (1,270) (1,688) non-core assets
Payments for property, plant & equipment (61) (30)
Payments for Joint Venture investment - (4,500)
Proceeds from sales of assets 4,260 4,007
Proceeds from repayments of loans provided 1,660 335
Other payments for investing activities - (832)
Net Cash provided by/(used in) Investing Activities 3,000 (11,412)
Cash Flows from Financing Activities
Net proceeds from / (repayment of) borrowings (6,605) 4,866
Other payments for financing activities (66) (77)
Net Cash provided by/(used in) Financing Activities (6,671) 4,789
Net Increase/(decrease) in cash and cash equivalents 1,074 (2,409)
Cash and cash equivalents at the beginning of period 1,986 4,395
Cash and cash equivalents at end of the period 3,060 1,986
13Head Office ABN 15 097 241 159 Level 2, 7 Short Street, Southport Qld 4215 P: (07) 5568 0205 F: (07) 5302 6605 E: info@eurekagroupholdings.com.au
You can also read