EARNINGS CALL PRESENTATION - Q3 2019 - OCTOBER 31, 2019 - BORGWARNER
←
→
Page content transcription
If your browser does not render page correctly, please read the page content below

Earnings Call Presentation
   Q3 2019

October 31, 2019
Safe Harbor Statement
Statements in this presentation may constitute forward-looking statements as contemplated by the 1995 Private Securities Litigation Reform Act that are based
on management’s current outlook, expectations, estimates and projections. Words such as “anticipates,” “believes,” “continues,” “could,” “designed,” “effect,”
“estimates,” “evaluates,” “expects,” “forecasts,” “goal,” “guidance,” “initiative,” “intends,” “may,” “outlook,” “plans,” “potential,” “predicts,” “project,” “pursue,” “seek,”
“should,” “target,” “when,” “will,” “would,” and variations of such words and similar expressions are intended to identify such forward-looking statements. Forward-
looking statements are not guarantees of performance, and the Company’s actual results may differ materially from those expressed, projected or implied in or
by the forward-looking statements. These risks and uncertainties, among others, include: our dependence on automotive and truck production, both of which are
highly cyclical; our reliance on major OEM customers; commodities availability and pricing; supply disruptions; fluctuations in interest rates and foreign currency
exchange rates; availability of credit; our dependence on key management; our dependence on information systems; the uncertainty of the global economic
environment; the outcome of existing or any future legal proceedings, including litigation with respect to various claims; future changes in laws and regulations,
including, by way of example, tariffs, in the countries in which we operate; and other risks noted in reports that we file with the Securities and Exchange
Commission, including the Risk Factors in our most recently filed Annual Report on Form 10-K. We do not undertake any obligation to update or announce
publicly any updates to or revision to any of the forward-looking statements in this presentation to reflect any change in our expectations or any change in events,
conditions, circumstances, or assumptions underlying the statements.

Non-GAAP Financial Measures
This presentation contains information about BorgWarner’s financial results which is not presented in accordance with accounting principles generally accepted
in the United States (“GAAP”). Such non-GAAP financial measures are reconciled to their closest GAAP financial measures in the Appendix. The provision of
these comparable GAAP financial measures for 2019 is not intended to indicate that BorgWarner is explicitly or implicitly providing projections on those GAAP
financial measures, and actual results for such measures are likely to vary from those presented. The reconciliations include all information reasonably available
to the company at the date of this presentation and the adjustments that management can reasonably predict.

Management believes that these non-GAAP financial measures are useful to management, investors, and banking institutions in their analysis of the Company's
business and operating performance. Management also uses this information for operational planning and decision-making purposes.

Non-GAAP financial measures are not and should not be considered a substitute for any GAAP measure. Additionally, because not all companies use identical
calculations, the non-GAAP financial measures as presented by BorgWarner may not be comparable to similarly titled measures reported by other companies.

© BorgWarner Inc.                                                                2

Agenda

▪ Fred Lissalde – Chief Executive Officer

▪ Kevin Nowlan – Chief Financial Officer

▪ Q&A

© BorgWarner Inc.                          3
Third Quarter Highlights
                                                                               ▪ Q3 organic revenue performance and
               Net Sales                                   Adj. EPS*
                                                                                 outgrowth ahead of expectations
       Organic Sales Growth                            Above High End of
             of 4.5%                                    Guidance Range
                                                                               ▪ Cost controls benefitting incremental
                                                                                 margins
         $2,478            $2,492
                                                       $0.90
                                                                   $0.96       ▪ Strong cash generation with $478M
                                                        to
                                                       $0.83
                                                                                 YTD free cash flow
                490 BPS
                Outgrowth
                                                                               ▪ Multiple new product awards,
                                                                                 including for electric vehicles
      Q3 2018            Q3 2019                      Q3 Guide Q3 Actual

** Adj. EPS on this slide is a non-US GAAP measure.
   See reconciliation to US GAAP in Appendix.

© BorgWarner Inc.                                                          4
Cash Flow Generation Focus
           ($ millions)

700

                          Free Cash Flow*                                                   2014-2018 Accumulated Capital
                                                                                                  Deployment Mix**
600

                             $620

500
           $535
                                              $580
                                                                                                                                       ▪ Free cash flow generation
                                                                $478                                        Dividends                    supported by strong margin and
                                                                                                               19%
400

                                                                                                                                         earnings profile
                                                                                                                                       ▪ Increased management
300
                                                                                                                        M&A Activity
                                                                                                                           48%
                                                                                                        Share
200
                                                                                                     Repurchases                         prioritization over last 18 months
                                                                                                         33%

100
                                                                                                                                       ▪ Continuing with balanced capital
                                                                                                                                         deployment strategy
 -

           2016              2017             2018          YTD 9 Mos.
                                                              2019

      * Free Cash Flow on this slide is a non-US GAAP measure. See reconciliation to US GAAP in Appendix.
      ** Excludes increases in net debt, which were a source of cash from 2014-2018.

                        Free Cash Flow Generation supports Balanced Capital Deployment Strategy

           © BorgWarner Inc.                                                                                       5
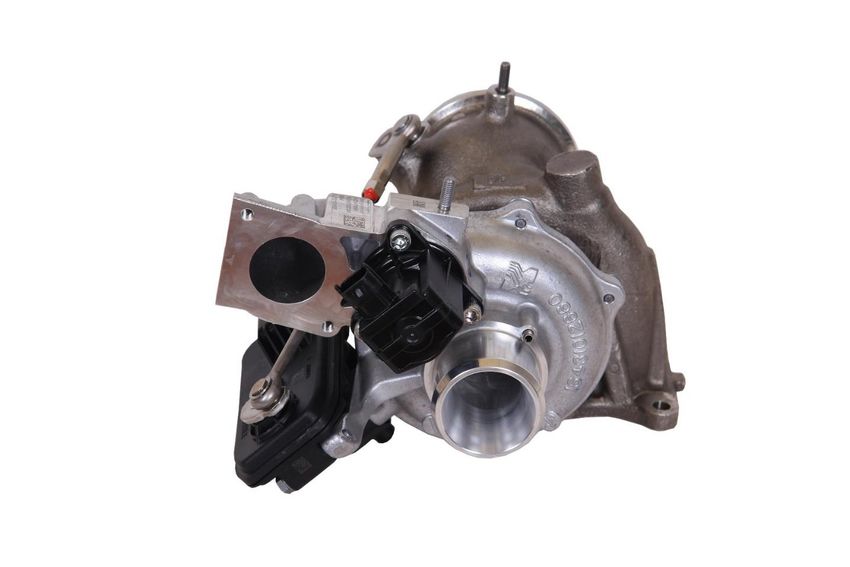
Sustaining Product Leadership in Combustion Propulsion
Wastegate Turbocharger EGR Cooler and Tube
for small gasoline engines for a gasoline engine launching in
launched in 2019 with global OEM. 2021 with Indian OEM.
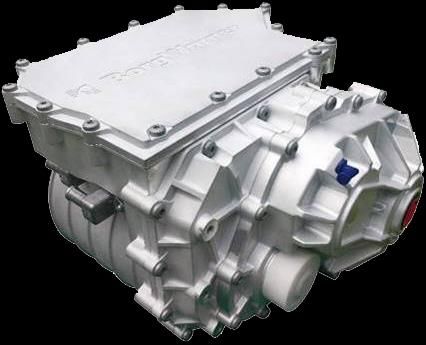
© BorgWarner Inc. 6Secured Wins on Two New Electric Products
Torque-Vectoring Dual-Clutch Integrated Drive Module (iDM)
for EV with major global OEM launching in for EV brand in China launching in 2021.
2022. Two-clutch design replaces conventional Complete module fully integrates our power
differential in electric driveline while improving electronics into our electric motor and
handling and maneuverability. transmission.
© BorgWarner Inc. 7Industry Perspective
BorgWarner Global Market North America Europe China
Q3 Actual FY Est.
-0.4% Q3 Actual FY Est. Q3 Actual FY Est.
Q3 Actual FY Est.
0.5%
-0.4%
-2.5% to
-3.5% -3.5% to
-4.0% -5.5%
-4.0% to -4.5%
-9.0% to
-11.0%
Note: Q3 light-vehicle production market based on October IHS data, FY Est. based on BorgWarner’s market forecast
© BorgWarner Inc. 8BorgWarner Q3 2019 Net Sales Walk
$ in millions
Q3 2018 net sales $2,478
Thermostat Divestiture $(29)
Q3 2018 proforma excl.
$2,449
Thermostat business
FX ($66)
Backlog $153
Market growth and pricing $(44)
Q3 2019 net sales $2,492
© BorgWarner Inc. 9BorgWarner Financial Results & Adj. Operating Income
$ in millions
Three months ended
Q3 2018 adj. operating income $293 (in millions, except per share amounts)
September 30
GAAP & Non GAAP Financials
2018 2019
Thermostat Divestiture $(1) Sales $2,478 $2,492
Adj. operating margin* $293 $294
Q3 2018 proforma excl. Adj. Operating Margin % 11.8% 11.8%
$292
Thermostat business
Adj. diluted EPS from
$1.00 $0.96
continuing operations**
FX $(7)
Free Cash Flow*** $126 $255
Market growth, pricing,
backlog and other $9
* Adj. Operating Margin and Adj. Operating Margin % on this slide is a non-US GAAP measure.
See reconciliation to US GAAP in Appendix
** Adj. EPS on this slide is a non-US GAAP measure. See reconciliation to US GAAP in Appendix.
Q3 2019 adj. operating income $294 *** Free Cash Flow on this slide is a non-US GAAP measure. See reconciliation to US GAAP in
Appendix.
© BorgWarner Inc. 10Segment Net Sales & Adj. EBIT Margin*
$ in millions
Net Sales
Q3 2018 proforma excl.
▪ Growth in Europe partially offset by
15.9%
ENGINE Thermostat business Adj. Margin $1,487
FX $(42)
lower China volumes
Market growth, price
and net new business
$69
▪ Benefit of higher sales and cost
Q3 2019 net sales
15.9%
$1,514
savings
Adj. Margin
11.1%
Q3 2018 net sales $976
DRIVETRAIN Adj. Margin
▪ Growth driven by higher China and
FX ($24) Europe revenue
Market growth, price
and net new business $41
▪ Margins impacted by higher R&D
Q3 2019 net sales
10.1%
Adj. Margin $993
and startup costs for launches
* Adj. EBIT Margin and Adj. Operating Margin % on this slide is a non-US GAAP measure.
See reconciliation to US GAAP in Appendix
© BorgWarner Inc. 112019 Sales Walk and Guidance
$ in millions
Net Sales Full-year 2019 Guidance
12.3%
2018 net sales $10,530
Adj. Margin Organic revenue change of -1.0% to Flat
Thermostat Divestiture $(90) 350 to 400 basis points of outgrowth
2018 proforma excl.
$10,440 Adj. EPS $3.85 - $4.00*
Thermostat business
FX $(375)
Free cash flow $550 - $600 million**
Backlog $515 $580
Market growth and
$(630) $(545)
pricing
11.7% – 12.0%
2019 net sales Adj. Margin $9,950 $10,100
* Adj. EPS on this slide is a non-US GAAP measure. See reconciliation to US GAAP in Appendix.
** Free Cash Flow on this slide is a non-US GAAP measure. See reconciliation to US GAAP in Appendix.
© BorgWarner Inc. 12Sale of Asbestos Liability Subsidiary
▪ On 10/30, executed transaction to sell
100% of asbestos liability subsidiary to Annual Cash Costs of Asbestos Liabilities ($M)
Enstar Holdings (US) LLC
62 62
▪ Capitalized entity being sold with $172M of
cash at closing 51
▪ Expected to remove $772M of asbestos 47 23 21
45 46
liabilities and related assets from balance 21
sheet 24 20
22
▪ Eliminates annual cash costs associated
with defending and settling specific 39 41
30
asbestos-related cases 23 23
26
▪ Strategic deployment of capital to insulate
2013 2014 2015 2016 2017 2018
company from ongoing exposure to
Indemnity Defense
asbestos liabilities
© BorgWarner Inc. 13Thank you! © BorgWarner Inc. 14
Appendix

© BorgWarner Inc.     15
Third Quarter Reconciliation to US GAAP
 Adjusted Operating Income
 The Company defines adjusted operating income as operating income adjusted to eliminate the impact of restructuring expense, merger, acquisition and divestiture expense,
 other net expenses, discontinued operations, and other gains and losses not reflective of the Company’s ongoing operations.

                                                                                   Three Months Ended              Nine Months Ended
                                    Q3 2018 to Q3 2019
                                                                                      September 30,                  September 30,

                                    $ in millions                                      2019          2018           2019          2018
                                    Sales                                         $      2,492   $     2,478   $      7,609   $     7,956

                                    Gross profit                                  $       524 $         515    $     1,556 $       1,686
                                    Gross profit %                                       21.0%         20.8%         20.4%         21.2%

                                    Operating income                              $       276 $         278    $       825 $         924
                                    Operating margin %                                   11.1%         11.2%          10.8%         11.6%

                                    Non-comparable items:
                                    Restructuring and other expense                        14              7            41            44
                                    Merger, acquisition and divestiture expense             4              2            10             5
                                    Officer stock awards modification                      -               6             2             2
                                    Loss on arbitration                                    -              -             14            -
                                    Gain on commerical settlement                          -              -             -             (3)
                                    Pension settlement loss                                -              -             -             -
                                    Tax adjustments                                        -              -             -             -

                                    Adjusted operating income                     $       294 $         293    $       892 $         972
                                    Adjusted operating income margin %                   11.8%         11.8%          11.7%         12.2%

© BorgWarner Inc.                                                                 16
Third Quarter Segment Reconciliation to US GAAP
Adjusted EBIT
The Company defines adjusted EBIT as EBIT adjusted to eliminate the impact of merger, acquisition and divestiture expense.
Three Months Ended
Q3 2018 to Q3 2019
September 30,
$ in millions 2019 2018
Engine
Net sales $ 1,514 $ 1,516
Thermostat divestiture - (29)
Proforma net sales excl. Thermostat business $ 1,514 $ 1,487
Adjusted EBIT $ 241 $ 238
Thermostat divestiture - (1)
Proforma adjusted EBIT excl. Thermostat business $ 241 $ 237
Adjusted EBIT margin % 15.9% 15.9%
Drivetrain
Net sales $ 993 $ 976
Adjusted EBIT $ 100 $ 108
Adjusted EBIT margin % 10.1% 11.1%
© BorgWarner Inc. 17Third Quarter Reconciliation to US GAAP
Adjusted Earnings Per Share
The Company defines adjusted earnings per diluted share as earnings per diluted share adjusted for the items above and related tax effects.
Three Months Ended Nine Months Ended
September 30, September 30,
2019 2018 2019 2018
Earnings per diluted share $ 0.94 $ 0.98 $ 2.54 $ 3.34
Non-comparable items:
Restructuring and other expense 0.04 0.03 0.15 0.17
Merger, acquisition and divestiture expense 0.02 - 0.04 0.02
Officer stock awards modification - 0.03 0.01 0.01
Loss on arbitration - - 0.07 -
Gain on commerical settlement - - - (0.01)
Pension settlement loss - - 0.10 -
Tax Adjustments (0.04) (0.04) 0.04 (0.25)
Adjusted earnings per diluted share $ 0.96 $ 1.00 $ 2.95 $ 3.28
© BorgWarner Inc. 18Adj. EBIT to US GAAP Reconciliation
Adjusted EBIT is comprised of earnings before interest, income taxes and noncontrolling interest (“EBIT") adjusted for restructuring, goodwill impairment charges,
affiliates' earnings and other items not reflective of on-going operating income or loss ("Adjusted EBIT"). Adjusted EBIT is the measure of segment income or loss
used by the Company. The Company believes Adjusted EBIT is most reflective of the operational profitability or loss of our reporting segments. The following table
shows Adjusted EBIT for the Company's reporting segments.
Three Months Ended
September 30,
2019 2018
Engine $ 241 $ 238
Drivetrain 100 108
Adj. EBIT 341 346
Restructuring expense 14 5
Merger, acquisition and divestiture expense 4 2
Other expense (income) - 2
Officer stock award modification - 6
Corporate, including stock-based compensation 47 53
Equity in affiliates' earnings, net of tax (7) (15)
Interest income (4) (1)
Interest expense 15 14
Other postretirement expense (income) (1) (3)
Earnings before income taxes and noncontrolling interest 273 283
Provision for income taxes 66 67
Net earnings 207 216
Net earnings attributable to the noncontrolling interest, net of tax 13 12
Net earnings attributable to BorgWarner Inc. $ 194 $ 204
© BorgWarner Inc. 192019 Planning Assumptions
▪ CapEx $550 - $600 million
▪ Share repurchases ~$100 million
▪ R&D spending Low 4% of sales
▪ Tax rate for ongoing operations ~27%
© BorgWarner Inc. 20FY’19 Adj. Operating Income to US GAAP Reconciliation
FY 2019 Guidance
FY 2018 Low High
Net Sales $ 10,530 $ 9,950 $ 10,100
Operating income $ 1,190 $ 1,089 $ 1,144
Operating margin 11.3% 10.9% 11.3%
Non-comparable items
Restructuring & other expense $ 66 $ 50 $ 40
Merger, acquisition & divestiture expense 6 10 10
Officer stock awards modification 8 2 2
Loss on arbitration - 14 14
Gain on sale of building (19) - -
Asset impairment and loss on divestiture 25 - -
Asbestos related adjustments 23 - -
Other (3) - -
Adjusted operating income $ 1,296 $ 1,165 $ 1,210
Adjusted operating income margin 12.3% 11.7% 12.0%
© BorgWarner Inc. 21FY’19 Adj. Operating Margin Guidance
$ in millions
Adj. Operating Income*
12.3%
2018 adj. operating income
12.3% Adj.
Adj.Margin
Margin $1,296
Thermostat Divestiture $(5)
2018 proforma excl. Thermostat business $1,291
FX ($43)
Market growth, pricing and backlog
11.9 % - 12.2% Adj. ($83) ($3)
Margin
11.7% – 12.0%
2019 adj. operating income Adj. Margin $1,165 $1,210
* Adj. Operating Income and Adj. Operating Margin as shown on this slide are non-US GAAP measures. See reconciliation to US GAAP in Appendix.
© BorgWarner Inc. 22Adj. EPS Guidance to US GAAP Reconciliation
The Company defines Adjusted earnings per share as Adjusted net income divided by diluted shares. Because not all companies use identical calculations, this
presentation of Adjusted operating income and Adjusted earnings per share may not be comparable to other similarly titled measures of other companies.
Full-Year 2019
Low High
Earnings per diluted share $ 3.40 $ 3.59
Non-comparable items:
Restructuring and other expense 0.18 0.14
Merger, acquisition and divestiture expense 0.05 0.05
Officer stock awards modification 0.01 0.01
Loss on arbitration 0.07 0.07
Pension settlement loss 0.10 0.10
Tax adjustments 0.04 0.04
Adjusted earnings per diluted share $ 3.85 $ 4.00
© BorgWarner Inc. 23Free Cash Flow to US GAAP
The Company defines Free cash flow as net cash provided by operating activities minus capital expenditures. The measure is useful to both management and
investors in evaluating the Company’s ability to service and repay its debt.
Full Year
2016 2017 2018
Cash provided by operating activities $ 1,036 $ 1,180 $ 1,127
Capital expenditures (501) (560) (547)
Free cash flow $ 535 $ 620 $ 580
Three Months Ended Nine Months Ended
September 30, September 30, Full Year 2019 Outlook
2019 2018 2019 2018 Low High
Cash provided by operating activities $ 357 $ 251 $ 824 $ 556 $ 1,150 $ 1,150
Capital expenditures (102) (125) (346) (394) (600) (550)
Free cash flow $ 255 $ 126 $ 478 $ 162 $ 550 $ 600
© BorgWarner Inc. 24Key Definitions
Key Definitions:
The terms below are commonly used by management and investors
in assessing ongoing financial performance.
▪ Organic Revenue Change – Revenue change year over year
excluding the estimated impact of FX and net M&A
▪ Market – The change in light vehicle production weighted for
BorgWarner’s geographic exposure as estimated by BorgWarner
▪ Outgrowth – Defined as BorgWarner’s “Organic Revenue
Change” vs. “Market”
© BorgWarner Inc. 25You can also read