CAPITALAND MALAYSIA MALL TRUST - 1Q 2021 Results Presentation 16 April 2021 - Investor Relations
←
→
Page content transcription
If your browser does not render page correctly, please read the page content below

CAPITALAND MALAYSIA MALL TRUST
1Q 2021 Results Presentation
16 April 2021

Disclaimer
These materials may contain forward-looking statements that involve assumptions, risks and uncertainties. Actual future performance,
outcomes and results may differ materially from those expressed in forward-looking statements as a result of a number of risks, uncertainties
and assumptions. Representative examples of these factors include (without limitation) general industry and economic conditions, interest
rate trends, cost of capital and capital availability, competition from other developments, shifts in expected levels of property rental
income, changes in operating expenses, including reimbursable staff costs, benefits and training, property expenses and governmental and
public policy changes. You are cautioned not to place undue reliance on these forward-looking statements, which are based on the
current view of management on future events.
The information contained in these materials has not been independently verified. No representation or warranty expressed or implied is
made as to, and no reliance should be placed on, the fairness, accuracy, completeness or correctness of the information or opinions
contained in these materials. Neither CapitaLand Malaysia Mall REIT Management Sdn. Bhd. (the Manager) or any of its affiliates, advisers
or representatives shall have any liability whatsoever (in negligence or otherwise) for any loss howsoever arising, whether directly, from any
use, reliance or distribution of these materials or its contents or otherwise arising in connection with these materials.
The past performance of CMMT is not indicative of the future performance of CMMT. Similarly, the past performance of the Manager is not
indicative of the future performance of the Manager.
The value of units in CMMT (Units) and the income derived from them may fall as well as rise. Units are not obligations of, deposits in, or
guaranteed by, the Manager or any of its affiliates. An investment in Units is subject to investment risks, including the possible loss of the
principal amount invested. It is intended that holders of Units may only deal in their Units through trading on Bursa Malaysia. Listing of the
Units on Bursa Malaysia does not guarantee a liquid market for the Units.
These materials are for information only and does not constitute an invitation or offer to acquire, purchase or subscribe for Units.

                                                                                                                                                 2
Contents
• 1Q 2021 Overview
• Financial Results
• Portfolio Updates
• Sustainability Management

                              3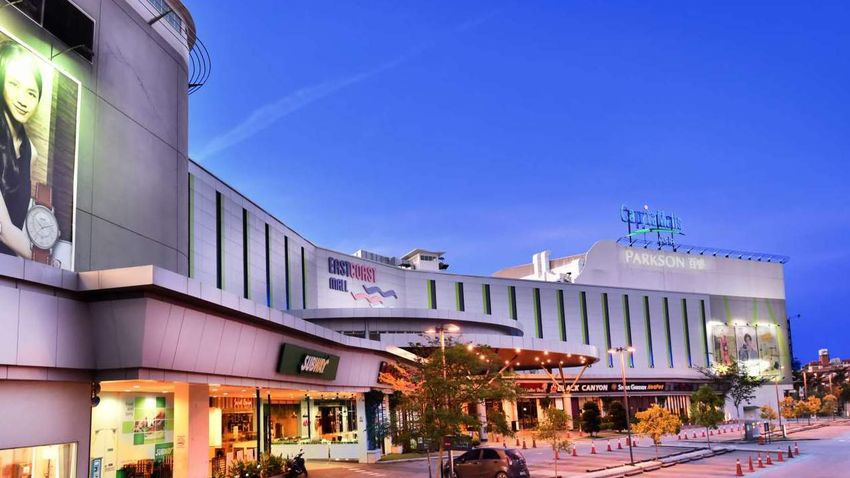
1Q 2021
Overview

           Gurney Plaza, Penang, Malaysia
1Q 2021 Overview
              •   Net Property Income: RM24.9 mil ( 36.7% YoY)
              •   Distribution Per Unit: 0.36 sen ( 63.3% YoY)
              •   Shopper Traffic: 7.4 mil ( 33.4% YoY)
  Results
              •   As at 31 March 2021:
                   • Portfolio Occupancy: 85.1%
                   • Rental Reversion: -11.7%

              Proactive asset management
              • Introduction of new-to-market brands to strengthen leading mall
                 positioning at Gurney Plaza and East Coast Mall
 Highlights
              Proactive capital management
              • Re-fixed the interest rate of a term loan at a lower interest rate for
                 three years

                                                                                         5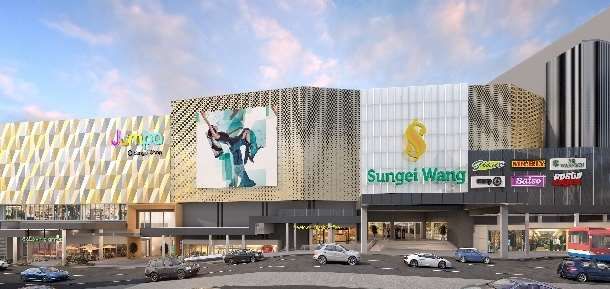
Financial Results

                    East Coast Mall, Kuantan, Malaysia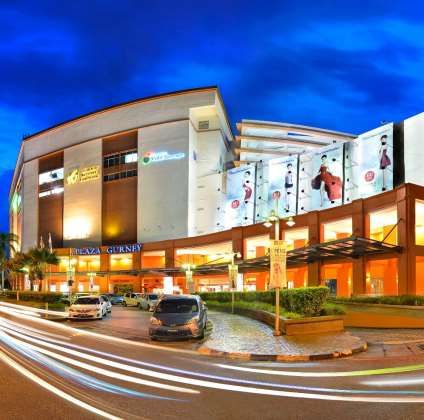
Distribution Statement
                                                                 1Q 2021       1Q 2020
                                                                  Actual       Actual                      Change
RM'000                                                         (Unaudited) (Unaudited)                        %
Gross rev enue                                                       56,656       74,532                        (24.0)
Less: Property operating expenses                                   (31,741)     (35,172)                         (9.8)
Net property income                                                  24,915       39,360                        (36.7)
I nterest income                                                         286          627                       (54.4)
Net investment income                                                25,201       39,987                        (37.0)
Manager’s management fee                                              (4,042)      (4,847)                      (16.6)
Trust and other expenses                                                (575)        (576)                        (0.2)
Finance costs                                                       (12,899)     (15,294)                       (15.7)
Profit before taxation                                                 7,685      19,270                        (60.1)
Taxation                                                                  -           -                            -
Profit for the period                                                  7,685      19,270                        (60.1)
Distribution adjustments                                                  (14)        874                    (>100.0)
I ncome av ailable for distribution                                    7,671      20,144                        (61.9)
Distributable income 1                                                 7,582      20,143                        (62.4)
Distribution Per Unit ("DPU") (sen)                                     0.36         0.98                       (63.3)
1. The difference between distributable income and income available for distribution is due to rounding effect of DPU.
2. MCO-2 took place between 13 Jan 2021 to 4 Mar 2021 whereas MCO-1 took place between 18 Mar 2020 and crossed
   the second quarter to 3 May 2020.
                                                                                                                          7
1Q 2021 Gross Revenue

                                                                             Mainly due to:
                                                                             ▪ targeted rental rebates were given
                                                                               to tenants affected by the second
                                                                               Movement Control Order (MCO-2);
                                                                             ▪ Lower rental income attributable to
                                                                               lower occupancy; and
                                                                             ▪ Lower gross turnover revenue, car
                                                                               park and marcom income.

                           1

1. 3 Damansara Property comprises 3 Damansara and 3 Damansara Office Tower

                                                                                                                     8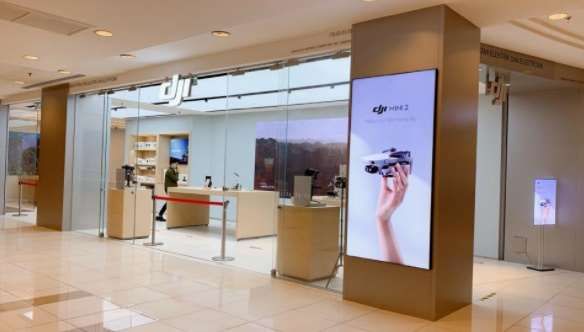
1Q 2021 Property Operating Expenses

                                 Mainly due to:
                                 ▪ lower utilities expenses as a result
                                   of lower consumption and 10%
                                   discount          on     electricity
                                   consumption from 1 January 2021
                                   until 31 March 2021; and
                                 ▪ lower     marketing    and    other
                                   operating expenses due to cost
                                   containment measures being put
                                   in place.

                                                                          9
1Q 2021 Net Property Income

                              10
Impact of MCO-1 and MCO-2 on
Distributable Income & DPU
Note: MCO-2 took place between 13 Jan 2021 to 4 Mar 2021 whereas MCO-1 took place between 18 Mar 2020 and crossed the
second quarter to 3 May 2020.
11Debt Profile
Well-spread Debt Maturity Profile Diversified Sources of Funding
15%
21%
64%
Term Loan facilities
Unrated Medium Term Notes
Revolving Credit facilities
12Key Financial Indicators
1Q 2021 FY 2020
Unencumbered assets as % of total assets 28.7% 28.1%
Gearing ratio (after income distribution) 35.7% 35.3%
Average cost of debt 3.63% 4.09%
Fixed:Floating rate debt ratio 81%:19% 81%:19%
Debt / EBITDA (times) 1 14.2 11.8
Interest coverage (times) 1 1.9 2.1
Average term to maturity (years) 3.5 3.5
1. With effect from 1Q 2021, EBITDA is determined on a 12-month trailing basis to smoothen out seasonality factors. Previously, annualised
EBITDA for the reporting period was applied in computing these ratios.
13Balance Sheet
As at 31 March 2021 RM'mil
Non-current Assets 3,899
Current Assets 101 NAV (RM'mil)
Total Assets 4,000 - before income distribution 2,433
Current Liabilities 250 - after income distribution 2,426
Non-current Liabilities 1,317
Total Liabilities 1,567 NAV per unit (RM)
Net Assets 2,433 - before income distribution 1.1553
Total Unitholders' Funds 2,433 - after income distribution 1.1517
Number of Units in Circulation (in million units) 2,106
14Portfolio Updates
MinNature, JUMPA@ Sungei Wang
Sungei Wang Plaza, Kuala LumpurOccupancy Rate
1Q 2021 4Q 2020
31 March 211 31 December 201
Gurney Plaza 96.3% 98.6%
East Coast Mall 96.9% 97.4%
Sungei Wang Plaza 62.3% 64.2%
3 Damansara2 82.2% 81.2%
The Mines 82.5% 85.2%
CMMT (Retail) 86.1% 87.6%
3 Damansara Office Tower2 57.4% 57.4%
CMMT Portfolio (Retail & Office) 85.1% 86.6%
1. Based on committed leases.
2. The occupancy of 3 Damansara Property is 77.8% as at 31 March 2021.
16Rental Reversion
From 1 January 2021 No. of new Var. over preceding rental2, 3, 4
to 31 March 20211 leases/renewals (%)
Gurney Plaza 23 -2.0
East Coast Mall 15 -2.5
Sungei Wang Plaza 8 -47.8
3 Damansara 11 -32.0
The Mines 15 -20.4
CMMT Portfolio (Retail) 72 -13.1
3 Damansara Office Tower 1 +3.9
CMMT Portfolio (Retail + Office) 73 -11.7
1. Excluding newly created and reconfigured units.
2. Excluding gross turnover rent component.
3. Majority of leases have rental escalation clause.
4. The % is computed based on the increase of the average rental of the renewed term over average rental of the preceding term.
17Portfolio Lease Expiry (By Year)
CMMT (Retail)
As at
31 March 2021 Gross Rental Income % of Total
No of Leases1
RM’000 Gross Rental Income2
2021 538 6,528 35.2%
2022 352 6,673 35.9%
2023 211 4,745 25.5%
Beyond 2023 37 624 3.4%
CMMT (Office)
As at
31 March 2021 Gross Rental Income % of Total
No of Leases1
RM’000 Gross Rental Income3
2021 5 169 54.1%
Beyond 2021 2 143 45.9%
1. Based on all committed leases as at 31 March 2021.
2. Based on committed gross rental income for CMMT (Retail) as at 31 March 2021.
3. Based on committed gross rental income for CMMT (Office) as at 31 March 2021.
18Portfolio Lease Expiry Profile for 2021
As at % of Net Lettable % of Gross Rental
No. of Leases1
31 March 2021 Area1 Income1
Gurney Plaza 159 9.6% 14.6%
East Coast Mall 85 5.1% 7.4%
Sungei Wang Plaza 91 4.0% 2.3%
3 Damansara 74 9.4% 4.1%
The Mines 129 11.7% 6.1%
CMMT (Retail) 538 39.8% 34.5%
3 Damansara Office Tower 5 1.3% 0.9%
CMMT Portfolio (Retail & Office) 543 41.1% 35.4%
1. Based on committed leases for CMMT Portfolio(Retail + Office) as at 31 March 2021.
19Shopper & Vehicular Traffic
Shopper Traffic Vehicular Traffic
33.4% lower than 1Q 2020 19.1% lower than 1Q 2020
Traffic (‘000) Traffic (‘000)
1,800
12,000 1,558
11,075 1,600
10,000 1,400
1,260
1,200
8,000 7,372
1,000
6,000 800
600
4,000
400
2,000
200
0 0
1Q'20 1Q'21 1Q'20 1Q'21
20Retail Performance
Shopper traffic declined 8.1% while tenant sales psf decreased 18.4% from previous quarter
1Q'20 2Q'20 3Q'20 4Q'20 1Q'21
Shopper Traffic Tenant Sales
1. Shopper traffic and tenant sales were impacted by MCO-1 (18 March to 3 May 2020) and MCO-2 (13 January to 4 March 2021)
2. Tenant sales in 1Q 2021 is for two months only
3. Change in tenant sales psf for 1Q 2021 is for two months only
4. Shopper traffic and tenant sales psf in 1Q 2021 declined 33% and 30% against 1Q 2020 21New brands to reinforce leading positioning at Gurney Plaza and East Coast Mall GURNEY PLAZA: China’s DJI first flagship outlet in Northern region selling easy-to-fly drones and aerial photography systems and the first Kaifan Canteen restaurant within a mall EAST COAST MALL: New-to-region beauty-related international brands include Victoria’s Secret and Bath & Body Works 22
New Retail Offerings

GURNEY FOOD HALL: Hazukido and the first Lucas Mart in Northern region           GURNEY PLAZA: : Bobby Brown cosmetics and Fu Tea

EAST COAST MALL : Widened the variety of F&B, fashion and IT-related offerings

                                                                                                                                    23
New Retail Offerings
THE MINES: Mr. Dollar value store is a new brand in CMMT malls; Vivo further complements the 3 Damansara: New service-related offering on
service offerings at Digitamart on Level 4 Lower Ground
24Reopening of GSC at 3 Damansara
Revamped GSC outlet features largest Play+ lounge and hall
Upgraded main foyer Spacious waiting lobby New Play + lounge: reading corner and play area
To celebrate the reopening of GSC, a Superheroes walkabout was organised on the opening weekend while various CapitaStar member
privileges are being offered until end of April 25Digital Rewards and Convenience
Leverage CapitaStar’s digital campaigns to reward shoppers;
Digital initiatives implemented for shoppers’ safety and convenience
Shoppers can order from F&B tenants at Gurney
CAPITASTAR: Digital initiatives to deepen shopper All CMMT malls have implemented the Plaza through a dedicated QR code and collection
engagement PARK and PAY with eWallets feature point should they opt for self pick-up
26Shopper Engagement
Deepen digital marketing initiatives to stay connected with shoppers and boost tenant sales
Sungei Wang Plaza Management Corporation organised cross-
marketing promotion for JUMPA tenants and various other
promotions in conjunction with school holidays in March 27Sustainability
Management
CapitaFrogEarth Hour 2021
Capitaland Malaysia malls took part in the global climate change initiative
to turn off non-essential lights for one hour on 27 March 2021
THE MINES: Green rewards
Various community messages that were posted on social media to campaign in support of Earth Hour
educate and create awareness on sustainability issues month 29Thank you
For enquiries, please contact: Ms Jasmine Loo (Investor Relations)
Email: jasmine.loo@capitaland.com
CapitaLand Malaysia Mall REIT Management Sdn. Bhd. (http://www.cmmt.com.my)
Unit No. 1-27, Level 27, Naza Tower, No. 10 Persiaran KLCC, 50088 Kuala Lumpur
Tel: +603 2279 9888; Fax: +603 2279 9889You can also read