Strong comparable net sales growth with improved profitability - Half-yearly Report 2021

Page created by Jill Sutton
 
CONTINUE READING
Strong comparable net sales growth with improved profitability - Half-yearly Report 2021
Strong comparable
net sales growth
with improved
profitability
Half-yearly Report 2021

Charles Héaulmé
President and CEO
Thomas Geust
CFO
Strong comparable net sales growth with improved profitability - Half-yearly Report 2021
Strong comparable net sales growth
    with improved profitability

     • Net sales and profitability above pre-pandemic levels
        − The gradual recovery in demand for food on-
           the-go products has continued
        − Strong demand for retail tableware and fiber
           packaging continued
        − Significant inflationary cost environment,
           however well mitigated
     • Acquisition of Jiangsu Hihio-Art Packaging completed
       on June 11, 2021
     • We roll out new products supporting plastic
       substitution, e.g. fiber lids, new egg cartons in key
       markets

2   July 22, 2021   Half-yearly Report 2021
Strong comparable net sales growth with improved profitability - Half-yearly Report 2021
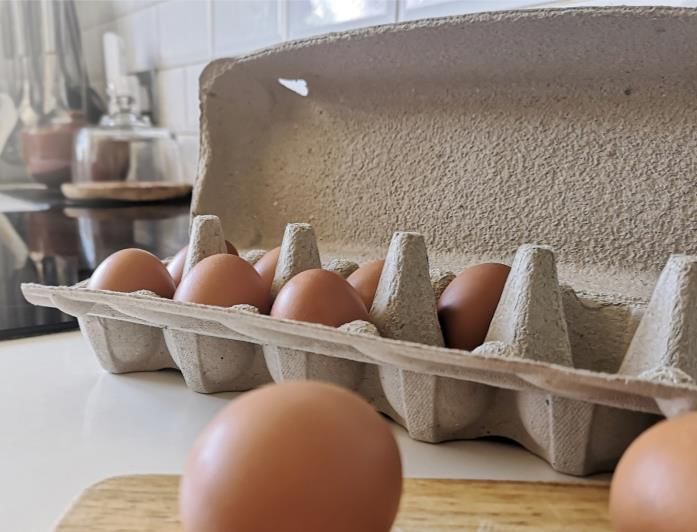
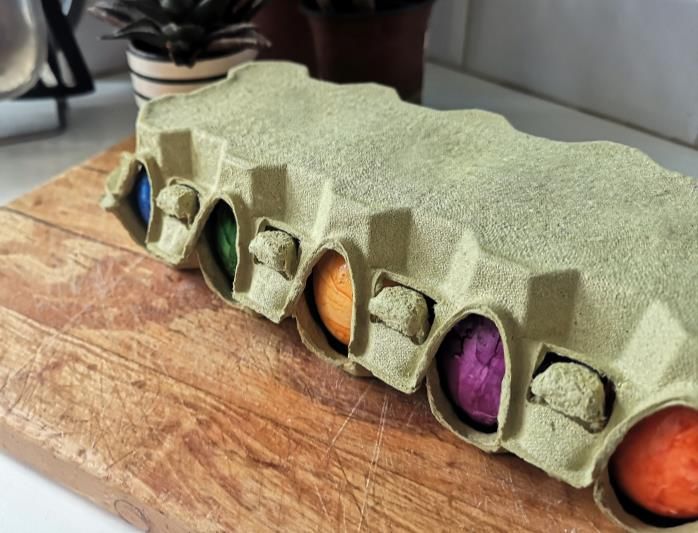
Examples of new products supporting plastic substitution

       Future Smart Duo fiber lids                         Smilepack                                            Futuro

          Future Smart Duo fiber lids are made from an     Smilepack, 100% plastic free egg cartons, are        Futuro, the first 100% plastic free egg carton for
          optimal mixture of wood and bagasse fibers.      Huhtamaki’s first product designed especially for    cooked colored eggs. Futuro is especially relevant
                                                           the U.S. egg industry, providing a sustainable and   to the German market, where hard-boiled eggs
              •     100% plant-based
                                                           functional alternative to traditional polystyrene    or “Bunte Eier” remain a popular snack and an
              •     Free of plastic coatings​
                                                           foam or plastic packaging for eggs.                  addition to lunch or dinner, with more than 80
              •     Recyclable​
                                                                                                                million packs sold yearly.
              •     Compostable in industrial facilities

3   July 22, 2021           Half-yearly Report 2021
Strong comparable net sales growth with improved profitability - Half-yearly Report 2021
Business performance
Q2 2021: Significant growth compared to the COVID-19 pandemic
    trough

         Development of net sales in Q2 2021                                                                                         Net sales increased 10% in Q2 2021
         (EUR million)
                                                                                                                                     • Comparable net sales growth 14%
                                                              1                                                                        (20% in emerging markets)
                                                                                   -35
                                        115
                                                                                                                                     • 4% negative currency impact

                                                                                                        877
                    797

                Q2 2020              Organic           Acquisitions            Currency              Q2 2021

     Comparable net sales growth is growth excluding foreign currency changes, acquisitions, divestments and ancillary businesses.
     Acquisitions calculated for 12 first months from closing.

5   July 22, 2021         Half-yearly Report 2021
H1 2021: Solid sales growth despite significant currency headwind

         Development of net sales in H1 2021                                                                                         Net sales increased 2% in H1 2021
         (EUR million)
                                                                                                                                     • Comparable net sales growth 6%
                                                              7
                                          112
                                                                                   -81                                                 (13% in emerging markets)
                                                                                                                                     • 5% negative currency impact

                    1,642                                                                              1,679

                H1 2020                Organic         Acquisitions            Currency               H1 2021

     Comparable net sales growth is growth excluding foreign currency changes, acquisitions, divestments and ancillary businesses.
     Acquisitions calculated for 12 first months from closing.

6   July 22, 2021           Half-yearly Report 2021
Continued gradual recovery of demand for food on-the-go

                                                                                                                                                        Long-term
                     Comparable growth                Q2 20            Q3 20             Q4 20            Q1 21             Q2 21       H1 20   H1 21
                                                                                                                                                        ambitions
                    Foodservice E-A-O                  -28%              -1%               -7%              -2%              40%        -17%    17%       5-7%

                       North America                    -5%               4%               -2%              -2%               9%         1%      4%       3-5%

                    Flexible Packaging                  2%                1%               0%                0%               6%         2%      3%       6-8%

                      Fiber Packaging                  10%                7%               8%                4%               1%        10%      3%       3-5%

                                   Group               -8%               2%               -2%               -0%              14%        -3%      6%       5+%

         Q2 commentary:
         • Demand for foodservice consistently recovering towards pre-pandemic levels – high growth vs. weak Q2 2020
         • Retail tableware continued to be strong in North America
         • Growth picked up in Flexible Packaging despite continued volatility
         • Continued growth in Fiber Packaging building on very strong Q2 2020
        Comparable net sales growth is growth excluding foreign currency changes, acquisitions, divestments and ancillary businesses.

7   July 22, 2021         Half-yearly Report 2021
Improved adjusted EBIT margin despite inflation of input costs

        MEUR                                                Q2 21                       Q2 20                   Change          H1 21     H1 20    Change

        Net sales                                            877.1                       797.1                       10%       1,679.0   1,641.7      2%
                              1
        Adjusted EBIT                                          79.9                        70.1                      14%        156.8     143.7       9%

            Margin                                           9.1%                        8.8%                                    9.3%     8.8%

        Adjusted EPS, EUR2                                     0.53                        0.44                      21%         1.02      0.90      13%

        Capital expenditure                                    51.8                        40.3                      29%         84.9      79.7       7%

         Q2 commentary:
         • Growth in net sales also compared to pre-pandemic levels
         • Adjusted EBIT improved through operational efficiency and pricing actions to offset input cost headwind
         • Increase in adjusted EPS following improvement in earnings
         • Increase in capex to accelerate growth and expand portfolio
       1) Excluding IAC of EUR -4.9 million in Q2 2021 (EUR 0.1 million) and EUR -10.3 million in H1 2021 (EUR 9.0 million).
       2) Excluding IAC of EUR -3.8 million in Q2 2021 (EUR 0.1 million) and EUR -7.9 million in H1 2021 (EUR 7.0 million).

8   July 22, 2021         Half-yearly Report 2021
Positive progress in the execution of our sustainability initiatives
    leads to improvement in our GSI
            Renewable or recycled materials                                                           Renewable electricity                  Non-hazardous waste recycled                     Health and safety
                        (% of total materials)                                                   (% of total electricity consumed)                   (% of total non-haz. waste)
                                                               2030                                                                                                                  Lost time injury       Total recordable
                                                              ambition
                                                                                                                                                                                     frequency rate         injury rate (TRIR)
                                                                                                                                                                                   (LTIFR) 12M rolling         12M rolling

                                                                                                                                                                                     LTIFR YTD2020           TRIR YTD2020
                                                                                                                                                                                                            12M rolling TRIR data
                                                                                                                                                                                                             collection complete
                                                                                                                                                                                                           from Dec 2020 onward.

                   Certified or recycled fiber                                                       GHG emissions (t CO2e)                             Waste to landfill                Water management plans
                          (% of raw materials)                                                                                                           (% of total waste)               (available in number of sites)

                                                                                                                                           2030
                                                                                                                                          ambition

    Blue figures displayed in the charts reflect Huhtamaki Group’s 2030 ambitions; GHG = greenhouse gas
    Huhtamaki has developed a Global Sustainability Index (GSI) to monitor its progress towards the long-term sustainability ambitions.

9   July 22, 2021                   Half-yearly Report 2021
Business segment
review
Foodservice EAO: Gradual recovery in demand continued

        Key figures, MEUR                        Q2 21               Q2 20              Change               Net sales and comparable growth (EUR million & %)
        Net sales                                 235.8               167.2                 41%
                                                                                                                                                236   231
            Comparable growth                          40%             -28%                                       218         207                                   213
                         1
                                                       19.9              6.2             >100%                                      167                                                2020
        Adjusted EBIT
            Margin                                 8.4%                3.7%                                                                                                            2021
                                                                                                                   -4%        -2%   -28%        40%   -1%           -7%                Comp.
        Capital expenditure                            15.4            18.5                -17%                                                                                        growth
        Operating cash flow1                           12.5             -7.0             >100%                           Q1                Q2               Q3            Q4

        Key figures, MEUR                         H1 21              H1 20              Change               • Gradual demand recovery continued, close to pre-COVID levels – discrepancies
        Net sales                                 443.2               384.8                 15%                between customer channels and markets remain
            Comparable growth                          17%             -17%                                  • Net sales and adjusted EBIT increased from a low base:
        Adjusted EBIT1                                 37.5            23.6                 59%                 • Improved through pricing actions and continued focus on operational
                                                                                                                   efficiency – partially offset by higher polymer prices
            Margin                                 8.5%                6.1%
                                                                                                                • Our transformation journey continues, focused on improving our
        Adjusted RONA                              9.3%                8.7%                                        competitiveness, innovation and sustainability
        Capital expenditure                            25.2            34.5                -27%              • The acquisition of Jiangsu Hihio-Art Packaging Co. Ltd. was completed on June 11
                                  1
        Operating cash flow                            33.9              4.1             >100%
        1) Excluding IAC of EUR -1.4 million in Q2 2021 (EUR -0.5 million) and EUR -5.6 million in H1 2021 (EUR -2.1 million).

11   July 22, 2021           Half-yearly Report 2021
North America: Recovery in foodservice and growth in retail
     tableware continued
        Key figures, MEUR                        Q2 21               Q2 20              Change               Net sales and comparable growth (EUR million & %)
        Net sales                                 295.2               296.1                 -0%

            Comparable growth                           9%              -5%                                       286              296        295   283
                                                                                                                             256                                  274
        Adjusted EBIT
                         1
                                                       38.2            37.9                  1%                                                                                     2020

            Margin                               13.0%               12.8%                                                                                                          2021
                                                                                                                   9%        -2%   -5%        9%    4%            -2%               Comp.
        Capital expenditure                            12.8              9.9                29%                                                                                     growth
        Operating cash flow1                           34.1            71.9                -53%                         Q1               Q2               Q3            Q4

        Key figures, MEUR                         H1 21              H1 20              Change               • Gradual recovery in demand for foodservice packaging continued. High
        Net sales                                 551.2               582.3                 -5%                demand for retail tableware
            Comparable growth                           4%               1%                                  • Strong sales growth driven by foodservice packaging and retail tableware –
        Adjusted EBIT1                                 69.4            68.4                  2%                offset by substantial negative currency translation
            Margin                               12.6%               11.7%                                   • Raw material price and distribution cost inflation mitigated by pricing
        Adjusted RONA                            17.4%               14.9%                                     actions
        Capital expenditure                            22.4            21.8                  3%              • Adjusted EBIT improved, driven by volume growth and operational
        Operating cash flow1                           47.1            79.2                -41%                efficiencies
        1) Excluding IAC of EUR -0.6 million in Q2 2021 (EUR 0.0 million) and EUR -0.6 million in H1 2021 (EUR -3.4 million).

12   July 22, 2021           Half-yearly Report 2021
Flexible Packaging: Solid overall demand, headwind from raw
     material prices
        Key figures, MEUR                        Q2 21               Q2 20              Change               Net sales and comparable growth (EUR million & %)
        Net sales                                 270.7               263.1                  3%
                                                                                                                  271         267   263        271   266
            Comparable growth                           6%               2%                                                                                      251

        Adjusted EBIT
                         1
                                                       16.6            19.1                -13%                                                                                    2020

            Margin                                 6.1%                7.3%                                                                                                        2021
                                                                                                                   22%
                                                                                                                     %        00%
                                                                                                                                %   22%
                                                                                                                                      %        66%
                                                                                                                                                 %   11%
                                                                                                                                                       %         00%
                                                                                                                                                                   %               Comp.
        Capital expenditure                            11.5              7.5                53%                                                                                    growth
        Operating cash flow1                           11.8              7.4                60%                          Q1               Q2               Q3          Q4

        Key figures, MEUR                         H1 21              H1 20              Change               • Overall good demand, though significant variation between product
        Net sales                                 537.8               534.0                  1%                categories and markets
            Comparable growth                           3%               2%                                  • Sales growth in most markets against a weak Q2 2020
        Adjusted EBIT1                                 38.3            40.1                  -4%             • Earnings impacted negatively by higher raw material prices, partially offset
            Margin                                 7.1%                7.5%                                    by improved operational efficiency and pricing actions
        Adjusted RONA                              9.8%              10.1%                                      • India particularly impacted both through cost inflation and soft demand
        Capital expenditure                            19.7            15.5                 27%              • Marco Hilty appointed President, Flexible Packaging as of September 1
        Operating cash flow1                           26.7              9.1             >100%
        1) Excluding IAC of EUR -1.6 million in Q2 2021 (EUR -0.3 million) and EUR -2.8 million in H1 2021 (EUR -4.9 million).

13   July 22, 2021           Half-yearly Report 2021
Fiber Packaging: Continued solid performance

        Key figures, MEUR                        Q2 21               Q2 20              Change               Net sales and comparable growth (EUR million & %)
        Net sales                                      80.4            75.7                  6%

            Comparable growth                           1%             10%                                                                   80                       85
                                                                                                                   75        79    76               72
        Adjusted EBIT
                         1
                                                        8.3              8.5                 -2%                                                                                         2020

            Margin                               10.3%               11.2%                                                                                                               2021
                                                                                                                   9%        4%   10%        1%     7%                8%                 Comp.
        Capital expenditure                            11.6              4.3             >100%                                                                                           growth
        Operating cash flow1                            2.4              7.5               -68%                         Q1              Q2               Q3                Q4

        Key figures, MEUR                         H1 21              H1 20              Change               • Continued solid demand for fiber-based packaging, with variation across markets
        Net sales                                 158.9               150.2                  6%              • Strong growth especially in Russia and France
            Comparable growth                           3%             10%
                                                                                                             • Earnings negatively impacted by higher raw material prices, partially offset by
        Adjusted EBIT1                                 17.8            16.7                  6%                pricing actions and operational efficiencies
            Margin                               11.2%               11.1%
                                                                                                             • Investment into new manufacturing unit in KwaZulu-Natal in South Africa
        Adjusted RONA                            15.7%               13.4%                                     announced in May – in addition to previously announced capacity expansions e.g.
        Capital expenditure                            16.9              7.7             >100%                 in Egypt and Russia
        Operating cash flow1                            5.0              7.4               -32%
        1) Excluding IAC of EUR -0.5 million in Q2 2021 (EUR -0.8 million) and EUR -0.5 million in H1 2021 (EUR -1.5 million).

14   July 22, 2021           Half-yearly Report 2021
Financial review
Higher sales and operational improvements driving improved earnings
          MEUR                                              Q2 21                   Q2 20               Change                        H1 21                   H1 20               Change                  • Sales growth supported by all
          Net sales                                          877.1                  797.1                    10%                   1,679.0                 1,641.7                       2%                 segments and partly offset by
                                                                                                                                                                                                            currency headwind
          Adjusted EBITDA 1                                  121.1                  112.1                      8%                      238.8                  229.1                      4%

              Margin 1                                     13.8%                   14.1%                                             14.2%                   14.0%                                        • Earnings improved following
                                                                                                                                                                                                            improved operational
          Adjusted EBIT2                                       79.9                   70.1                   14%                       156.8                  143.7                      9%
                                                                                                                                                                                                            efficiency and pricing actions
              Margin 2                                       9.1%                    8.8%                                              9.3%                    8.8%
                                                                                                                                                                                                          • Lower net financial items
          EBIT                                                 75.0                   70.2                     7%                      146.6                  152.7                     -4%
          Net financial items                                   -5.9                   -8.4                  30%                       -14.3                   -17.6                   19%                • Tax rate 23%
          Adjusted profit                                                                                                                                                                                 • Adjusted EPS increased 21% in
                                                               74.0                   61.7                   20%                       142.6                  126.1                    13%
          before taxes                                                                                                                                                                                      Q2
          Adjusted income tax
                                                             -17.3                   -13.9                  -25%                       -33.4                   -28.4                  -18%
          expense3
          Adjusted profit for
                                                               56.7                   47.8                   18%                       109.2                    97.7                   12%
          the period4
          Adjusted EPS, EUR4                                   0.53                   0.44                   21%                         1.02                   0.90                   13%

        1) Excluding IAC of EUR -6.8 million in Q2 2021 (EUR 0.9 million) and EUR -9.7 million in H1 2021 (EUR 14.0 million).   3) Excluding IAC of EUR 1.2 million in Q2 2021 (EUR -0.0 million) and EUR 2.4 million in H1 2021 (EUR -2.0 million).
        2) Excluding IAC of EUR -4.9 million in Q2 2021 (EUR 0.1 million) and EUR -10.3 million in H1 2021 (EUR 9.0 million).   4) Excluding IAC of EUR -3.8 million in Q2 2021 (EUR 0.1 million) and EUR -7.9 million in H1 2021 (EUR 7.0 million).

16   July 22, 2021             Half-yearly Report 2021
Continued negative currency impact
                      Average              Average           Change in                                                                  Change in
                                                                                                        Closing rates
                        rate                 rate             average                                                                    closing
                       H1 20                H1 21               rate                Q2 20       Q3 20       Q4 20       Q1 21   Q2 21      rate
       USD                   1.10                    1.21            -9%              1.13       1.17         1.23       1.17    1.19        -5%    Foreign currency
       INR                  81.63                   88.45            -8%            85.19       86.28       89.88       86.25   88.30        -4%
                                                                                                                                                    translation impact
       GBP                   0.87                    0.87             1%              0.92       0.91         0.90       0.85    0.86         6%
                                                                                                                                                     Q2 2021
                                                                                                                                                     (EUR million)
       CNY                   7.75                    7.80            -1%              7.98       7.98         8.01       7.72    7.68         4%
                                                                                                                                                      Net sales      EBIT
       AUD                   1.68                    1.56             7%              1.64       1.64         1.60       1.54    1.58         4%
                                                                                                                                                        -35          -4
       THB                  34.82                   37.13            -7%            34.85       36.99       36.77       36.71   38.17       -10%

       RUB                  76.61                   89.64           -17%            78.92       92.16       91.89       89.16   86.47       -10%     H1 2021
                                                                                                                                                     (EUR million)
       BRL                   5.40                    6.50           -20%              6.11       6.60         6.36       6.77    5.88         4%
                                                                                                                                                      Net sales      EBIT
       NZD                   1.76                    1.68             4%              1.75       1.77         1.71       1.68    1.70         3%
                                                                                                                                                        -81          -8
       ZAR                  18.30                   17.54             4%            19.43       19.87       18.01       17.54   17.05        12%

      Please note: Income statement is valued on average rate, balance sheet on closing rate.

17   July 22, 2021        Half-yearly Report 2021
Net debt to adjusted EBITDA decreased compared to Q2/2020

          Net debt, net debt/adj. EBITDA and gearing                                                     • Net debt/Adj. EBITDA at 1.9
                                                                                   Covenant level 3.75
                                                                                                         • At the end of Q2 2021:
                                                                                                           • Cash and cash equivalents
                                                                                                             EUR 213 million
                                                                                        Ambition
                     2.1
                                                                                                           • Unused committed credit facilities
                                 2.0
                                                     1.9            1.9     1.9
                                                                                           2–3               available EUR 324 million
                                                            1.8
                 980
                                908              896               898     933                           • Net debt EUR 933 million and
                                                           867                           Net debt, M€
                                                                                                           lease liabilities EUR 159 million
                 0.68           0.62             0.65      0.64    0.62    0.66          Net debt/Adj.
                                                                                         EBITDA

                                                                                         Gearing

                Q1 20          Q2 20            Q3 20      Q4 20   Q1 21   Q2 21

18   July 22, 2021         Half-yearly Report 2021
Loan maturities

          Debt maturity structure June 30, 2021                                                                 • Average maturity 3.1 years at the
          (EUR million)                                                                                           end of Q2 2021 (3.1 at the end of
                                                                                                                  Q2 2020)
            700

            600                                                                                                 • Unused committed credit facilities
            500                                                                                                   of EUR 324 million maturing in
            400
                                                                                                                  2022
            300

            200

            100

               0
                         2021                  2022      2023     2024            2025            Later
                     Lease liabilities                          Contingent considerations
                     Available unused committed facilities      Drawn committed credit facilities
                     Commercial paper program                   Uncommitted loans from financial institutions
                     Bonds and other loans

19   July 22, 2021        Half-yearly Report 2021
Free cash flow below last year’s level

          Free cash flow bridge                                                                                              Cash flow driven by:
          (EUR million)
                                                                                                                             • Higher adjusted EBITDA
                                                                                                                               • In comparison period, Laminor
                229 243                                                                                                          gain of ~20 MEUR is recognized
                                                                                                                                 as non-cash in ‘Other’

                                                                                                                             • Working capital well managed
                                                                                                                 37   46
                                                                                          1    1                             • Higher taxes and capex
                                                 -10 -10             -11                              -7   -21
                                                               -27
                               -64 -76
                                                                            -85 -80

                Reported       Change in       Net financial    Taxes        Capital     Proceeds      Other     Free cash
                 EBITDA         working           items                    expenditure from selling                 flow
                                capital                                                   assets
                                                                H1 2021      H1 2020

20   July 22, 2021         Half-yearly Report 2021
Stable financial position

          MEUR                                      Jun 2021   Jun 2020   • Higher total assets following growth
          Total assets                                 3,775     3,672    • Net debt and gearing increased
          Operating working capital                     580        617    • Lower equity
          Net debt                                      933        908        •   Negative impact from FX translation
                                                                                  differences
          Equity & non-controlling interest            1,414     1,475
                                                                              •   No dividend in H1/2020, but fully
          Gearing                                       0.66       0.62           recognized in H1/2021

          Adjusted ROI1                               12.3%      11.6%    -> Financial position stable
          Adjusted ROE1                               15.6%      14.2%

      1) Excluding IAC.

21   July 22, 2021        Half-yearly Report 2021
Progress towards long-term financial ambitions

                                                                                                                               Long-term
                                                     2014   2015    2016         2017        2018      2019   2020   H1 2021
                                                                                                                                ambition

          Organic growth                              6%     4%        4%          3%            5%     6%     -2%       6%         5+%

          Adjusted EBIT margin                       7.8%   8.7%     9.4%        9.0%        8.1%      8.6%   9.1%      9.3%      10+%

          Net debt/Adj. EBITDA                        1.0    1.6      1.8          1.8           2.3    2.0    1.8       1.9        2-3

          Dividend payout ratio                      47%    40%      40%          42%            50%   47%    47%               40-50%

          • In April, the AGM decided on a dividend payment of EUR 0.92 in two instalments:
                     • First instalment of EUR 0.46 per share was paid on May 3, 2021
                     • Second instalment of EUR 0.46 per share will be paid on October 8, 2021

      FY 2018 figures restated for IFRS 16 impact.

22   July 22, 2021         Half-yearly Report 2021
Looking forward
Outlook 2021
     (unchanged)

     The Group’s trading conditions are expected to improve compared to 2020, however with
     continued volatility in the operating environment. Huhtamaki's diversified product
     portfolio provides resilience and the Group’s good financial position enables addressing
     profitable growth opportunities.

24   July 22, 2021   Half-yearly Report 2021
Short-term risks and uncertainties

     The COVID-19 pandemic may create disturbances in the Group’s trading conditions and its
     operating environment, as well as in demand for the Group’s products. Volatile raw
     material, distribution and energy prices as well as movements in currency rates are
     considered to be relevant short-term business risks and uncertainties in the Group's
     operations. General political, economic and financial market conditions can also have an
     adverse effect on the implementation of the Group's strategy and on its business
     performance and earnings. Further, natural disasters and social unrest may have negative
     effects on the Group’s operating environment.

25   July 22, 2021   Half-yearly Report 2021
Strong comparable net sales growth
     with improved profitability

      • Net sales and profitability above pre-pandemic levels
         − The gradual recovery in demand for food on-
            the-go products has continued
         − Strong demand for retail tableware and fiber
            packaging continued
         − Significant inflationary cost environment,
            however well mitigated
      • Acquisition of Jiangsu Hihio-Art Packaging completed
        on June 11, 2021
      • We roll out new products supporting plastic
        substitution, e.g. fiber lids, new egg cartons in key
        markets

26   July 22, 2021   Half-yearly Report 2021
Financial calendar 2021

       October 21, 2021
       Q3 2021 Interim Report

27   July 22, 2021   Half-yearly Report 2021
Disclaimer
     Information presented herein contains, or may be deemed to contain, forward-looking statements. These statements
     relate to future events or Huhtamäki Oyj’s or its affiliates’ (“Huhtamaki”) future financial performance, including, but
     not limited to, strategic plans, potential growth, expected capital expenditure, ability to generate cash flows, liquidity
     and cost savings that involve known and unknown risks, uncertainties and other factors that may cause Huhtamaki’s
     actual results, performance or achievements to be materially different from those expressed or implied by any forward-
     looking statements. By their nature, forward-looking statements involve risks and uncertainties because they relate to
     events and depend on circumstances that may or may not occur in the future. Such risks and uncertainties include, but
     are not limited to: (1) general economic conditions such as movements in currency rates, volatile raw material and
     energy prices and political uncertainties; (2) industry conditions such as demand for Huhtamaki’s products, pricing
     pressures and competitive situation; and (3) Huhtamaki’s own operating and other conditions such as the success of
     manufacturing activities and the achievement of efficiencies therein as well as the success of pending and future
     acquisitions and restructurings and product innovations. Future results may vary from the results expressed in, or
     implied by, forward-looking statements, possibly to a material degree. All forward-looking statements made in this
     presentation are based on information currently available to the management and Huhtamaki assumes no obligation to
     update or revise any forward-looking statements. Nothing in this presentation constitutes investment advice and this
     presentation shall not constitute an offer to sell or the solicitation of an offer to buy any securities or otherwise to
     engage in any investment activity.

28   July 22, 2021   Half-yearly Report 2021
For further information,
           please contact us:
           ir@huhtamaki.com
           www.huhtamaki.com/investors

July 22, 2021
Half-yearly
29          Report 2021
You can also read