Q2 2020 Interim Report - 11 Aug 2020 - Gaming Innovation Group
←
→
Page content transcription
If your browser does not render page correctly, please read the page content below

Q2 2020 Interim Report

   11 Aug 2020
Q2 2020 - Interim Report

    Today’s presenters

              Richard    Tore
              Brown      Formo
              CEO        Group CFO

2
iGaming solutions based on innovative technology
     GiG focusing strategy on ambition to become global Tier 1 B2B provider. Our strategy is centered on two customer
         focused business areas, supported by our group ambition for top performance and operational excellence

                                                         Group

                   Platform & Sports                                                    Media

                Drive sustainable growth and                             Drive quality traffic, connecting players
                 profitability of our partners                               and operators on a Global scale

                                                                                                                        3
3
Q2 2020 - Interim Report

    GiG in brief

       ~470                           €65m           Approx.

       Employees                      Market cap

                                      Dual-listed
       Offices in Malta,
                                      on Oslo Børs and at
       Denmark & Spain
                                      Nasdaq Stockholm

       Global Platform
                                      Over 25 primary
       Licenses: Malta, UK,
                                      countries targeted by
       New Jersey & Iowa,
                                      Media assets
       Sweden, Spain, Romania,
       Croatia, Argentina (pending)

4
Q2 2020 - Interim Report

        Key takeaways Q2 2020

    ●   Continued quarterly growth with revenues in Q2 2020 of €16.7m
        (11.3), 47% growth Y/Y and 49% Q/Q

    ●   EBITDA in Q2 was €2.8m (1.5), 93% growth Y/Y and 382% Q/Q

    ●   EBITDA margin of 17.0% (13.0%)

    ●   EBITDA for Sports Betting Services improved to €-0.9m (-1.5) due to
        reduction in operating expenses by 44%

    ●   B2C vertical was divested to Betsson effective on 16 April 2020, with
        Betsson as a new long term customer on Platform Services

    ●   SEK 300M bond repaid

    ●   Signed a long term agreement with GS Technologies for platform
        provision.

5
Q2 2020 - Interim Report

                                          Head figures development

                          Revenues                                                                       EBITDA (MEUR)
                          (MEUR)

                                        Revenues                                Revenues adj.                            EBITDA
                                        +47% Y/Y                                    +16% Y/Y                            +93% Y/Y
                                        +49% Q/Q                                    +23% Q/Q                           +382% Q/Q

    *Reported revenues includes revenues from Sky City, a platform client were GiG recognize the full operations in
6   its profit and loss statement, and these revenues are partly offset by related cost of sales and site overheads.
Q2 2020 - Interim Report

    Strategic Update

7
Q2 2020 - Interim Report
Significant growth
opportunities Global Online Gambling Market in Bn EUR
2024e
The global online gambling market is estimated 2023e
to be worth €53 billion in 2019
2022e CAGR 9%
20202024
Despite the COVID impact, market is still
2021e LB CAGR 2019-2024 1%
estimated to remain at the same levels in 2020
and to grow at a CAGR of 9%
2020e COVID19 Impact
Key Drivers for Online Gambling Growth 2019
• Market digital adoption and maturity 2018
• Regulation
2017
CAGR 12%
20152019
2016
LB CAGR same period 3%
2015
Source H2GC June 2020
8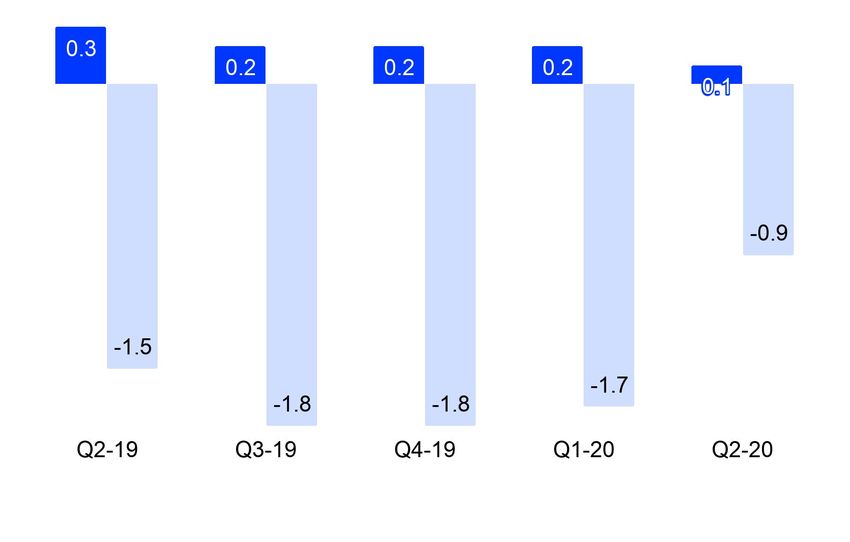
Q2 2020 - Interim Report
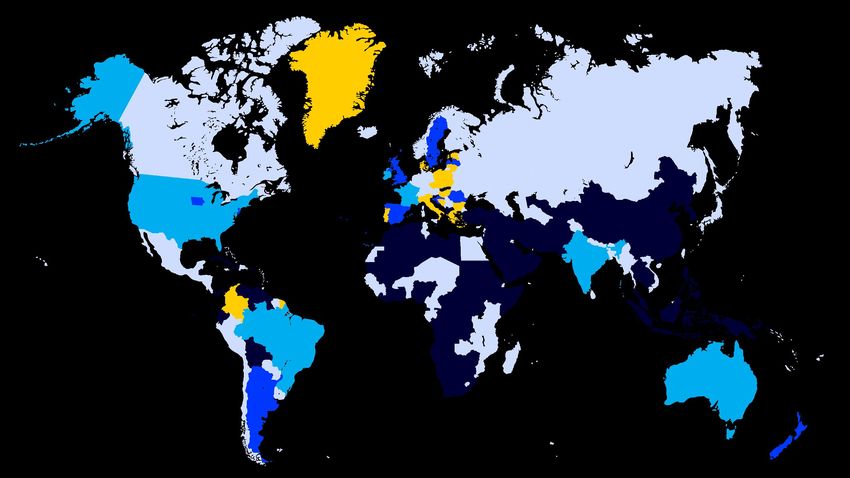
Positioned to capitalise on projected
growth in regulated markets
GiG is well positioned via its Platform
and Media business units to
capitalize on the growth in the in the
industry by positioning itself in high
barrier to entry re-regulating and
regulating markets where drive of
offline to online is high potential
Unregulated
Regulated
Partially regulated
Licence already held or Partner
Restricted
9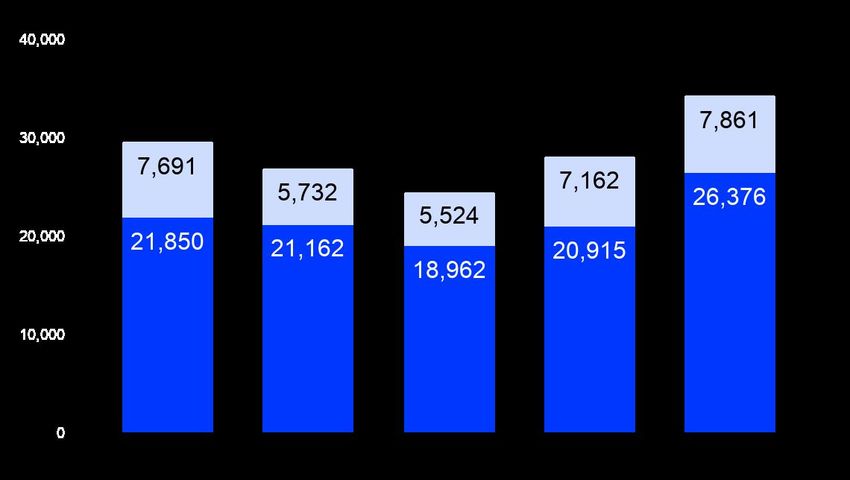
Q2 2020 - Interim Report

     Strengthening client base and future revenue
     ●   Sales pipeline developing well despite delays in processes caused by Covid-19

     ●   Signed long-term agreement with GS Technologies Limited for the provision of GiG's platform and
         front-end development to a new casino brand with its own license from Maltese Gaming Authority

     ●   Signed K.A.K. DOO Skopje, one of North Macedonia’s leading leisure groups, that will take the Le
         Grand Casino brand online.

     ●   Signed platform agreement with leading iGaming specialist Mill of Magic/Casumo to power a new Pay
         N Play brand

     ●   Signed a head of terms agreement with Grupo Slots, Argentina’s premier gaming and entertainment
         group, to enter the regulated City of Buenos Aires online gaming market.

     ●   Additional agreements are expected to be signed before the year end.

                          Securing long term, recurring revenues in different geographies

10
Q2 2020 - Interim Report
GiG’s core strengths are
positioning us to capture our
target market:
GiG’s Strengths
● Platform: providing Casino, Sportsbook
and Data technology to Operators ● End to End product and service solutions
globally as well as full Managed Services
● First class technology and product
capability
offering
● Media: Successful track record in ● Operational knowledge and Experience
multiple markets sending traffic to leading ● Strong Track Record of Partnerships &
iGaming operators Media Performance
● Omnichannel experience
11Q2 2020 - Interim Report
Business Update
12Q2 2020 - Interim Report
Media Services
Revenue & EBITDA (MEUR)
Media services
● GiG Media Services continued its growth and positive
development in Q2. FTDs increased by 22% and
revenues by 5% Q/Q
● Paid media continues to see quarter on quarter
improvements with revenue up 27% YoY and 21% QoQ
● Google’s algorithm update in May had a slightly negative Revenue EBITDA
effect on publishing. Was immediately addressed
resulting in a positive trend
Media Services - FTDs
● FTD growth in Q2 driven by a more diverse geographical Split between publishing and paid
spread
● Affiliate license was granted for Colorado (US) - more
states in process
● Switch of paid media over to casino enabled growth in
the second quarter despite the closure of sports events
● Maintain focus on developing business outside our
current core markets in 2020.
Publishing Paid
13Q2 2020 - Interim Report
Platform Services
Platform services Revenue & EBITDA (MEUR)
● Revenues for Platform Services were €8.2 (4.2) million in the
second quarter 2020. Adjusted revenues* were €4.7 (4.2)
million, a 11% increase Y/Y and 22% Q/Q
● EBITDA for the second quarter 2020 was €-0.9 (-1.1) million,
Revenue EBITDA
an improvement of 18% Y/Y and 41% Q/Q
● The sales pipeline is developing positively, however some of Platform Services adj.
the final contract negotiations slowed as land based Revenue & EBITDA (MEUR)
operators come to terms with actions around COVID-19 in
Q2
● Signed 4 new agreements last 6 weeks
● 34 brands were operating on the platform during the quarter
& 9 brands are in integration phase for launch
*Reported revenues includes revenues from Sky City, a platform client were GiG
recognize the full operations in its profit and loss statement, and these revenues Revenue adj. EBITDA
are partly offset by related cost of sales and site overheads.
14Q2 2020 - Interim Report
Sports betting
services
Sports Betting Services
Revenue & EBITDA (MEUR)
● Revenues were impacted by the closure of sport events in the
quarter due to COVID-19
● A restructuring initiative was rolled out in April to significantly
reduce costs. Full effects will be seen in Q4-20
● EBITDA for Sports Betting Services improved to €-0.9m (-1.5)
due to reduction in operating expenses by 44% Q/Q
● GiG aims to target emerging markets in conjunction with end to
end platform solutions, including sports offering
● Move to make GiG’s platform sportsbook agnostic and allowing
customers the choice of sportsbook. Leading to enhanced
sales and opportunities for the platform Revenue EBITDA
● Progress being made with regards to integrations of third party
solutions.
15Q2 2020 - Interim Report
Headcount – end of quarter
Cost savings &
initiatives
GiG continues to focus on cost control and optimise the
Company to support the new focused B2B business.
● Tech costs down by ~33% QoQ as team begins
infrastructure migration
● Continued decline in overall headcount in the quarter
Other operating expenses - MEUR
● 63 headcount transferred to Betsson in April with
additional staff supporting the Transition Service
Agreement
● On a like for like basis adjusting for IRFS principles
Opex was down 12% YoY and QoQ
● Other cost savings initiatives are progressing according
to plan, which is expected to further reduce operating
expenses by year end 2020.
As reported Adjustment
16Q2 2020 - Interim Report
Events after the quarter &
Summary
17Q2 2020 - Interim Report
Update after the quarter
● Signed three new long term customers onto the platform
and one Sportsbook customers
● Two of which are land based casino groups in regulated
markets, where GiG can provide omni channel offering
and assist them with capturing emerging local markets of
online gambling.
● Globally diverse new customers and trend continues as
land based and retail business look to go online and
regulation drives demand.
● In July revenues on adjusted basis were up 38% vs same
period last year
18Q2 2020 - Interim Report
Summary ● Continued quarterly growth in both revenue and EBITDA despite
reduction in sporting events
● Media business delivered growth in all KPI’s, for second consecutive
quarter, a testament to agility to react to situations
● The sale of B2C was finalised and GiG completed it strategic
repositioning towards a fully focused B2B company
● Signed four new agreements - securing geographical, regulated &
diversified recurring future revenue. The sales pipeline is strong and
additional agreements expected in 2020
● Initiatives implemented to significantly reduce burn rate in Sports
and place it in a sustainable long term position
● Revenue guidance for continued operations for 2020 is increased to
€52-57M on an adjusted basis with and EBITDA range of €12-15M
A diverse B2B Company well positioned for future growth in
transformative online gambling industry
19Q2 2020 - Interim Report
Q/A
20Q2 2020 - Interim Report
Appendix
21Q2 2020 - Interim Report
Largest shareholders 31 July 2020
1 7 603 559 8,4 % Andre Lavold
2 6 800 000 7.6 % Swedbank Robur Ny Teknik
3 6 154 552 6.8 % Myrlid AS
4 4 896 125 5.4 % Henrik Persson Ekdahl
5 3 880 999 4.3 % Morten Hillestad Holding AS
6 3 509 128 3.9 % Hans Mikael Hansen
7 2 699 324 3.0 % Skandinaviska Enskilda Banken S.A. nom.
8 2 478 585 2.8 % Stenshagen Invest AS
9 2 047 161 2.3 % G.F. Invest AS
10 2 009 437 2.2 % Kvasshøgdi AS
11 1 927 662 2.1 % CMM Invest I AS
12 1 907 146 2.1 % Ben Clemes
13 1 809 541 2.0 % Saxo Bank A/S nom.
14 1 602 213 1.8 % Digeelva Invest I AS
15 1 469 097 1.6 % Frode Fagerli
16 1 407 745 1.6 % Nordnet Bank AB nom.
17 1 342 136 1.5 % Mikael Riese Harstad
18 1 278 684 1.4 % Försäkringsaktiebolaget Avanza Pension
19 1 158 783 1.3 % Nordea Bank Abp Denmark nom.
20 998 667 1.1 % Nordnet Livsforsikring AS
Top 20 56 980 544 63.3 %
Other 33 025 082 36.7 %
TOTAL 90 005 626 100.0 %
22Q2 2020 - Interim Report
Income statement
EUR 1 000 (Unaudited)
B2C included as discontinued operations Q2 2020 Q2 2019 6M 2020 6M 2019 2019
Revenues 16 678 11 338 27 840 23 581 44 054
Cost of sales 806 249 1 231 520 906
Gross profit 15 872 11 089 26 609 23 061 43 148
Gross profit margin 95% 98% 96% 98% 98%
Marketing expenses 4 504 1 393 6 180 2 890 5 272
Other operating expenses 8 528 8 223 16 999 16 392 34 432
Total operating expenses 13 032 9 616 23 179 19 282 39 704
EBITDA 2 840 1 473 3 430 3 779 3 444
Depreciation & amortisation 3 086 3 585 6 112 7 210 14 422
Amortisation of acquired affiliate assets 1 953 2 301 4 217 4 700 9 228
Impairment of intangibles - - - - 3 911
EBIT -2 199 -4 413 -6 899 -8 131 -24 117
Financial income (expense) -1 369 -3 314 -3 596 -4 471 -9 362
Unrealised exchange gain (loss) on bond -1 514 1 275 1 062 2 177 1 140
Other income (expense) 2 -3 18 -33 -5
Result before income taxes -5 080 -6 455 -9 415 -10 458 -32 344
Income tax refund (expense) -96 -62 -156 -197 -627
Loss from continuing operations -5 176 -6 517 -9 571 -10 655 -32 971
Income/(loss) from discontinued operations -867 385 950 1 647 -31 720
Loss for the period -6 043 -6 132 -9 621 -9 008 -64 691
23Q2 2020 - Interim Report
Balance sheet
EUR 1 000 (unaudited)
B2C included as discontinued operations 30 Jun 2020 30 Jun 2019 31 Dec 2019
Assets
Goodwill 15 516 69 525 15 995
Intangibles assets 36 260 63 012 40 912
Deposits and other non-current assets 20 476 26 208 20 191
Total non-current assets 72 252 158 745 77 098
Prepaid and other current assets 33 54 3
Trade and other receivables 18 809 21 990 20 464
Cash and cash equivalents 7 508 15 196 4 557
Total current assets 26 350 37 240 25 024
Assets of discontinued operations held for sale - - 32 966
Total assets 98 602 195 985 135 088
Liabilities and shareholders' equity
Total shareholders' equity 13 567 78 362 20 920
Trade payables and accrued expenses 33 590 31 583 24 940
Short term loans - 619 -
Bond payable 3 462 27 674 30 035
Total current liabilities 37 052 59 876 54 975
Bond payable 34 149 38 148 36 908
Deferred tax liability 1 390 1 117 1 270
Other long term liabilities 12 444 18 482 12 496
Total long term liabilities 47 983 57 747 50 674
Total liabilities 85 035 117 623 105 649
Liabilities associated with assets classified as held for sale - - 8 519
Total liabilities and shareholders' equity 98 602 195 985 135 088
24Q2 2020 - Interim Report
Cash flow
In EUR 1 000
B2C included as discontinued operations Q2 2020 Q2 2019 6M 2020 6M 2019 2019
Cash flow from operating activities 10 054 3 189 18 112 5 818 4 077
Cash flow used by investing activities 20 793 -3 469 17 786 -7 649 -10 501
Cash flow from financing activities -28 967 2 446 -32 122 2 446 -7 897
Translation (loss)/gain 516 -49 -812 -80 -245
Fair value movements -16 -47 -13 -8 -1 284
Net change in cash and cash equivalents 2 380 2 070 2 951 527 -15 850
Cash and cash equivalents at start of period 5 128 13 126 10 295 14 669 14 669
Cash and cash equivalents attributable to discontinued
operations - - -5 738 - 5 738
Cash and cash equivalents at end of period 7 508 15 196 7 508 15 196 4 557
25Q2 2020 - Interim Report
Legal disclaimer
Gaming Innovation Group Inc. gives forecasts. Certain statements in this report presentation are
forward-looking and the actual outcome may be materially different. In addition to the factors discussed,
other factors could have an impact on actual outcomes. Such factors include developments for customers,
competitors, the impact of economic and market conditions, national and international legislation and
regulations, fiscal regulations, the effectiveness of copyright for computer systems, technological
developments, fluctuation in exchange rates, interest rates and political risks.
26You can also read