Strong growth and solid cash flow - First quarter 2021 - Scatec
←
→
Page content transcription
If your browser does not render page correctly, please read the page content below
First quarter 2021
Strong growth and
solid cash flow

Disclaimer

    The following presentation is being made only to, and is only directed at, persons to whom such presentation
    may lawfully be communicated (’relevant persons’). Any person who is not a relevant person should not rely, act
    or make assessment on the basis of this presentation or anything included therein.
    The following presentation may include information related to investments made and key commercial terms
    thereof, including future returns. Such information cannot be relied upon as a guide to the future performance of
    such investments. The release, publication or distribution of this presentation in certain jurisdictions may be
    restricted by law, and therefore persons in such jurisdictions into which this presentation is released, published or
    distributed should inform themselves about, and observe, such restrictions. This presentation does not constitute
    an offering of securities or otherwise constitute an invitation or inducement to any person to underwrite,
    subscribe for or otherwise acquire securities in Scatec ASA or any company within the Scatec Group. This
    presentation contains statements regarding the future in connection with the Scatec Group’s growth initiatives,
    profit figures, outlook, strategies and objectives as well as forward looking statements and any such information
    or forward-looking statements regarding the future and/or the Scatec Group’s expectations are subject to
    inherent risks and uncertainties, and many factors can lead to actual profits and developments deviating
    substantially from what has been expressed or implied in such statements.
    The following presentation contains unaudited pro forma financial information which has been prepared solely
    for illustrative purposes to show how the acquisition of SN Power might have affected the financials of the group
    if the acquisition had occurred at an earlier date. All pro forma financials in this presentation are unaudited.
    Alternative performance measures (APM) used in this presentation are described and presented in the fourth
    quarter report of the group for 2020.

2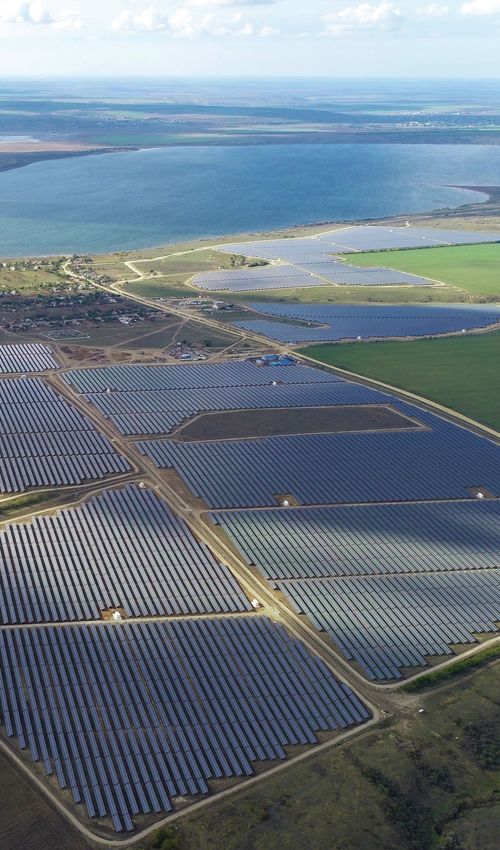
Agenda
    • Highlights and project update
        Raymond Carlsen, CEO
    • Financial review
        Mikkel Tørud, CFO
    • Market & outlook
        Raymond Carlsen, CEO

3
Q1’21
 Strong growth and solid cash flow
                                                                                              Power production (GWh)

  •    Acquisition of SN Power completed – hydro assets                                                  2.4x
       contributing with strong growth                                                                           854

  •    Power production of 854 (349) GWh and Group
       EBITDA¹ of NOK 636 (346) million
  •    Power Production cash flow to equity of NOK 681²
       (105) million
  •    Started construction of 150 MW in Pakistan
                                                                                                349
  •    2025 growth target: 15 GW installed
       - capex of NOK 100 billion

                                                                                               Q1 2020          Q1 2021
  1) EBITDA and other alternative performance measures (APMs) are defined and reconciled as
     a part of the APM section of the first quarter report on pages 37-40.
4 2) including refinancing proceeds of NOK 397 million
A broad and growing asset portfolio

                                                Europe & Central Asia
        Scatec in brief                               506 MW
                                                                          Rest of Asia
                                                                        1,450 MW

      Develop, build, own and   Latin America
     operate renewable energy   383 MW

                                                 Africa & Middle East
      3.5 GW in operation and
                                                     1,175 MW
         under construction
                                                                            2,053 MW

      More than 500 employees                                               1,422 MW
           in 23 countries
                                                                                39 MW

5
Mature projects expected to start construction in 2021

                                Pakistan, 150 MW                                                Tunisia*, 360 MW         South Africa, 600 MW
                               • Financial Close in Q1                                         • Backlog                • Pipeline
                               • 75% leverage                                                  • Tariff awarded         • Bid into RMIPP**
                               • 75% equity stake                                              • 75% leverage           • 80% leverage
                               • Construction started                                          • 50-60% target equity   • 51% equity stake
                                 in April                                                        stake

                                Brazil, 101 MW                                                  Brazil, 530 MW           India, 900 MW
                               • Backlog                                                       • Pipeline               • Pipeline
                               • Blended off-take                                              • Equinor and Hydro      • Tariff awarded
                               • Kroma and Equinor                                               partners               • 75% leverage
                                 partners                                                      • Negotiating off-take   • 50% equity stake
                               • 60% leverage                                                  • 70% leverage           • No EPC
                               • 40% equity stake                                              • 33% equity stake

    * Tozeur and Sidi Bouzid, 60 MWp each and Tataouine, 240 MWp
    ** RMIPP: Risk Mitigation IPP Procurement Program. REIPPP: Renewables IPP Procurement Program
6
ESG: Maintaining our strong
    presence in local communities

                                    Ukraine: Online training courses
                                    Virtual education courses for about 200 teenagers
                                    Argentina: Women empowerment programme
                                    Garment manufacturing to make fleece ponchos
                                    Honduras: Installation of a water tank
                                    Installed water tank for 52 families
                                    Jordan: School heating project in Ma’an
                                    Solar systems totalling 111.7 KWp for 9 schools

7
ESG ambitions      Key focus areas

                               Lifecycle management
      32 ESG targets           Strategy for lifecycle management of equipment
         for 2021

                                Climate target
                                Climate roadmap to reach 2050 targets

                                Responsible supply chain
                                ESG risk and close engagement with key suppliers

                                Human rights
                                Strengthen due diligence and training to exposed groups

8
Financial review
Mikkel Tørud, CFO

                    9
Strong growth in revenues and EBITDA

     Proportionate financials
     Quarterly (NOK million)                              Last 12 months (NOK million)

       EBITDA         Revenues                                            5,679

       Cash Flow to Equity

                                                                                                2,989
                                                  1,010
                              866

                                          636                     1,602                 1,595
                                    571

                      346                                   730                   789
                107

                      Q1 20               Q1 21                   Q1 20                 Q1 21

 EBITDA
 margin               40%                 63%                      28%                  53%

10
Growth in Power Production partly offset by D&C
Proportionate financials
Comments
NOK million • Strong growth in Power Production
Revenues Q1’21 Q1’20 FY2020 after SN Power acquisition
Power Production 924 391 1,708 • Growth despite currency headwinds
Services 56 52 232 • Stable performance in Services
Development & Construction 24 414 873
• D&C revenues down with low
Corporate 6 8 33
construction activity and opex
Total 1,010 866 2,844
increased with development of
EBITDA
large project pipeline
Power Production 704 331 1,404
• Corporate cost increased moderately
Services 17 16 82
with the inclusion of SN Power
Development & Construction -60 15 -28
Corporate -25 -16 -153
Total 636 346 1,306
11Power Production
Strong increase in power production
Comments
Quarterly (NOK million) Last 12 months (NOK million) • New hydro assets adding NOK 367
EBITDA Revenues
million of EBITDA from last year
2,241
CF to equity • Strong performance on the
Philippines, EBITDA of NOK 243 million
1,777
- up NOK 117 million from last year
1,357 • Solar assets with stable EBITDA
1,143 generation year on year
924 1,003
704
• Debt refinancing on the Philippines
681
released cash of NOK 397 million to
331
391 409 Scatec
105
Q1 20 Q1 21 Q1 20 Q1 21
EBITDA
margin 84% 76% 84% 79%
12Power Production
A well diversified power plant portfolio
2020 Pro forma Power Production: Pro forma 2020 EBITDA distribution:
Rwanda Mozambique
EBITDA: Laos Czech Republic
7% South Africa
NOK 2,706 million Uganda 15%
11%
Honduras
Cash flow to Equity
Jordan
NOK 1,067 million Brazil
11%
Remaining contract Philippines
29% Malaysia
duration* 10%
18+ yrs Ukraine
Egypt
(*) Perpetual concession for the hydro assets on the Philippines.
13Services
Stable financial performance
Quarterly (NOK million) Last 12 months (NOK million)
235
EBITDA Revenues
CF to equity
191
56
52
83
73
66
60
16 17
13 14
Q1 20 Q1 21 Q1 20 Q1 21
EBITDA
margin 31% 30% 38% 35%
14Development & Construction
Increased project development efforts
Quarterly (NOK million) Last 12 months (NOK million)
EBITDA Revenues
4,097
CF to equity 483
445
414
356
13 15 24
-50
-51 -60 -102
Q1 20 Q1 21 Q1 20 Q1 21
Gross
margin 11% 1% 14% 13%
EBITDA
margin 4% NA 11% NA
15Bridging proportionate to consolidated P&L
Proportionate
Residual • Financials across operating segments – based
Ownership Elimination on Scatec’s ownership in power plants
fully of equity
Prop- consolidated consolidated Other Residual ownership
ortionate entities entities Eliminations Consolidated • Adding financials of non-controlling interest for
fully consolidated power plants (solar & wind)
External revenues 925 279 -511 - 693
Internal revenues 85 6 -3 -88 - Elimination of equity consolidated entities
Net income from JV • Deducting revenues, EBITDA and EBIT for equity
and associates - - 138 - 138 consolidated entities – and adding net income
Total revenues and from the same
other income 1,010 284 -376 -87 831 • Net income from hydro, in IFRS consolidated
financials, is reported from 29 January 2021 -
Cost of sales -103 - 79 23 -
control transferred under IFRS
Gross profit 907 284 -295 -64 831
Personnel expenses -99 -2 12 7 -82 Other eliminations
Other operating • Eliminating internal gross profit in D&C and
expenses internal revenues and related opex in Services and
-172 -50 43 60 -118
Corporate segments
EBITDA 636 232 -240 3 631 • Eliminating depreciation charges from historic
Depreciation and internal gains – mostly related to D&C
impairment -230 -78 77 44 -187
EBIT 406 153 -162 47 444
16A solid financial position
Consolidated financial position (NOK million)
• Group free cash of NOK 2,918 million As of 31.12.2020 As of 31.03.2021
• Investments in JVs and associated companies of NOK 9,750 33,553 33,553
million, increased from NOK 612 million in 2020 6,369
9,637
• Group* book equity of NOK 11,190 million 26,663 26,663
9,074 4,156
(NOK Project Group Total 9,467
Consolidated
million) level level* prop.
Cash 4,783 1,698 2,918 4,616 3,495
27,184
Debt -19,527 -11,277 -7,114 -18,392 19,760
17,590
Net debt -14,744 -9,580 -4,196 -13,776 13,701
Assets Equity & Assets Equity &
Liabilities Liabilities
(*) Defined as ‘recourse group’ in the corporate bond and Current assets Equity Non-current liabilities
loan agreements, where restricted cash is excluded. Non-current assets Current liabilities
17 17Q1’21 movement of the Group’s free cash
NOK million
14 -72 491 -3,558
-51
723 -359 -20
5,949 -199
2,918
End Q4 20 Distributions Cash flow to Cash flow to Cash flow Project equity Project Cash in Net cash Working End Q1 21
from operating equity D&C equity Services to equity Development acquired consideration Capital/other
power plants Corporate capex entities from
acquistion of
Movement of cash in ‘recourse group’ as defined in the corporate bond and loan agreements. SN Power
18Staying selective when investing
• Focus on capital discipline
• Power Production: Avg. Equity IRR on investments: 12-16%
• 30-year cash flows
• Average across technologies, regions & currencies
• Development & Construction gross margin: 10-12%
• D&C revenues expected to average 50-70% of project
capex dependent on Scatec’s role in the project
19Target of 15 GW by end 2025 representing NOK 100 billion of capex
Capital structure for 12 GW new capacity towards 2025 Scatec Equity funded by cash & operating cash flow
NOK billion NOK billion
100 15-20
60-70% leverage Cash Flow to Equity
based on long term across all segments net
60-70 contracts 10-12 of shareholder dividends
50-60% Scatec
ownership in Cash &
15-20 new assets 4.5 credit lines
15-20 1-4
Capex Project Partner Scatec Scatec Equity Cash flow Available Other
finance debt equity equity liquidity
20Scatec - 2021 Guidance
Power Production (GWh) Development & FY2021 Services FY2021 Corporate
Proportionate production volume* Construction
Q2 2021: FY 2021: End of Q1’21: Revenues EBITDA
815-865 3,500 - 3,700 Remaining, not NOK 280 million NOK -110 million
booked, construction
Up from 406 Up from 3,045 contract value EBITDA margin:
in Q2 2020 in 2020 NOK 513 million 30-35%
(*) Guidance based on production from plants in operations at the end of first quarter 2021.
21Market & outlook
Raymond Carlsen, CEO
224.5 GW by end 2021 and 15 GW by end 2025
GW – In operation and under construction – 100% basis
15
SN Power
2021
Delivery of large solar projects in
India, Brazil, Tunisia, South Africa
9.1
& Pakistan
5.9 2025
Continued growth in pipeline
2.4 and conversion of projects across
3.5 4.5
key regions and technologies
2.1
1.4 1.4
Current Growth End 2021 Growth End 2025
23Our renewables universe
Project backlog & pipeline of almost 12 GW

      Pipeline
                                                                          Europe & Central/
                                                                             South Asia
                                                                                     1,395
                  23 %                                                                MW

                                            42 %
          3%
                                                                       Africa &       Southeast Asia
               17 %                                                   Middle East
                            15 %                                                              3,812
                                                                                              MW
                                                      Latin America      5,106
         Solar                  Hybrid solutions                          MW
                                                            1,426
         Wind                   Release                      MW
         Hydro

     All figures are as of Q1 2021 reporting date..
25
Milestone for Release 8.5 MW flexible lease agreement • Lease agreement with Torex Gold for 8.5 MW solar plant for two projects in Mexico • Initial contract of 10 years • The plant can be expanded at any time, including adding battery storage • Estimated completion in fourth quarter 2021 26
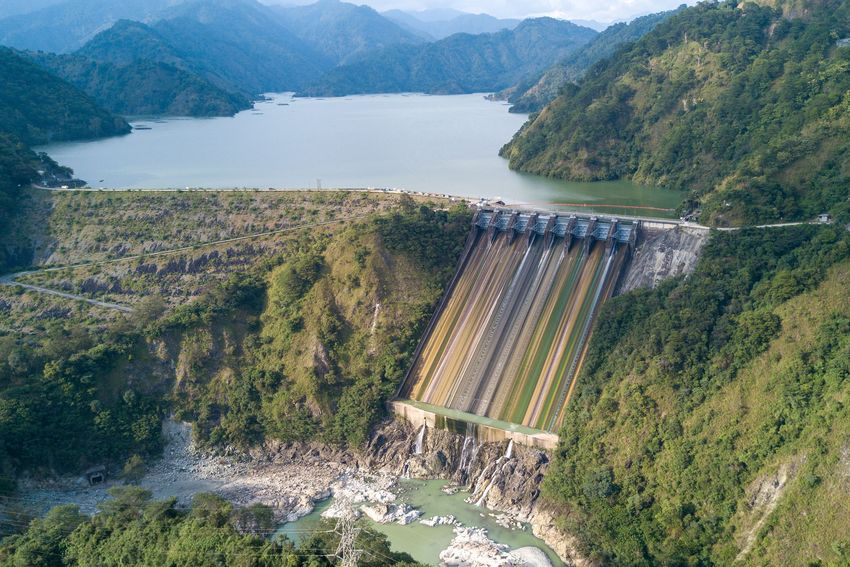
Hydropower development
 – Building on key strengths from SN Power and Scatec
                                                          Project opportunity in Africa:
 Hydro project development focus:                         Existing hydro portfolio of 260 MW
  • Brownfield projects with upgrade potential
  • Greenfield with regulation capability                   Opportunity to add 220 MW:
  • Hybridisation                                       Upgrade plant, add hydro capacity, and
                                                            add floating solar on reservoir
 Building on key strengths:
  • Hydropower competence
      •   Project development
      •   Hydropower engineering and construction
      •   Structuring and financing
      •   Market operations
     • Strong ESG focus and high HSSE standards
     • Applying Scatec’s integrated business model

27
Realising 15 GW by
end of 2025
• NOK 100 billion investments
• Proven business model
• Team with a growth track record
• Solid cash flow to fund growth
• ESG at the center
28Our asset portfolio
- 3,035 MW in operation
Under construction Capacity Economic Project backlog Capacity Economic Project pipeline Capacity Share in %
MW interest MW interest MW
Sukkur, Pakistan 150 75% Tunisia 360 100% Solar 4,686 42%
Progressovka, Ukraine 148 100% Brazil 101 40% Hydro 2,516 23%
Guanizuil IIA, Argentina 117 50% Ukraine 65 65% Wind 1,871 17%
Chigirin, Ukraine 55 100% Bangladesh 62 65% Hybrid solutions 1,726 15%
Torex Gold, Mexico 9 100% Mali 33 64% Release 300 3%
Total 479 78% Lesotho 20 48% Total 11,098 100%
Total 641 55%You can also read