COMPARISON OF THE FAST CHARGING CAPABILITY OF DIFFERENT ELECTRIC VEHICLES FROM AN USER PERSPECTIVE - P CHARGING INDEX UPDATE - P3 Group
←
→
Page content transcription
If your browser does not render page correctly, please read the page content below
P3 CHARGING INDEX - UPDATE 2021

COMPARISON OF THE FAST CHARGING
CAPABILITY OF DIFFERENT ELECTRIC
VEHICLES FROM AN USER PERSPECTIVE

EXPERTS

Christian Daake
Christian Gehring
Markus Hackmann
COMPARISON OF THE FAST CHARGING CAPABILITY OF DIF-
                                        FERENT ELECTRIC VEHICLES FROM AN USER PERSPECTIVE

                                        Currently, almost all of the long-distance electric vehicles coming to
Monday, 26th of April, 2021
                                        market are equipped with the possibility of ultra fast charging (>100 kW
Christian Daake
Lead interoperability testing           charging power). In a competitive comparison, the electric vehicles are
Christian.Daake@p3-group.com            often compared in a simplified manner, using the maximum charging
Christian Gehring                       power in kilowatts.
Senior Consultant Charging Technology

Christian.Gehring@p3-group.com

                                                The P3 Charging Index (P3CI) indicates that this value itself is not
Markus Hackmann
Managing Director E-Mobility                    quite reliable and representative to assess the realistic charging
Markus.Hackmann@p3-group.com                    performance of electric vehicles.

P3 automotive GmbH
                                        In practice, the time which is needed for users to recharge the actual
Stuttgart
Heilbronner Str. 86                     range (or kilometers) is the most important parameter for the compari-
70191 Suttgart

Tel: +49 (0) 711 25 27 49 0             son of electric vehicles. Already in the end of 2019, P3 has set a
München
Wilhelm-Wagenfeld-Straße 30
                                        benchmark with their first "P3 Charging Index", enabling a realistic com-
80807 München

Tel: +49 (0) 89 24 41 625 0             parison of the ultra fast charging performance of electric vehicles
Wolfsburg
Schlosserstraße 8
                                        based on the actual customer use.
38440 Wolfsburg

Tel: +49 (0) 536 18 34 19 0

                                        Compared to the first edition, the update of the P3 Charging Index has
mail@p3-group.com
www.p3-group.com                        been optimized based on the developments of the electric vehicle
                                        market and the reader’s feedback. Particularly, the expansion of the
                                        charging window should be emphasized, due to increased battery capa-
                                        cities, especially for long-distance electric vehicles. As a result, the SoC
                                        window1 has been extended to 10 – 80 percent. The evaluation of the
                                        long-distance suitability will be conducted with the addition of the most
                                        important criteria of the battery, the SoC after 20 minutes. Some of the
                                        vehicle’s charging curves have additionally been re-evaluated and
                                        updated within the P3CI, e.g., Tesla Model 3, VW ID.3 and the Porsche
                                        Taycan.

                                        1
                                            SoC = State of Charge

                                                                                                                       1
CHARGING POWER IS NOT A SUFFICIENT INDICATOR FOR THE CHARGING PERFOR-
MANCE OF ELECTRIC VEHICLES

The maximum charging power (in kilowatts) of electric vehicles can only be reached under ideal conditions
and requires, ideal temperature (~20°) and a relatively low battery SoC. Taking this into account, many
reports, comparisons, and reviews specify the average charging power within a predefined charging
window.

Whereas the first edition of the P3CI replicated this ideal charging window, the updated version has set the
lower limit to a minimum value of ten percent resulting in a range reaching from 10 to 80 percent. The reduc-
tion of the lower limit of the SoC is beneficial for both, the technological development of the vehicles and
©FERNRIDE
the expansion of the fast charging infrastructure. This enables additional potential for long-distance journeys
of the customers and ensures that a lower residual range will remain when arriving at the charging station.

COMPARISON OF MAXIMUM AND AVERAGE CHARGING POWER OF ELECTRIC
VEHICLES [KW]

A comparison of the charging power of different vehicles shows that the maximum charging power for each
vehicle can only be reached for a few minutes during the charging process. Hereby, the vehicle-specific
performance varies significantly.
The consideration of the avera-
ge charging power within the
charging window of 10 – 80 %
SoC is more representative for
the comparison of different
charging performances of the
EVs. This is supported by the
direct comparison of the follo-
wing selected vehicles:

                                                                                       Source: ©P3 automotive GmbH

                                                                                                                     2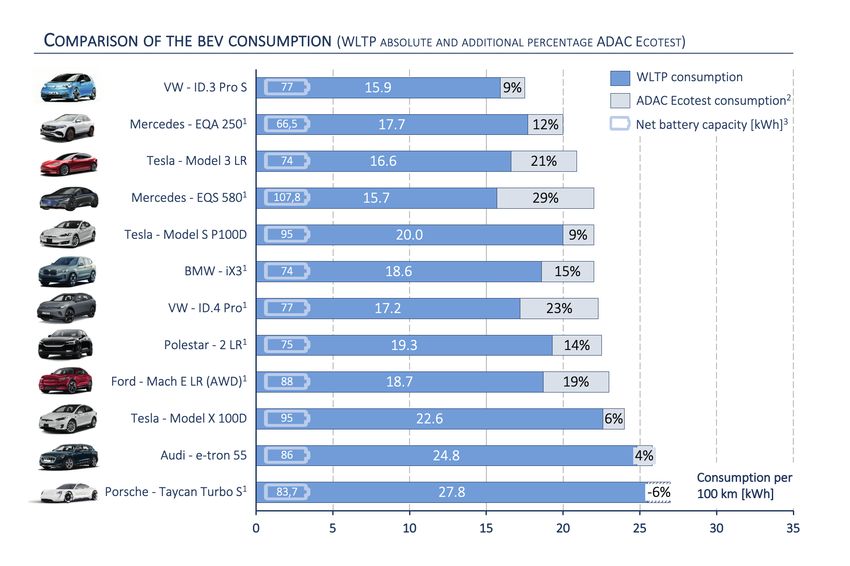
The Porsche Taycan Turbo S with a maximum charging power of 270 kW
(manufacturer specification) achieves an average charging power of 184
kW within the selected charging window and is still clearly ahead of
other electric vehicles.

Unlike the Porsche Taycan, the Mercedes-Benz EQS is not based on an
800 V architecture. However, a peak power of more than 200 kW and an
average value of 164 kW can be enabled due to its high battery capacity.

The maximum charging power of the Audi e-tron is significantly lower,
but can be kept at a constant average level of 146 kW during the whole
charging period.

The Tesla Model 3 on the other hand, is stated by the manufacturer to
reach a maximum charging power of about 250 kW at a Supercharger
version 3. Realistically, it only achieves an average charging power of 146
kW, because the drop of the charging curve within the test field is grea-
ter compared to other vehicles.

The top 12 of the vehicles which have been evaluated, demonstrate an
average charging power of >100 kW between 10-80 % SoC, whereas
the top 4 show a clear advantage with an average of >146 kW compared
to others.

                                                                              3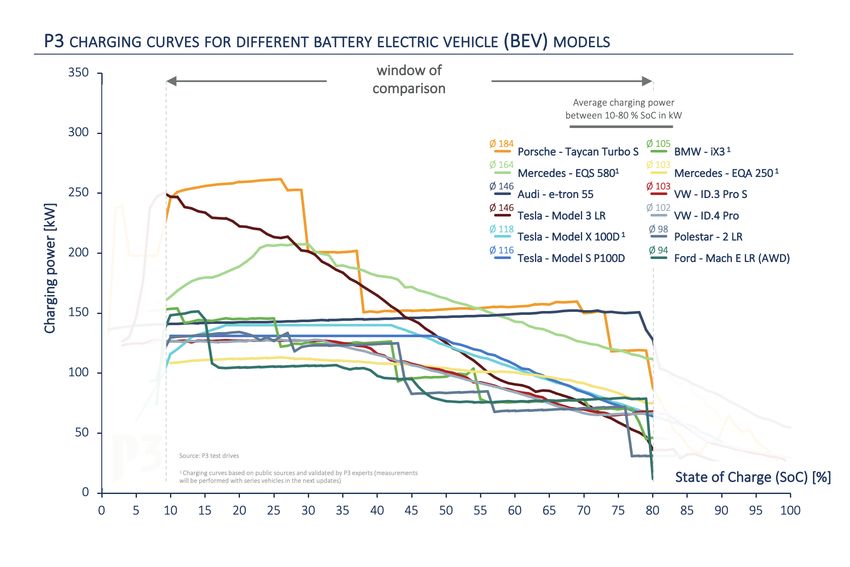
FROM A CUSTOMER'S PERSPECTIVE, CONSUMPTION AND CHARGING TIME MUST
ALSO BE CONSIDERED IN THE EVALUATION

However, the customer's perspective differs, because a typical, real charging process of an EV driver is
essentially oriented by two main questions:

      What range is needed to reach the next destination?
      How long does it take to recharge this range?

The second question introduces an additional important parameter which barely has been considered in
previous comparisons: The real consumption of an electric vehicle, which has direct influence on the rechar-
ged range. The recharged energy for a certain distance is directly influenced by the consumption of the
vehicle. The additional consideration of the consumption enables even more realistic and user-oriented
comparisons.

CONSUMPTION VALUES OF THE VEHICLES ACCORDING TO WLTP AND ADAC ECOTEST
[KWH/100KM]

In order to assure realistic consumptions of the individual electric vehicle in the calculation of the P3 Charging
Index, the ADAC Ecotest consumptions have been included in addition to the respective WLTP values. Further-
more, the battery capacity [in kWh] has been integrated into the analysis in order to determine not only the
consumption, but also the available
energy    content. The     consumption
together with the charging curves of
the vehicles will enable to illustrate the
recharged kilometers over the required
charging time. This already provides a
more specific evaluation of the char-
ging behavior of the electric vehicles,
but is not sufficient yet to standardize
the direct comparison.

                                                                                          Source: ©P3 automotive GmbH

                                                                                                                        4
THE P3 CHARGING INDEX CREATES A STANDARDIZED BASELINE FOR COMPARISON
Therefore, the P3 Charging Index implements a standardization for the comparison of electric vehicles. The
P3CI is the ratio of the real recharged range within 20 minutes and the target value of 300 km. The index
defines the charging speed of the vehicles and leads to a significant higher level of comparability and trans-
parency with regards to the actual suitability of electric mobility for daily long-distance journeys.
Real recharged range within 20 minutes2
P3 CHARGING INDEX =
300 km
The combination and the subsequent standardization of the charging behavior with the realistic consumption
of the vehicles, leads to comparable resulting values. The following index shall qualify and equally represent
the suitability of a long-distance journey with an electric vehicle.
If a P3CI value of 1.0 can be achieved, this vehicle would be able to realistically recharge a driving distance of
300 km in just 20 minutes. In practice, this vehicle could drive up to 600 km with only one charging stop of
20 minutes (in the beginning of the journey, the battery must almost be fully charged). Furthermore, this form
of standardization is quite user-oriented, because a short break is recommended anyway every 250-300 km.
2
Charging process starting at 10% SoC
Source: Manufacturer press photos
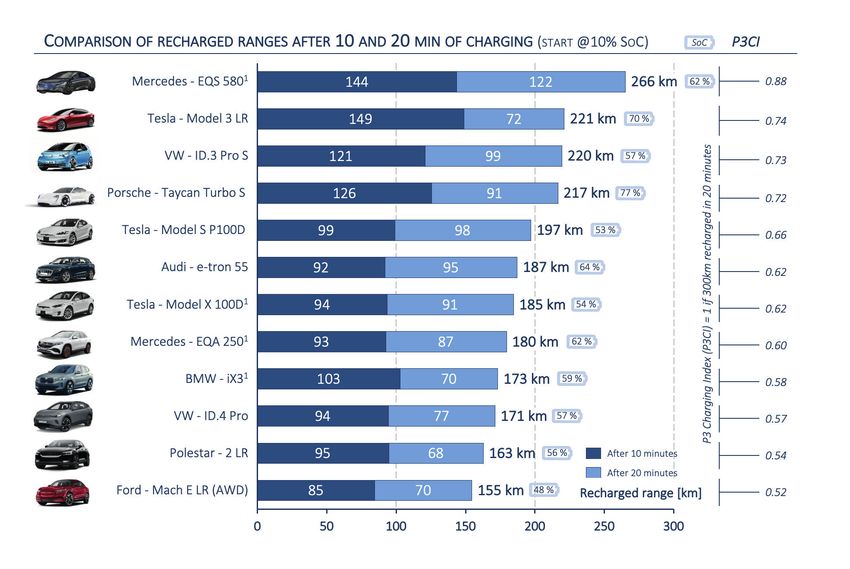
5CONSIDERATION OF THE RECHARGED DISTANCES (KM) WITHIN THE
P3 CHARGING INDEX
Currently, none of the electric vehicles available on the market are able to achieve an ideal value of 1.0. At
least the top 4 vehicles can already reach high values of 0.72-0.88 compared to the maximum long-distance
goal. In the previous report, the Porsche Taycan was with 216 km and an 800 V architecture the fastest char-
ged vehicle within 20 minutes. In the current update, the Mercedes-Benz EQS shows an increase of 50 km
up to 266 km within 20 minutes, realized by a 400 V architecture. This is also reflected in the values of the
P3CI, in which the EQS is with 0.88 well ahead of the Tesla Model 3 (0.74) and also has significantly increa-
sed compared to the first edition of the P3CI (Porsche Taycan with 0.72).
New vehicles, such as the Hyundai IONIQ 5, KIA EV 6 or the Audi e-tron GT on 800 V architecture, are very
promising candidates to be placed under the top 5 of the P3 Charging Index ranking. Corresponding measu-
rements will be performed by P3 and included in the P3CI, as soon as the vehicles are available. The rechar-
ged values after 10 minutes of charging are depicted as well, to ensure full transparency in the report. Taking
this value into account after ten minutes of charging, the Tesla Model 3 Long Range would be ahead with 149
km, even before the Mercedes-Benz EQS in this category.
Source: ©P3 automotive GmbH
3
Manufacturer's data partly incomplete, therefore supplemented by expert estimates
Source: Manufacturer press photos
6CONCLUSION
In the second edition, the P3 Charging Index enables again the comparison of a real and user-oriented char-
ging performance of electric vehicles. The Index includes both, the maximum and average charging power
of the vehicles, in combination with the overall efficiency, which is then standardized to a practical and reali-
stic use case. Surprisingly, the Mercedes-Benz EQS - with 400 V architecture – reaches the best P3CI even
ahead of the Tesla Model 3 and the Porsche Taycan.
Future vehicles based on an 800 V architecture are expected with great curiosity and will then, most likely,
be found in the top group of the P3CI ranking.
The focus must be on a balanced ratio between charging power and efficiency of the vehicles because both
parameters specify the charging experience of the customer! The feedback of the community and the
readers will continue to be considered with top priority in the future development to get the most out of the
P3CI and to ensure the best user-oriented comparability of the individual electric vehicles. Current vehicle
updates and new releases will be added to the P3 Charging Index step-by-step. This of course, is always
related to the vehicle and update availability at the time of testing, so that deviations may occur due to the
time differences. Nevertheless, these changes will be highlighted in the upcoming releases.
As an outlook, P3 will also take into account the large number of new electric vehicles on the market. There-
fore, the vehicles will be clustered according to their specific vehicle segments to further optimize the com-
parison.
Christian Gehring Markus Hackmann Christian Daake
Senior Consultant Charging Technology Managing Director E-Mobility Lead Interoperability Testing
Markus.Hackmann@p3-group.com Christian.Daake@p3-group.com
+49 151 195 690 44
7APPENDIX ser vergleichen zu können.
Only comparing different charging curves with average charging powers leads to an incomplete picture.
Taking consumption into account provides a more meaningful charging performance indicator.
Key Findings
The P3 Charging Index compares the charging Tesla Model 3 demonstrates constant impro-
performance of different BEVs in the 10-80% vements via updates on both the vehicle as well
SOC window. as the superchargers. A peak charging power of
~250 kW is possible.
Based on 800 V powertrain architecture, the
Porsche Taycan is able to charge with a peak Compared to the other vehicles, the Audi e-tron
power of 270 kW. The Taycan achieves highest maintains the charging power consistently high
average charging power at 184 kW. (~150 kW) within the given charging window
(10-80% SoC).
The new Mercedes EQS with it`s 400 V power-
train topology (market standard) is able to draw The charging curves of further listed vehicles are
~164 kW on average across the full charging relatively comparable in terms of maximum power
cycle. as well as derating behavior.APPENDIX ser vergleichen zu können.
1
Consumption based on
public sources and
validated with P3 experts
(updates according to
ADAC Ecotest with series
vehicles in next versions)
2
Standardized test cycle
with realistic consumpti-
on value (ADAC Ecotest) -
additional consumption
shown compared to
WLTP
3
According to publicly
available sources
For a complete picture, the efficiency in terms of vehicle consumption needs to be considered in addition to the
charging capacity. The consumption values show strong deviations and have significant influence on performance.
Key Findings
The real consumption of the vehicles serves as In contrast to the WLTP cycle measurements, the
baseline for the determination of the actual vehicles normally show higher energy consump-
recharged range during the charging process. tions in real operation than it is stated in the WLTP
consumption results. The only exception is the
The top group of highly efficient BEVs show a Porsche Taycan which has an advantageous
consumption below 21 kWh/100 km. efficiency, especially at higher speeds.
Average consumption for the majority of BEVs is Outlook: the next updates of the P3 charging
between 21 to 23 kWh/100 km. index will provide a comparison by cluster along
specific vehicle segments.APPENDIX ser vergleichen zu können.
P3 Charging Index (based
on ADAC Ecotest)
1
Charging curves based
on public sources and
validated with P3 experts
(measurements will be
carried out with series
vehicles in next versions)
2
Feedback taken into
account and bigger
batteries allow more
flexibility
3
Beginning of February
2021
The P3 Charging Index update provides the comparison of new BEVs and improved methodology based on previous
learning effects. Promising performance is demonstrated especially by new vehicles entering the market.
Key Findings
In general, BEVs have improved quite a lot. Com- The vehicles VW ID.3, Porsche Taycan and the
pared to the last evaluation, an improvement of 16 Tesla Model 3, S and X have been updated with
% can be observed, getting closer to the target the latest available software releases, resulting in
value of 1. This means, that the end customers an improved charging performance compared to
can recharge 300 km within 20 minutes. the last publication.
The Mercedes EQS is currently the benchmark. Hyundai IONIQ 5 not included yet due to data
Nevertheless, the largest battery capacity of availability. Announced specifications indicate
107.8 kWh is a major advantage for the P3CI. potential for top ranking.
BEVs with a P3CI lower than 0.5 are not listed in
this overview. Use case “convenient long-distan-
ce trips” not possible without major efforts.You can also read