Company Presentation September 2017 - Terna Energy
←
→
Page content transcription
If your browser does not render page correctly, please read the page content below

Company Presentation September 2017
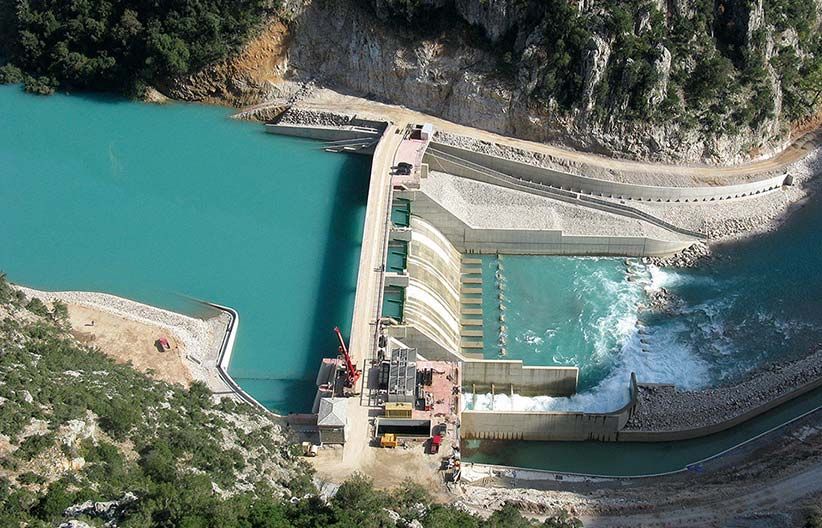
Table of Contents

              Section 1: Company and Asset Overview

              Section 2: Highlights

              Section 3: Financial Performance

                                                      2
1. Company and Asset Overview

Terna Energy Company Overview
                                                                                                           14%
•        Largest Greek renewable company

•        786 MW of installed capacity(1)                                                      40%      Terna               25%
                                                                           GEK Terna                                                  G. Peristeris
                                                                          Parent Holding             Energy S.A.                        Chairman
•        194MW under construction or ready to build capacity

•        Geographic diversification with 35.9% of sales in Eastern                                                          Energy
                                                                                    Renewables
                                                                                                                          Construction
         Europe and US

•        Strong financial profile with 2016 revenues of €225.6 MM          Poland      Bulgaria     USA          Greece
         and EBITDA of €115.8 MM
                                                                           Wind            Wind     Wind         Wind         Solar         Hydro
•        Market capitalization: €448 MM as of 12 September 2017
Key Financials                                                            Sales by Geography and by Business Unit
                                                                          FY 2016
                                                                CAGR
€ MM                  2012A   2013A   2014A   2015A   2016A
                                                              ‘12 – ‘16   By Geography                             By Business Unit          Concessions
                                                                                    USA                                                      e‐ticket
Revenue               124.0   139.6   158.2   198.6   225.6   16.1%                                               Electric Energy
                                                                                    (11.7%)                                                  (5.6%)
Revenue                                                                                                           Trading
                      63%     12.9%   13.0    25.5%   13.6%                                                       (14.0%)
Growth                                                                    Eastern
EBITDA                53.0    69.9    74.0    99.3    115.8   21.6%       Europe
                                                                          (24.2%)                                                                   Energy
                                                                                                            Construction
EBITDA Growth         60.6%   32.1%   5.7%    34.2%   16.6%                                                                                         from
                                                                                                            (13.4%)
                                                                                                                                                    RES
EBITDA Margin         42.7%   50.1%   46.8%   50.0%   51.3%                                         Greece                                          67.0%
                                                                                                    (64.1%)

Notes:
1. As of March 2017

                                                                                                                                                             4
Asset Portfolio Overview
44 Projects Assets in Operation
Didimos Lofos Energy Type Capacity (MW) Ownership COD PPA Life Left (Y)
Greece 362
Greece Mitoula
Chonos
Chylos
5
12
100%
100%
2006
H1 2014
16.1
16.5
Hilos Didimos Lofos 26 100% 2005 15.0
Eleousa Derveni 24 2014 17.5
Derveni-Mikro Gouri 32 100% H1 2014 17.0
Lefkes Kerasia W/F Eressou Ipsoma Fourka Derveni-Sliva Krekeza 30 100% 2011 21.4
Xirovouni Loggarakia 18 100% H1 2014 17.1
Louzes 24 100% 2008 18.2
Mavrovouni 20 100% 2011 21.2
Mavrovouni (2) 8 2015 17.9
Kastri- Kokkalia Mavroplagia - Kastro 17.2 2017 19.5
Dafnozonara
Mitoula 34 100% 2006 16.0
Karavi- Alogovouni
Mougoulios 16.5 2017 19.9
Perdikokoryfi 14 100% 2006 15.9
Timpano - Tripiri Psiloma Soros Plagia - Psiloma 14.9 2017 19.9
Servouni - Vorina Litharia Pyrgari 5 100% 2001 4.1
Louzes Skopia Pyrgari Rahoula Pashalies (I+II) 38 100% 2011 (I) / July 2014 (II) 21.4 / 17.1
Gouri Tsouka Tsougari Skopia 20 100% 2010 20.3
Profitis Elias Stavroti Vigla 18 100% H1 2014 16.5
Vathihori II Tsilikoka
Mavrovouni St. George Project 73.2 2016 19.2
Servouni - Kalogeriki Rachi
Tsikna - Profitis Elias 11 100% 2001 3.8
Loggarakia Tsilikoka 10 100% 2000 3.0
Rahoula Pashalies (I + II) Tsouka 12 100% 2000 3.0
Xirovouni 6 100% H1 2014 16.5
Krekeza Dafnozonara 11 100% 2011 21.0
Eleousa 7 51% 2008 18.5
St. George Island Louzes 1 100% 2013 22.1
Vathihori 6 100% 2011 21.4
Stavroti Vigla Vathihori II 2 80% 2013 22.5
Adendro 1 2016 18.7
USA 138
Perdikokoryfi Mountain Air, Idaho 138 100% 2012 22.5
Chonos
Poland 30
Chelmza 4 2015 18.5
Chojnice 6 2015 18.5
Czarnozyly 16 100% 2012 14.5
Gorzkowice 12 100% 2011 13.9
Poland Bulgaria USA Krzyzanow 20 100% 2011 13.6
Makow 12 2014 17.4
Nasielsk 10 100% 2012 22.3
Sieradz 8 100% 2013 15.6
Szadek 8 100% 2012 21.8
Tuchola 6 2015 18.5
Bulgaria
Karapelit 12 100% 2012 15.1
Legends Vranino 18 100% 2013 15.8
Wind Energy Solar Energy Hydroelectric Projects Total Portfolio: 604
5
Terna Energy Market Positioning

        1             The Leading Greek Renewable Company in attractive market

        2          Attractive Core Asset Portfolio with Complementary Diversification

        3                    Strong Operational and Technical Excellence

        4     A Stabilized Renewable Regulatory Framework in a Recovering Greek Economy

        5                    An Attractive and Value Creating Growth Story

        6       Rapid Deleveraging from EBITDA Growth and High Cash Flow Conversion

        7              A Proven Experienced, and Professional Management Team

                                                                                          6
2. Highlights
Terna Energy Market Positioning
 1                             The Leading Greek Renewable Company in attractive market

 The Leading renewable energy provider                                     Terna Energy Historical Load Factors
             •        786 MW globally, of which 759 MW in wind

             •        516 MW in Greece (#1 market share)                          26‐30%
                                                                                                           24%
             •        As the first mover in wind energy, Terna Energy
                      secured the best wind load locations for its farms

             •        Allocation on a first come first serve basis

 Best‐in‐class load factor
             •        Stands at 30.2%(1)

             •        Substantially higher than a number of other
                      European wind markets
                                                                                   Terna             European Wind
                                                                                                         Market

Notes:
1. As of March 2017

                                                                                                                     8
Terna Energy Market Positioning (cont’d)
2 Attractive Core Asset Portfolio with Complementary Diversification
• Asset portfolio well diversified geographically Portfolio Installed Capacity (1)
By Country By Type
Greece: 516 MW, 31 locations SHPS & Pump Storage P/V
Bulgaria USA
(18 MW, 2.3%) (9 MW, 1.1%)
USA: 138 MW, 1 location (30 MW, 3.8%) (138 MW, 17.6%)
Biomass &
Poland: 102 MW, 10 locations Co‐generation
(1 MW, 0.1%)
Bulgaria: 30 MW, 2 locations
Poland Greece
(102 MW, 13.0%) (516 MW, 65.6%)
Wind
Total: 786 (759 MW, 96.5%)
MW
Portfolio Expected Capacity (2)
By Country By Type
• Pipeline: Strategic focus on wind in Greece and USA as USA
SHPS & Pump Storage P/V
(18 MW, 1.5%) (9 MW, 0.7%)
core market due to advantageous market dynamics (427 MW, 34.3%)
Greece Biomass &
(684 MW, Co‐generation
• Hydro and solar assets built on an opportunistic basis 55.0%) (4 MW, 0.3%)
• New long term target to reach 2.000 MW
Bulgaria
(30 MW, 2.4%) Wind
Poland (1211 MW, 97.6%)
(102 MW, 8.2%)
Total: 1.242 MW
Notes:
1. As of March 2017
2. Total estimated MW Q1 2019
9Terna Energy Market Positioning (cont’d)
3 Strong Operational and Technical Excellence
• Founder and shareholder, as well as key senior managers have civil
Skilled Engineering and mechanical engineering backgrounds
Team
• Large technical team of over 80 engineers
• Very strong operational and technical capabilities given backbone of
the construction focused parent GEK Terna
Construction Synergies • In‐house construction of projects
• Track record of projects completed on time and on budget
• Maintenance agreements with the turbine manufactures working
with Terna Energy’s engineering teams ensures transfer of valuable
Maintenance & know‐how to the company
Insurance Coverage • Full insurance coverage both for damages and revenue loss
• Turbines come with 5‐year guarantees; expected life of c.25 years
10Terna Energy Market Positioning (cont’d)
4 A Stabilized Renewable Regulatory Framework in a Recovering Greek Economy
Government remains committed to its RES target By resolving the RES deficit, the new regime
for 2020 offers a stable framework for the long term
GW 5.4 GW Remaining € MM
7,5
Target Reached
(84,3) (116,8)
2,2 2,2 2,1 (152,6)
(241,7)
Solar Realised Wind Realised
PV… Solar PV…(2) Target Wind…(2) (576,1)
2013 2014 2015 2016 Q1 2017
The Greek economy is recovering
Greece Real GDP Growth (1)
% 2,7
2,2 2,2
0,0
(0,2)
2015A 2016A 2017E 2018E 2019E
Notes:
1. IMF Forecasts World Economic Outlook, April 2017
2. As of June 2017 11Terna Energy Market Positioning (cont’d)
5 An Attractive and Value Creating Growth Story
• Terna Energy has delivered strong growth Terna Energy has Delivered Growth Successfully
historically. For the 2014–2016 period, the
MW
Company has: 1.242
1. Increased its installed capacity at a CAGR of 1.119
7.4%, from 640 MW to 738 MW
937 427
2. Grown capacity in Greece at a CAGR of 427
>20% from 161 MW to 362 MW 738 288
640 664 132
3. Invested over €286 MM in Capex 138
544 138 132
4. Delivered projects on budget and on time 508 138 132
132
138 138 116 132
• Going forward, the Company has a strong and
credible growth plan 104 104 684
517 561
394 468
• Aim under the 7‐year plan to reach 386
266 302
2,000 MW
• Proceeds from the bond will partially be used 2012A 2013A 2014A 2015A 2016A 2017E 2018E 2019E
to fund construction of new projects, alongside
project specific financing Greece Eastern Europe USA
12Terna Energy Market Positioning (cont’d)
6 An Attractive and Value Creating Growth Story
Priority pipeline
€MM, unless otherwise stated
Project Finance
Capacity Project Cost Cash Grant Equity / Cash
Project Type Debt COD Priority
(MW) € MM € MM € MM
€ MM
UNDER CONSTRUCTION 194 MW
Vermio project Wind 44 MW 59 ‐ 39 20 H1‐2018 High
Fluvanna 1 (USA) Wind 150 MW 232 ‐ 196 36 H2‐2017 High
PRE‐CONSTRUCTION PROJECTS 161.5 MW
Fluvanna 2 (USA) Wind 160 MW 237 ‐ 200 37 H2‐2018 High
Epirus Waste
Waste 1.5 MW 42 20 15 7 2019 High
Management
PRE‐LICENSED
121.4 MW
PROJECTS
Peloponnese Waste
Waste 2.4 MW 122 64 35 23 2019 High
Management
Evoia SPA Wind 100 MW 140 ‐ 91 49 2019 Medium
Servouni Wind 19 MW 20 ‐ 13 7 2019 Medium
TOTAL HIGH PRIORITY 358 MW 692 84 485 123
High priority pipeline projects
13Terna Energy Market Positioning (cont’d)
7 Rapid Deleveraging from EBITDA Growth and High Cash Flow Conversion
Steady 25% EBITDA CAGR Strong Growth in Realized EBITDA
€ MM
• Long term visibility on volume off takes
• Contracted prices 116
99
• Track record of project developments 74
70
53
2012A 2013A 2014A 2015A 2016A
EBITDA
Cash Flow Conversion
Outstanding cash flow conversion (1)
€ MM
• No maintenance capex
59% 63% 80% 105% 100%
• Despite crisis delays in payments have
103,8 116,2
remained steady in the last years
59,2
• Rapid deleveraging on a like‐for‐like basis 31,0 44,0
2012A 2013A 2014A 2015A 2016A
Operating Cash… Cash Flow Conversion
Notes:
1. Cash Flow Conversion = Operating Cash Flow / EBITDA
2. Operating Cash Flow after Working Capital Changes
143. Financial Performance
Strong Financial Performance
Run‐rate EBITDA increases with capacity

Installed Capacity and Revenue                      EBITDA and EBITDA Margin
 €MM                                                €MM
  508      543          640       664        738    43%      50%       47%           50%    51%
                                             226

                                   199

                        158
              140
                                                                                            116
  124
                                                                                     99

                                                              70         74
                                                     53

 2012A    2013A        2014A     2015A      2016A   2012A    2013A     2014A     2015A     2016A
    Revenue         MW Installed Capacity           EBITDA     %     EBITDA Margin

                                                                                                   16
Segmental Performance
Wind
Installed Capacity Key project Commissioned in 2016
MW
Project COD Installed Capacity
St. George 2016 69 MW
Mavroplagia –
1.242 Kastro H1 – 2017 17 MW
1.119
Mougoulios H1 – 2017 17 MW
937 Plagia – Psiloma H1 ‐ 2017 15 MW
738
640 664
508 543 Projects Under Construction
Project COD Volume
Vermio project H1‐2018 44 MW
Fluvanna 1 (USA) H2‐2017 150 MW
2012A 2013A 2014A 2015A 2016A 2017E 2018E 2019E
Included in LTM installed capacity of 604 MW
Installed Capacity Installed capacity incremental to the 604 MW
17Capital Expenditure
Historical Capital Expenditure Typical Funding Structure
€MM
Subsidised
Equity/Group
217,0 Cash
25%–30%
150,7 Project Debt
45%–50%
79,7
47,0 56,4
Government
Grants
25%–30%
2012A 2013A 2014A 2015A 2016A
Non‐Subsidised
• 14 new projects built since 2014, adding 244
Equity/Group
MW of capacity Cash
Project c.30%
• No maintenance capex Debt
c.70%
• Maintenance costs accounted for as
operating expenses on the Income
Statement Projects without grants benefit from higher contracted
tariffs, allowing to raise more project debt and to de‐lever
• All capex is for expansion
faster
18Q1 2017 Performance Update
Key drivers Revenues
MW €MM
33% 32% +10%
786 • Continued increase in capacity (+18% y‐o‐y)
664 55,5
50,4
• Lower load factor
Q1 2016 Q1 2017 Q1 2016 Q1 2017 Energy results negatively impacted by weather conditions,
Installed Capacity Installed Capacity in Q1 in particular
% Load Factor
EBITDA and EBITDA Margin
€MM
Renewables Construction • Outstanding performance in both renewables and
77% 74% 16% 22% construction segments
30,0
34,1 Extraordinary levels of EBITDA margins in the renewables
segment with 74% for the first quarter of 2017
1,4 Construction EBITDA more than doubled in Q1 2017 vis‐à‐
0,6
vis Q1 2016
Q1 16 Q1 17 Q1 16 Q1 17
EBITDA % EBITDA Margin
19Disclaimer
We have prepared this document solely for informational purposes. You should not definitively rely upon it or use it to form the definitive basis for any decision, contract, commitment or action whatsoever, with respect to any
proposed transaction or otherwise. You and your directors, officers, employees, agents and affiliates must hold this document and any oral information provided in connection with this document in strict confidence and may
not communicate, reproduce, distribute or disclose it to any other person, or refer to it publicly, in whole or in part at any time except with our prior written consent. If you are not the intended recipient of this document, please
delete and destroy all copies immediately.
We have prepared this document and the analyses contained in it based, in part, on certain assumptions and information obtained by the directors, officers, employees, agents, affiliates and/or from other sources. We and our
affiliates and our and their respective officers, employees and agents expressly disclaim any and all liability which may be based on this document and any errors therein or omissions therefrom. Neither we nor any of our
affiliates, or our or their respective officers, employees or agents, make any representation or warranty, express or implied, that any transaction has been or may be effected on the terms or in the manner stated in this
document, or as to the achievement or reasonableness of future projections, management targets, estimates, prospects or returns, if any. Any views or terms contained herein are preliminary only, and are based on financial,
economic, market and other conditions prevailing as of the date of this document and are therefore subject to change. We undertake no obligation or responsibility to update any of the information contained in this document.
Past performance does not guarantee or predict future performance.
This document and the information contained herein do not constitute an offer to sell or the solicitation of an offer to buy any security, commodity or instrument or related derivative, nor do they constitute an offer or
commitment to lend, syndicate or arrange a financing, underwrite or purchase or act as an agent or advisor or in any other capacity with respect to any transaction, or commit capital, or to participate in any trading strategies,
and do not constitute legal, regulatory, accounting or tax advice to the recipient. We recommend that the recipient seek independent third party legal, regulatory, accounting and tax advice regarding the contents of this
document. This document does not constitute and should not be considered as any form of financial opinion or recommendation by us or any of our affiliates.
Notwithstanding anything herein to the contrary, each recipient hereof (and their employees, representatives, and other agents) may disclose to any and all persons, without limitation of any kind from the commencement of
discussions, the U.S. federal and state income tax treatment and tax structure of the proposed transaction and all materials of any kind (including opinions or other tax analyses) that are provided relating to the tax treatment
and tax structure. For this purpose, "tax structure" is limited to facts relevant to the U.S. federal and state income tax treatment of the proposed transaction and does not include information relating to the identity of the
parties, their affiliates, agents or advisors.
This document is provided by Terna Energy ABETE, you must contact Terna Energy ABETE regarding this document or any of the information contained herein.
20You can also read