How can the 2030 Energy & Climate Package Foster Competitiveness? - Keynote Sandrine Dixson-Declève

Page created by Nathan Joseph
 
CONTINUE READING
How can the 2030 Energy & Climate Package Foster Competitiveness? - Keynote Sandrine Dixson-Declève
How can the 2030 Energy & Climate Package Foster
                               Competitiveness?
                        Keynote Sandrine Dixson-Declève

                           Sandrine Dixson-Declève, Executive Director
                        Director EUCLG & CPSL EU Office - 0032(0)2 89 49 320
                                            Sandrine.dixson@cisl.cam.ac.uk
How can the 2030 Energy & Climate Package Foster Competitiveness? - Keynote Sandrine Dixson-Declève
CLIMATE                       NATURAL                        FINANCE
                                    CAPITAL
                        (EU CLG Secretariat and Business Leaders)

Enabling the transition to   Staying within the limits of the   Designing a financial system
 a low carbon economy           Earth’s natural systems          that values the long term

                   Learning - Leadership - Change
                Enabling business leaders to be heard
       Setting new standards of responsible business practice
                   Demonstrating what is possible
How can the 2030 Energy & Climate Package Foster Competitiveness? - Keynote Sandrine Dixson-Declève
EU Green Growth Platform Advisory Board
                  Steering Commitee
                   (EU CLG Secretariat and Business Leaders)

                                   Business                                         MEP Green
 Ministerial                                                                       Growth Group
Green Growth                 Green Growth Group
                                                                                   (to be formed after
   Group                    (30- 50 Companies - 15                                 May 2014 elections)
 (15 Ministers)                  active CEOs)                                           (15 MEPs)

                                                        Advisory
                        Advisory                        Council II
                        Council I                    Sectoral Deep Dives &
                  Economics of Jobs, Growth         Related Issues: Energy
                     & Competitiveness             Intensive Sectors, Power,
                      Co-Chairs: Alex Bowen,                EE, etc.
                   Grantham Institute & Laurence     Chair: Philippe Joubert, EU
                          Tubiana, IDDRI           CLG/WBCSD/WEC + Consultant
                                                       Tomas Wynns, VUB
PREMISE: EU GDP and Emissions have Decoupled

             160

             150
                                                                                                                                                                                2011 GDP: +48%
                                                                                                                                                                                vs 1990
             140

             130

             120
1990 = 100

             110

             100

              90
                                                                                                                                                                                 2011 Emissions:
              80                                                                                                                                                                 -18% vs 1990

              70

              60
                     1990

                            1991

                                   1992

                                          1993

                                                 1994

                                                        1995

                                                                1996

                                                                       1997

                                                                              1998

                                                                                     1999

                                                                                            2000

                                                                                                   2001

                                                                                                          2002

                                                                                                                 2003

                                                                                                                        2004

                                                                                                                               2005

                                                                                                                                      2006

                                                                                                                                             2007

                                                                                                                                                    2008

                                                                                                                                                           2009

                                                                                                                                                                  2010

                                                                                                                                                                         2011
                                                               EU 27 Emissions                                      EU 27 GDP

                   Source: EEA 2013
2030 PACKAGE REFLECTIONS: Platform Advisory Council I
•   Europe’s high energy prices is being directed at its ambitions on climate change, while the
    main factor – the high cost of imported energy – is ignored
•   Long-term policy stability and short-term policy clarity needed for industry and investors
    to invest in the wider EU economy
•   Two track approach: protect short-term competitiveness while ensuring long term
    growth (broad innovation: process, product, business model, social and policy)
•   Joined-up EU industrial, climate and energy strategy
•   Supportive industrial framework for all sectors to offset productivity gap
•   Further unemployment not an option in existing manufacturing base and new sectors
•   Reform EUETS incl. de couple ETS sectors e.g. between industry and power
•   Maximise GHG reductions from ETS/non ETS sectors e.g. EE in buildings & Transport
•   Maximise potential for new products and technologies
•   Maintain the current carbon leakage list until 2020
•   Extension and re-design of current NER-300 mechanisms EU-wide industry Innovation
    Fund (focus on breakthrough technology, demonstration, scalability)
•   Support for at least domestic 40% GHG target as most cost effective
IEA’s World Energy Outlook (2013) highlights:
•   Even if CO2 prices rose to €20/tonne they would still only represent a few percentage
    points of average industrial electricity prices.
•   Economically counter-productive to avoid early/ambitious low carbon action
•   Every year of delayed mitigation action adds $500 billion to the global low carbon
    energy investment bill between 2010 and 2030.
•   Every $1 of low carbon investment avoided today means $4.30 of low carbon
    investments needed after 2020 to meet the 2°C goal.
•   Delaying further action until after 2020 could require an extra $5 trillion of
    investments from 2020-2035 across the economy.

    Eurolectric Conclusions (2013):
•   Delaying de-carbonisation of power sector leads to dramatic dash to catch up later
    causing bottlenecks in equipment supply, price effects due to overheated demand, and
    stranded assets because of exaggerated investments in redundant capacity.
•   A “crawl today, sprint later” approach to energy de-carbonisation will cost an extra €5.5
    billion in additional costs by 2050.
EU Risks losing low carbon market leadership
•         Global low carbon and environmental business market = €4 trillion a year, expected to grow to €5
          trillion by 2016 (Low carbon energy market alone predicted growth $2.2 trillion)
•         EU = 22% share worth over €900 billion p/a + 35% of global low carbon patents + 7.8 million
          employed in 1 million companies
•         EU competitors invested
EU-27 Most Energy Efficient Economy in the World:
Energy Intensity 1990 – 2010

•   Energy efficiency one of the
    most cost-effective ways to cut
    emissions.                           325
                                                                                                                                                                                                  EU-27 Kg
                                         305                                                                                                                                                      Oil
•   Energy intensity today 50%                                                                                                                                                                    equivalent
    lower than 1990 i.e. EU uses half    285                                                                                                                                                      per €1000
                                                                                                                                                                                                  GDP
    the energy for every €1,000 of       265
    GDP added to economy.                245

•   EU ahead of curve making             225
    energy efficiency vital to           205
    competitiveness.
                                         185

•   Without EU EE leadership recent      165
    fossil fuel price rises and
                                         145
    volatility would have been much
                                         125
    greater: Yearly average oil prices
                                               1990
                                                      1991
                                                             1992
                                                                    1993
                                                                           1994
                                                                                  1995
                                                                                         1996
                                                                                                1997
                                                                                                       1998
                                                                                                              1999
                                                                                                                     2000
                                                                                                                            2001
                                                                                                                                   2002
                                                                                                                                          2003
                                                                                                                                                 2004
                                                                                                                                                        2005
                                                                                                                                                               2006
                                                                                                                                                                      2007
                                                                                                                                                                             2008
                                                                                                                                                                                    2009
                                                                                                                                                                                           2010
    increase by nearly 300% (2003-
    2012) while Europe’s
    dependency on oil imports has          Source: Eurostat

    risen to 85%.
Energy Security – Energy Efficiency Balance for EU

                                            Source: Eurostat (gas imports) and BPIE (gas savings potential)
        5000

        4500

        4000

        3500

        3000
TWh/a

        2500

        2000

        1500

        1000

         500

           0

               Total Imports   Imports from Russia                   Saving Potential from
                  (2011)              (2011)                         DEEP RENOVATION
                                                                            (2030)
REALITY CHECK 1: Overall the system works

                                       Direct EU ETS cost estimates after
• Current allowance system             benchmark-based free allocati on & banking
                               15%
  works: EU industrial                                                           Source: Authors, Polish NIM, EUTL.

  sectors face very low
  aggregate compliance         10%

  costs
                               5%
• Need to address overall
  investment climate in EU =
                               0%
  permitting, labour costs,
                                     Cement   Lime Coke oven Refined Iron and    Glass and Ceramics Pulp and
  energy contracting and                            products petroleum steel**     glass   and brick paper
                                                              products*          products
  high energy prices.
                                        % GVA post banking and free       % GVA post banking and free
                                        allocation (20 €/tCO 2)           allocation (30 €/tCO 2)

                                       %Operating profit post-banking     %Operating profit post-banking
                                       and free allocation (20 €/tCO2)    and free allocation (30 €/tCO 2)

                                       Source: IDDRI 2014
REALITY CHECK 2: Carbon leakage is not the issue

                                                               Gas as Feedstock
                   25%                                                                                    Gas feedstock
                                                                                                          expenditure/sectoral
                                                                                                          VA
                   20%
                                                                                                          Employers' health
                                                                                                          care
% in sectoral VA

                                                                                                          expenditure/sectoral
                                                                                                          VA
                   15%
                                                                                                          Log. (Gas feedstock
                                                                                                          expenditure/sectoral
                                                                                                          VA)
                   10%

                   5%

                   0%
                         0%         1%         1%       2%      2%      3%       3%        4%   4%   5%
                                                    Sectoral VA as % of GDP (cumulative)
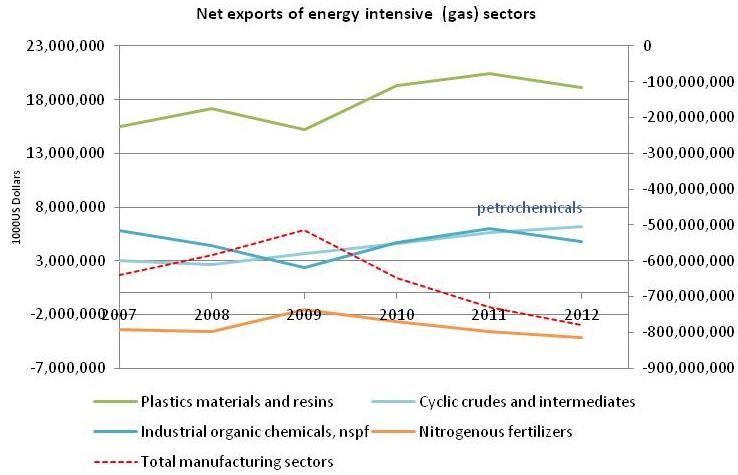
                          Source: IDDRI 2014
REALITY CHECK 3: Competitiveness hindered by cheap US gas

• Competitiveness benefits                         US net exports from gas intensive sectors
  mainly limited to sectors
  using gas as a feedstock
  and with low transport
  costs (e.g. ethylene and
  related products)
• These sectors are
  strongly driven by gas
  prices.
• With the right supportive
  policies, robust carbon
  pricing should not change
  outcomes in these
  sectors.

                              Source: IDDRI 2014
REALITY CHECK 4: Europe Needs to Invest in Infrastructure

•    To keep the lights on and stay on a cost-effective decarbonisation path EU
     must replace old power stations and upgrade infrastructure
•    Energy infrastructure essential for economic growth: by 2020
     investments must increase by 30% for gas and 70% for electricity
•    Enabling €1 trillion of investment in energy infrastructure by 2020
     could be useful net contributor to short-term growth, with strong multiplier
     effects across the economy (IDDRI 2014)
•    Clean energy investments grew six fold since 2004: Costs of scaling
     up domestic low carbon energy coming down e.g. wind turbine prices
     globally down by 30% in the last 4 years, while solar PV installation costs
     down 50% in last 5 years.
•    The time is right: low borrowing costs & private capital underemployed
2030 PACKAGE REFLECTIONS: Platform Advisory Council II

•   Fundamental principles for EII’s: Long term contracting, ETS reform, carbon
    leakage list unchanged, policy linkages (state aid, industrial policy, internal
    market rules, level playing field, value chain thinking)
•   The possibility of differentiation of EU ETS post 2020 cap correction factors
    between industrial sectors and the power sector under a post 2020 EU ETS
    while maintaining the over-all integrity and liquidity of the EU ETS.
•   Policy support for the demonstration phase of industrial low-carbon
    breakthrough technologies, including EU ETS auto-financing options.
•   The role and opportunities for large power consumers in Europe's 2020-2030
    (renewable) energy framework through demand side management and
    enhanced auto-production. Includes identification and elimination of barriers.
•   Support for cross-sectoral roadmaps and innovation collaboration. Is there
    a role/need for an European ARPA-I (Advanced Research Project Agency for
    Industrial innovation), with the Community assisting industry through angel/seed
    financing of cross-sectoral product and process innovation
Conclusions

“ Waiting is not an option… if we do nothing at this stage, everything will simply
become much more expensive.” – Chancellor Angela Merkel, Petersberg Climate Dialogue, May 2013

“ Action on climate change is one of the great economic opportunities of the 21st
century.” – US President Barrack Obama, June 2013

““If there is a lack of confidence that climate change policies will persist, then businesses may not factor a
carbon price into their decision-making. The result may be overinvestment in long-lived, high-carbon
infrastructure which will make emissions cuts later on much more expensive and difficult.” – Nicholas Stern,
2008

“Energy infrastructure is essential for economic growth. Since before the industrial revolution
transformations in how energy is generated, transported and consumed have underpinned
technological progress….” - Her Majesty’s Treasury, UK Government, 2013
You can also read