PTB Group Limited 1H2021 Results Presentation - 22nd February 2021 This presentation has been authorised for release to ASX by the Board of ...
←
→
Page content transcription
If your browser does not render page correctly, please read the page content below

PTB Group Limited

1H2021 Results
Presentation

22nd February 2021

This presentation has been authorised for release to ASX by the Board of Directors of PTB Group Limited
                                                                                                          1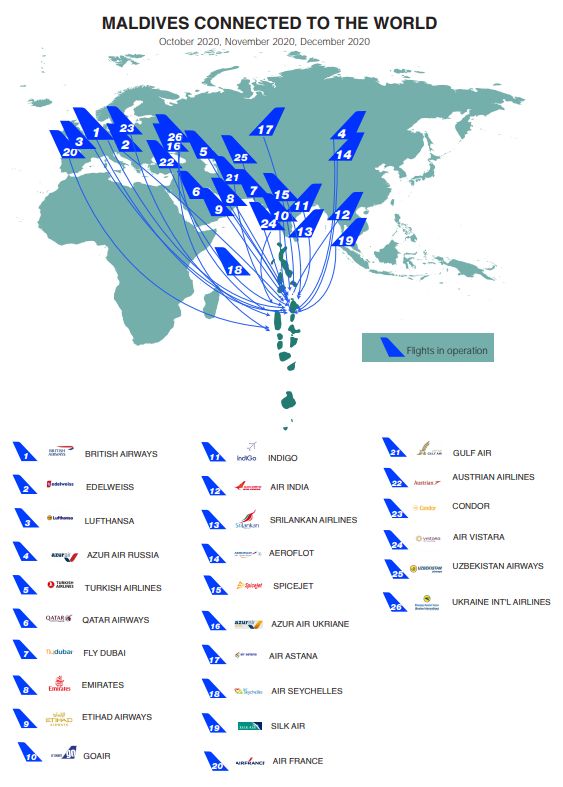
1H2021 in Review
    Record financial performance
✓   - Record first half performance despite challenging operating environment
    - PTB’s ability to pivot and resilient operating model have again been proven
                                                                                                                       FINANCIAL HIGHLIGHTS:

    Completed Sale of Warriewood Properties for Substantial Premium to Book Value                                                      Revenue up 48%
✓   - Announced the sale of PTB’s two Warriewood properties for $9.5 million in cash
    - Sale generated a pre-tax profit of $5.8 million (after costs)
                                                                                                                                       to $38.622 million
                                                                                                                                       (1H 2020: $26.096 million)
    - Sale expected to be finalised on 30 April 2021

✓
    Full Year Profit Guidance Increased
    - Previous AGM guidance was for FY2021 NPBTFX to be in the range of $11–13 million                                                 Reported EBITDA
    - Upgraded guidance range in December 2020 to $15–17 million                                                                       up 207% to
                                                                                                                                       $13.553 million
✓
    Dividend Guidance Provided at AGM
    - PTB to pay 30% - 50% of Reported NPAT as a Fully Franked Dividend                                                                (1H 2020: $4.409 million)

    Conservative Balance Sheet Retained
✓
                                                                                                                                       NPBTFX* up 295%
    - Sale of Warriewood properties to deliver $9.5 million in cash (pre-costs)
    - Retained land and building (Brisbane) and significant inventory balance ($52 million)                                            to $10.571 million
                                                                                                                                       (1H 2020 : $2.677 million)

✓
    US operations established a platform for growth
    - COVID-19 travel restrictions impacted ability to enact operating changes in USA in short term
    - Longer term strategy to replicate PTB’s operating model within Prime remains fully intact
    - Stephen Smith now temporarily relocated to USA to drive operating changes and further growth

✓
    Key markets back to long-term average levels of activity
    - Maldives flying activity back above long term average                         * NPBTFX is net profit before tax, excluding foreign exchange (FX) gains and losses
                                                                                                                                                            2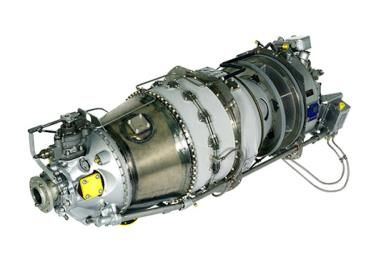
Group and Segment Performance
Reported Revenue
                     • PTB has recorded a 48% growth in Revenue over 1H 2020
  +48%
                     • Underlying EBITDA increased 55% (excludes property sales
                       in FY21 and acquisition costs in FY20)

                     • EBITDA (pre-FX) increased 207% over 1H 2020

                      EBITDA (Pre-FX)            1H 2018   1H 2019   1H 2020   1H 2021
                      ($’000)
                      Pacific Turbine Brisbane    2,505     2,459     3,083     3,169
Underlying EBITDA
                      Pacific Turbine USA          -68      358        59       2,992
  +55%                Pacific Turbine Leasing     1,008     1,238     1,177     1,475

                      International Air Parts     619       1,193     1,650     7,123

                      Head Office                 -815      -811     -1,560    -1,206

                      Group                       3,249     4,437     4,409    13,553

                                                                                         3
PTB Group’s Resilient Operating Model …
                             Repairs and sells PT6 and TPE331 engines, maintains
                             related engines under contract, and trades related
                                                                                      Abridged 1H 2021 Profit and Loss Statement ($’000)                       PTB’s
                             engine and airframe parts                                                               1H 2018     1H 2019   1H 2020   1H 2021   operating
                                                                                                                      31 Dec      31 Dec    31 Dec    31 Dec
                             Provides MRO services on turboprop engines (PT6A,       PBT                               1,905       3,196     2,540    10,244   margins
                             PT6T and T53), as well as Bell drivetrain components    Gain/(loss) on FX                   -10         257      -137      -327
                             from Texas, Arizona, Miami and Pennsylvania. The        Acquisition costs                     0           0      -612         0   have held
                             division also supplies and manages spare parts.         NPBTFX                            1,915       2,939     3,289    10,571   firm over
                             Owns aircraft and engines and leases these to
                             operators under both operating and finance leases       PBT                               1,905       3,196     2,540    10,244   the
                             (PT6, TPE331, Rolls Royce)                              Gain/(loss) on FX                   -10         257      -137      -327
                                                                                     Depreciation and Amortisation      -864      -1,062    -1,222    -2,194   historical
                            The division trades in aircraft, jet aircraft engines,
                            airframes and related parts
                                                                                     Impairments
                                                                                     Finance costs
                                                                                                                           0
                                                                                                                        -470
                                                                                                                                       0
                                                                                                                                    -436
                                                                                                                                                 0
                                                                                                                                              -510
                                                                                                                                                           0
                                                                                                                                                        -788
                                                                                                                                                               period
                                                                                     EBITDA                            3,249       4,437     4,409    13,553
                                                                                     Acquisition costs                     0           0      -612         0
                                                                                     Building Sale                         0           0         0     5,774
                                                                                     Normalised EBITDA                 3,249       4,437     5,021     7,779
               Integrated Business Model                                             Normalised EBITDA Margin (%)     17.2%       18.7%     19.2%     20.1%

                                              New Leasing                            Normalised EBIT                   2,385       3,375     3,799     5,585
    End of Life                               Opportunity
    sale or tear
                                                                                     Normalised EBIT Margin (%)       12.6%       14.2%     14.6%     14.5%
       down

                                                                                     Normalised EBITDA Margin (%)              Normalised EBIT Margin (%)

                                                    Upfront
                                                   financing
                                                    margin
     Life of asset
        parts /
    consumables

                         Engines signed
                             to PBH
                           Program                                                                                                                                 4
… Leads to Forecast Predictability
• PTB has a sustained history of meeting or
PTB’s NPBTFX Guidance versus Actual exceeding guidance provided to the market
$4.12m • In the 2020 Results Presentation (August 2020)
$4.0m $4.3m
PTB provided a range of $11-13 million NPBTFX
for FY2021
$4.2m $4.428m
• FY2021 NPBTFX guidance was increased to
$5.314m
$5.1m $5.5m
$15-17 million following the sale of the Sydney
buildings.
$7.9m (revised)
$7.0m -
$7.5m
$7.959m
• EBITDA (excluding FX) for FY2021 is expected
to be $21-23 million.
1H 2021 $11m–$13m $15m–$17m
$10.571m
Notes:
• FY2017 guidance provided in December 2016 and affirmed in January 2017
• FY2018 guidance provided in May 2018
• FY2019 guidance provided in November 2018
• FY2020 guidance provided in January 2020 was for a range of $7.1m to $7.5m and upgraded in June 2020 to $7.9m
• FY2021 guidance provided at the time of the AGM was for a range of $11m to $13m and upgraded in December to $15m to $17m
Guidance Range Full Year Result Half-Year Result
51H Result and Full Year Guidance
• PTB’s underlying NPBTFX for 1H2021 (excluding profit on the sale of the Sydney (1) Profit on sale of Warriewood
based buildings) was $4.8 million. properties. Sold for $9.5 million with a
book value of $3.5 million and
estimated selling costs of $0.2 million
• To beat the low end of FY2021 NPBTFX guidance, PTB would need to replicate
(2) Reported NPBTFX for 1H FY2021
its first half performance. amounts to 91% of previous full year
PTB’s Upgraded FY2021 NPBTFX Guidance guidance (including one-off items)
(3) PTB requires $4.4m to meet low end,
(3) or $6.4m to reach the top end, of the
6.4 (3) 15.0-17.0
revised guidance as provided to the
market in December 2020
4.4
4.8
(2)
10.6
(1)
5.8
Pre-Tax Profit on Sale (Post- Underlying 1H FY2021 Result 1H FY2021 Reported NPBTFX H2 Guidance FY2021 NPBTFX Forecast
6
Costs)COVID Impacts Abating
• Following the acquisition of Prime, PTB’s exposure to the Revenue By End Market
tourism sector significantly reduced and is estimated to be
approximately 20% of revenues
• The majority of this exposure lies with the support PTB provides
to customers in the Maldives
• Activity levels in the Maldives continue to improve from their
April 2020 lows
• Flying hours per month for customers in the Maldives are now Maldives Monthly Flying Hours
back to levels that are in line with the historical average Highest ever hours Hours returned to
Long term average on record pre- above long-term
(Jan-16 to Dec-20) pandemic average in Dec-20
Jul-17
Jul-16
Apr-18
Jul-18
Jul-19
Jul-20
Apr-16
Apr-17
Jan-19
Apr-19
Apr-20
Jan-16
Jan-17
Jan-18
Jan-20
Oct-16
Oct-17
Oct-18
Oct-19
Oct-20
7Maldives in Focus
• The tourism model in the Maldives is based Tourist Arrivals (July to December) Maldives Inbound Air Travel Options
on the concepts of isolation and social
distancing via beach villas or water
bungalows
• CY 2019 saw tourist numbers to the Maldives
exceed 1.7 million arrivals with China (17%),
India (10%), Italy (8%), Germany (8%) and UK
(7%) making up the top five markets
• The Chinese market weakened in 2020,
however visitors from other nations have
Note: On 15th July 2020, the Maldives reopened its borders to tourists
increased Source: Ministry of Tourism
YoY Tourist Arrivals By Region (Dec-20 vs Dec-19) Tourist Arrivals By Region (CY2020)
8The Market PTB is Pursuing
• The PT6 engine is one of the most successful and versatile engines of all Turboprop Aircraft Deliveries By Region (2007-2019)
time with Pratt and Whitney recently producing its 50,000th PT6
turboprop engine since production began in 1963 Europe
13.2%
• The PT6 engines remains the product of choice for high power, high cycle North
America
Middle
applications in single and twin-engine aircraft 53.3%
East and
Africa Asia
6.4% Pacific
13.7%
Over 7,400 operators use
the PT6 engine in their
Over 400 million flight fleet Latin
America
13.3%
hours logged New models of planes
are being developed Chart above shows customer delivery region (in percent of Total for General Aviation Aeroplane Shipments for
such as Textron’s twin Turboprop planes. The figures shown represent the average number of turboprop planes delivered by region over
the 2007 to 2019 years. Source: GAMA
Over 50,000 utility turboprop, the
engines Cessna SkyCourier Turboprop Aircraft Market
produced since
1963 Turboprop aircraft occupy an essential role in global aviation
Used in over 180 markets:
different countries • More than 1/3 of the world’s commercial airports rely exclusively on
around the world turboprops
Power range between 500 • Turboprop aircraft connect remote locations and therefore play an
Over 130 different essential role in regional economic development
and 2,000 SHP applications for • Fleet replacements and the opening of new regional routes are
the PT6 engine expected to drive future sales
• PTB’s current estimated market share is under 1%
9Balance Sheet Supportive of Growth
• PTB has net assets of $87.7 million, or 68.5 cents per share and Net Assets ($’000)
is currently trading at or around the net asset value per share PTB has grown its net
87,655
asset position over 86,312
time
• PTB sold two properties in Sydney during the first half of the
FY2021 year for $9.5 million, which is expected to be settled in 47,315
50,966
44,753
April 2021, further adding to the strong cash position of the
group
• PTB retains a conservative balance sheet and cash proceeds
FY17 FY18 FY19 FY20 1H FY21
from the sale will be applied to repay debt and other capital
management initiatives. Net Assets Per Share
0.685 0.685
• Bank debt totals $14 million with other debt primarily secured against
PTB currently
specific assets (cash balance $11 million) trades at its
• Bank debt will reduce further following the receipt of the building sale Book Equity
Value
proceeds
• Lease liabilities total $3.3 million
• PTB retains ownership of its head office building in Brisbane
• PTB holds $52 million in inventory
Net Assets Per Share (31 Dec 20) Share Price (17 Feb 21)
10Outlook and Strategic Focus
• PTB has delivered a record first half financial result despite an operating environment dominated by headwinds
• The ability of the business to pivot and respond to changing market conditions is a key differentiator to other industry participants
PTB Group retains an inventory of spare parts which can
Feeder mechanism to
either be applied during MRO services or sold to third parties
engine workshops
End of life teardown capability
allows for the creation of an
Aircraft Operating Lifecycle inventory of spare parts for
New Aircraft Used Aircraft Engine Maintenance, low cost
Spare Parts and Other End of Life, Return to
(OEM Sales) (Secondary Market Sales) Repair and Overhaul Services Service or Teardown
Services
Well • Low gearing Active dialogue • Active dialogue with potential new PBH and leasing customers
Capitalised for • Cash on hand to invest in growth opportunities with potential • Active discussions in new geographies with new customers
Growth • Selected opportunities currently under review new customers • FAA and EASA accreditation key to momentum
All divisions • Strategic rationale for entry in USA remains wholly intact
• FAA and EASA accreditations open up new geographic
FAA and EASA remain poised • Opportunity to drive leasing growth
markets and provide access to new customers for meaningful
accreditation
growth
11You can also read