Artis Real Estate Investment Trust Investor Presentation - Q2-2018 - Artis REIT

Page created by Tommy Vasquez
 
CONTINUE READING
Artis Real Estate Investment Trust Investor Presentation - Q2-2018 - Artis REIT
Artis Real Estate Investment Trust
             Investor Presentation
                          Q2-2018
Artis Real Estate Investment Trust Investor Presentation - Q2-2018 - Artis REIT
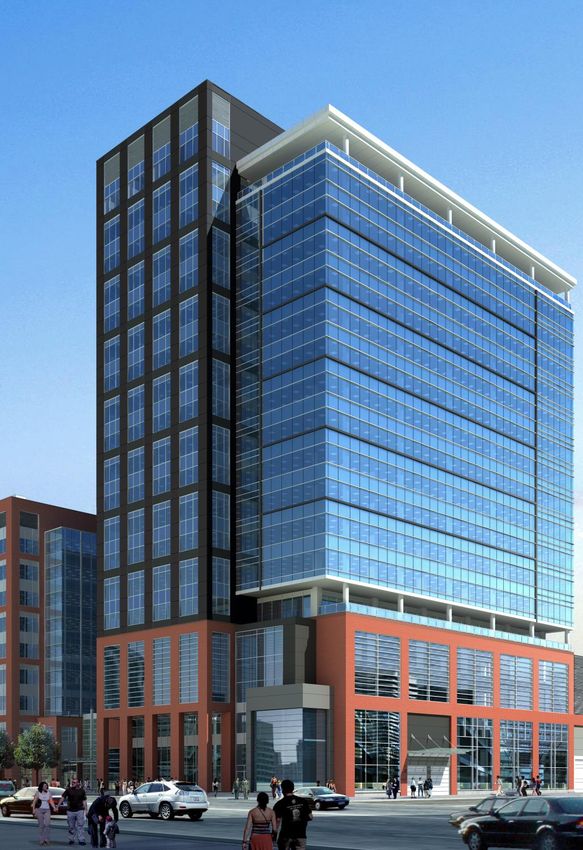
Forward Looking
Statements

  This presentation may contain forward-looking statements. For this purpose, any statements contained herein that are not
  statements of historical fact may be deemed to be forward-looking statements. Without limiting the foregoing, the words
  “expects”, “anticipates”, “intends”, “estimates”, “projects”, and similar expressions are intended to identify forward-looking
  statements. All forward-looking statements in this presentation are made as of June 30, 2018.

  Although the forward-looking statements contained or incorporated by reference herein are based upon what management
  believes to be reasonable assumptions, Artis cannot assure investors that actual results will be consistent with these forward-
  looking statements. Artis is subject to significant risks and uncertainties which may cause the actual results, performance or
  achievements of the REIT to be materially different from any future results, performance or achievements expressed or implied
  in these forward-looking statements. Artis assumes no obligation to update or revise such forward-looking statements to reflect
  actual events or new circumstances. All forward-looking statements contained in this presentation are qualified by this
  cautionary statement.

  Information in this presentation should be read in conjunction with Artis’ applicable consolidated financial statements and
  management’s discussion and analysis. Additional information about Artis, including risks and uncertainties that could cause
  actual results to differ from those implied or inferred from any forward-looking statements in this presentation, are contained in
  our various securities filings, including our current Annual Information Form, our interim filings dated August 3, 2017,
  November 6, 2017, May 10, 2018 and August 2, 2018, our 2017 annual earnings press release dated March 1, 2018, and our
  audited annual consolidated financial statements for the years ended December 31, 2017 and 2016 which are available on
  SEDAR at www.sedar.com or on our company website at www.artisreit.com.

Artis Real Estate Investment Trust Q2-18 Investor Presentation| www.artisreit.com                                                      02
Artis Real Estate Investment Trust Investor Presentation - Q2-2018 - Artis REIT
Strategy and Business
Model
                                                                                    Geographic Diversification
                                                                               01   • Canada and the United States

                                                                               02   Product Diversification
                                                                                    • Office
                                                                                    • Retail
                                                                                    • Industrial

                                                                               03   Internal Growth
                                                                                    • Results driven active asset
                                                                                      management
                                                                                    • Increasing same property net
                                                                                      operating income
                                                                                    • Accretive recycling of capital
                                                                                    • Accretive refinancing of existing
                                                                                      debt
                                                                                    • $200 million development pipeline
                                                                                      at positive spreads to market

Artis Real Estate Investment Trust Q2-18 Investor Presentation| www.artisreit.com                                     03
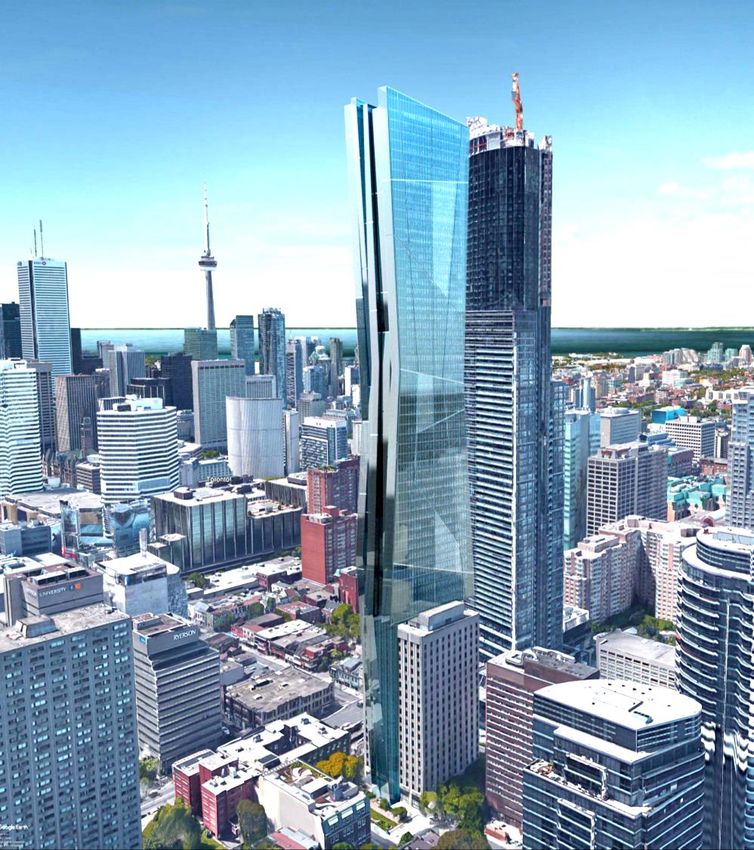
Artis Real Estate Investment Trust Investor Presentation - Q2-2018 - Artis REIT
Portfolio Overview
Diversified Commercial Properties

                                       0.5M
                                       sq.ft              3.9M
                                                          sq.ft
                                                                            1.5M
                                                                                             3.9M
                                                                            sq.ft
                                                                                             sq.ft
                                                                                                                                         4.0M
                                                                                                                                         sq.ft

                                                                  1.2M
                                                                  sq.ft                                      5.7M
                                                                                                             sq.ft      1.7M
                                                                                                                        sq.ft

                                                      1.7M                                           0.4M
              Office                                  sq.ft                                          sq.ft
              Industrial
              Retail

                        2 countries – 3 asset classes – 10 major markets
            233 properties – 24.5 million square feet – $5.7B GBV – 94% occupancy
                                 Excellent Management Platform
    Information on this slide is inclusive of Artis’ proportionate share of its joint venture arrangements.
    Occupancy percentage includes commitments on vacant space and excludes properties held for redevelopment and certain completed new developments.

Artis Real Estate Investment Trust Q2-18 Investor Presentation| www.artisreit.com                                                                      04
Artis Real Estate Investment Trust Investor Presentation - Q2-2018 - Artis REIT
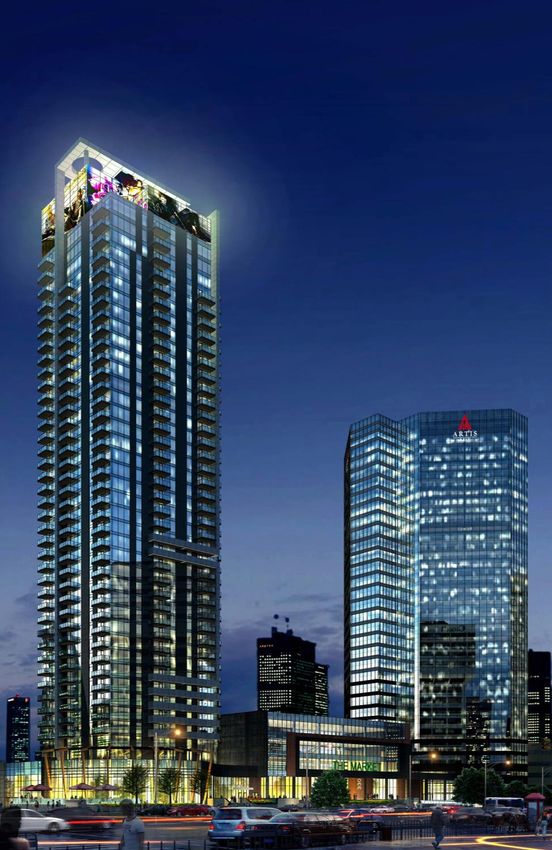
Portfolio Diversification

                            NOI by Asset Class                                                                              NOI by Geographical Region
                                                                                                                                  55% Canada                           45% USA
                                                                                                                                          US - Other                 SK
                             Retail                                                                                           WI              8%                     6%
                              21%                                                                                             9%                                                       ON
                                                                                                                                                                                       11%
                                                                                          Office
                                                                                           53%
                                                                                                                      AZ
                                                                                                                      9%
                                                                                                                                                                                                    MB
                                                                                                                                                                                                    13%

                                                                                                                                                                                                    BC
                                                                                                                        MN                                                                          4%
                                                                                                                        18%
                Industrial
                                                                                                                                                                            AB - Other
                   26%                                                                                                                Calgary - Office (1)                     14%
                                                                                                                                             8%

Property NOI for three months ended June 30, 2018, inclusive of Artis’ proportionate share of joint venture arrangements
(1) Calgary   office Property NOI was impacted by lease termination income received from a tenant in Q2-18. Calgary office Property NOI adjusted to exclude lease termination income is 7.3% for Q2-18

Artis Real Estate Investment Trust Q2-18 Investor Presentation| www.artisreit.com                                                                                                                        05
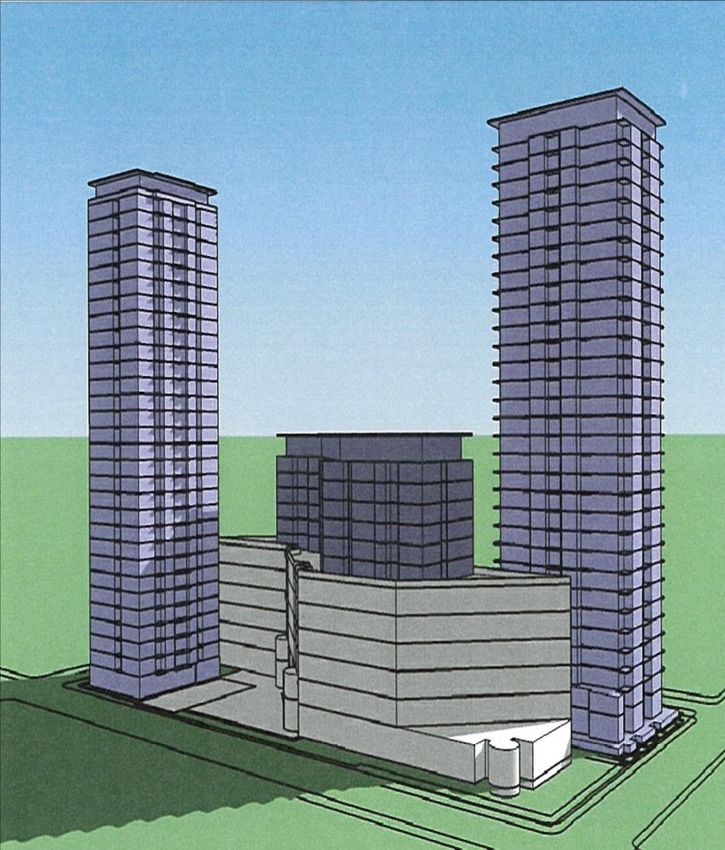
Artis Real Estate Investment Trust Investor Presentation - Q2-2018 - Artis REIT
Office Asset Class

 Number of Properties                                    70

 GLA                                                     10.3 million sq. ft.

 Occupancy                                               89%

                                                         Nine major markets
 Diversification                                         in Canada and the US

 IFRS GBV / IFRS Weighted-Average Cap Rate               $3.0 billion / 6.6%

 Same Property NOI Growth YTD                            -3.5%

 Weighted-Average Renewal Rent Increase YTD              +2.2%
                                                                                    Stampede Station, Calgary, AB     Hudson’s Bay Centre, Denver, CO
 Property NOI 2017 Annualized                            $168.8 million
 (on a proportionate share basis)

           Historical Same Property NOI Growth (SPNOIG) and
7.0%
           Weighted-Average Increase in Renewal Rents (WARI)
5.0%

3.0%
                                                         1.4% Average WARI
1.0%
                                  0.3% Average SPNOIG
-1.0%

-3.0%

-5.0%                                                                             360 Main Street, Winnipeg, MB     601 Tower at Carlson, Minneapolis, MN
        2010       2011   2012   2013      2014   2015    2016    2017 2018 YTD

                                  SPNOIG          WARI

Artis Real Estate Investment Trust Q2-18 Investor Presentation| www.artisreit.com                                                                06
Artis Real Estate Investment Trust Investor Presentation - Q2-2018 - Artis REIT
Retail Asset Class

 Number of Properties                                   54

 GLA                                                    3.4 million sq. ft.

 Occupancy                                              94%

                                                        Five major markets in
 Diversification                                        Canada and the US

 IFRS GBV / IFRS Weighted-Average Cap Rate              $1.1 billion / 6.4%

 Same Property NOI Growth YTD                           +2.9%

 Weighted-Average Renewal Rent Increase YTD             +3.3%
                                                                                           Aulds Corner, Nanaimo, BC       Reenders Square, Winnipeg, MB
 Property NOI 2017 Annualized                   $66.0 million
 (on a proportionate share basis)
17.0%
           Historical Same Property NOI Growth (SPNOIG) and
           Weighted-Average Increase in Renewal Rents (WARI)
15.0%
13.0%
11.0%
                                                         9.6% Average WARI
 9.0%
 7.0%
 5.0%
 3.0%                                                   2.3% Average SPNOIG
 1.0%
-1.0%                                                                               Shoppers Landmark Centre, Regina, SK      Crowfoot Village, Calgary, AB
        2010       2011   2012   2013     2014   2015        2016   2017 2018 YTD

                                 SPNOIG          WARI

Artis Real Estate Investment Trust Q2-18 Investor Presentation| www.artisreit.com                                                                  07
Artis Real Estate Investment Trust Investor Presentation - Q2-2018 - Artis REIT
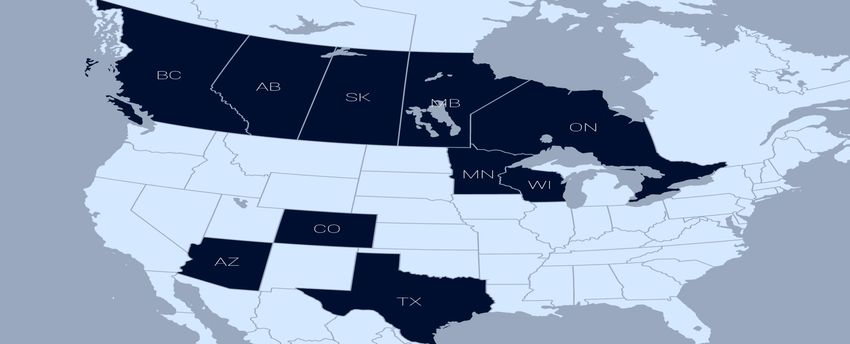
Industrial Asset Class

 Number of Properties                                   109

 GLA                                                    10.8 million sq. ft.

 Occupancy                                              97%

                                                        Nine major markets in
 Diversification                                        Canada and the US

 IFRS GBV / IFRS Weighted-Average Cap Rate              $1.4 billion / 6.2%

 Same Property NOI Growth YTD                           +1.6%

 Weighted-Average Renewal Rent Increase YTD             +4.5%
                                                                                     1595 Buffalo Place, Winnipeg, MB         Park Lucero I, Gilbert, AZ
 Property NOI 2017 Annualized                   $76.3 million
 (on a proportionate share basis)
           Historical Same Property NOI Growth (SPNOIG) and
10.0%      Weighted-Average Increase in Renewal Rents (WARI)
9.0%
8.0%
7.0%
6.0%
5.0%
4.0%                                         4.5% Average SPNOIG
3.0%
                                                 3.7% Average WARI
2.0%
1.0%
0.0%                                                                                     1903 Turvey Road, Regina, SK   Roosevelt Commons, Tempe, AZ
        2010       2011   2012   2013     2014   2015     2016       2017 2018 YTD

                                 SPNOIG          WARI
Artis Real Estate Investment Trust Q2-18 Investor Presentation| www.artisreit.com                                                               08
Artis Real Estate Investment Trust Investor Presentation - Q2-2018 - Artis REIT
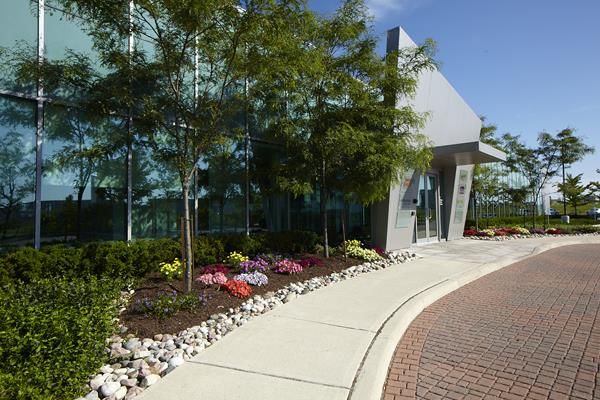
The Sum of All Parts

                                                                                               Weighted-          IFRS
              Share of                                                         Same Property   Average Increase   Weighted-
              Property       Number of                                         NOI Growth      in Renewal Rents   Average
              NOI            Properties    GLA                     Occupancy   YTD             YTD                Cap Rate    IFRS GBV

 Office       53%            70             10.3 million sq. ft.   89%         -3.5%           2.2%               6.6%        $3.0B

 Retail       21%            54             3.4 million sq. ft.    94%         2.9%            3.3%               6.4%        $1.1B

 Industrial   26%            109            10.8 million sq. ft.   97%         1.6%            4.5%               6.2%        $1.4B

 Other                                                                                                                        $0.2B

 TOTAL        100%           233            24.5 million sq. ft.   94%         -1.0%           2.9%               6.4%        $5.7B

NAV: $15.30 per unit

Artis Real Estate Investment Trust Q2-18 Investor Presentation| www.artisreit.com                                                09
Artis Real Estate Investment Trust Investor Presentation - Q2-2018 - Artis REIT
Lease Expiration Schedule

                        20.0%                                               Percentage of Portfolio GLA Expiring

                        18.0%

                        16.0%

                        14.0%
                                                                                                  11.7%                      12.8%
                                                                       11.3%
                        12.0%
                                                                                                                                                        9.7%
                        10.0%

                          8.0%

                          6.0%
                                              3.9%
                          4.0%

                          2.0%

                          0.0%
                                             2018                       2019                      2020                       2021                       2022

      Weighted-average rental increase on renewals YTD:
      3.2% excluding Artis’ Calgary office properties (2.9% including Calgary office properties)
      Same Property NOI Growth YTD:
      Stabilized Same Property NOI in Canadian dollars increased 1.2% (or decreased 1.0% including the Calgary office segment
      and properties planned for disposition and re-purposing).
      2018 Renewal Program:
      43% of remaining 2018 expiries have been renewed or committed to new leases
The chart above reflects the percentage of Artis’ total GLA expiring (excluding properties held for redevelopment, certain completed new developments and new developments in process)
exclusive of GLA that has been renewed or committed to new leases at June 30, 2018.

Artis Real Estate Investment Trust Q2-18 Investor Presentation| www.artisreit.com                                                                                                        10
Artis’ Investment in Alberta
                                       8% Office
                                       14% Industrial & Retail                                                Alberta Outlook Improving
     Alberta Expiry Schedule
     % of Total GLA expiring per year                                                                         • Alberta to lead Canada in GDP growth during
                                                                                                                2018

     4.0%                                                                                                     • Enbridge Line 3 underway (completion 2019)
     3.5%
                                                                                                              • Trans-Mountain pipeline approved
     3.0%                                                                                                       (completion 2020)

     2.5%                                                      2.3%                        2.3%               • Keystone XL pipeline approved
                                                                                                                (completion 2021)
     2.0%

     1.5%                          1.4%                       1.4%                         1.5%               • OPEC deal sustained
                                                 1.1%                         1.1%
     1.0%                         0.6%          0.2%                         0.2%                             • Capital spending significantly increasing in
                    0.6%
     0.5%
                                                                                                                Alberta
                    0.4%          0.8%          0.9%          0.9%           0.9%          0.8%
     0.0%           0.2%                                                                                      • Job growth increasing
                 2018 2019 2020 2021 2022 2023
              Alberta exclusive of Calgary office Calgary office                                              • Artis’ Alberta retail and industrial properties
                                                             (2)                    2013         2014(2) 2015 (2) 2016(3)
                                                                                                            achieving        2013(2)same
                                                                                                                          positive    2014property
                                                                                                                                           (2) 2015(2) 2016(3)
                                                                                                                                                      NOI growth

 The chart above reflects the percentage of Artis’ Alberta and Calgary office GLA expiring (excluding properties held for redevelopment, certain completed new developments and new developments
 in process) exclusive of GLA that has been renewed or committed to new leases at June 30, 2018.

Artis Real Estate Investment Trust Q2-18 Investor Presentation| www.artisreit.com                                                                                                              11
Leverage Profile
DBRS: BBB- Credit Rating
                                                          Healthy Balance Sheet and Liquidity

                                                                                                                                                           DBRS Recommended
      Fiscal quarter ending:                     June 30, 2017                   December 31, 2017                         June 30, 2018                       Threshold

      Debt: GBV                                         50.4%                                49.3%                                49.0%                               ≤ 53.0%

      Secured mortgages
                                                        38.9%                                31.9%                                31.7%                                  N/A
      and loans: GBV
      Unencumbered
      assets                                        $1.1 billion                        $1.7 billion                         $1.6 billion                                N/A

      Normalized EBITDA
                                                         3.30                                 3.23                                 3.02                                ≥ 2.25
      interest coverage
      Normalized Net
                   (1)                                   8.33                                 8.30                                 8.25                                ≤ 9.25
      Debt: EBITDA

                                       Cash and cash equivalents at June 30, 2018: $168.1 million
                                          Availability on unsecured credit facilities: $220.8 million

    (1)   Debt at most recent quarter divided by income on an annualized basis Information on this slide is inclusive of Artis’ proportionate share of its joint venture arrangements

Artis Real Estate Investment Trust Q2-18 Investor Presentation| www.artisreit.com                                                                                                       12
Select Financial Information

                 $700                                                                                                                    $1.80

                                                                                                            $573                         $1.60                           $1.55
                 $600                                                                                                                                         $1.49                 $1.43
                                                                                                  $553               $543
                                                                                        $509                                             $1.40                                                $1.29
                 $500
                                                                                                                                         $1.20
                 $400
$ millions (1)

                                                                                                                                         $1.00
                                            $342 $349          $326
                                  $317
                 $300                                                                                                                    $0.80

                                                                                                                                         $0.60
                 $200
                                                                                                                                         $0.40
                 $100                                                                                                                                           $14       $13        $13        $13
                                                                                                                                         $0.20
                                    2014    2015     2016      2017                      2014     2015      2016      2017                                     2015       2016       2017      2018
                   $0                                                                                                                    $0.00
                                                             (1)
                                           Property NOI                                             Revenue (1)                                                          FFO per Unit (2)

                                                                                                                                                            Volume-Weighted Average
                                                                                                                                                                   Unit Trading Price

                        (1) Inclusive of
                                     Artis’ proportionate share of its joint venture arrangements. Excluding lease termination and non-recurring other income.
                        (2) The
                              2016 comparative information has been revised to reflect the impact of the new FFO guidelines as issued by REALpac in February 2017. 2015 and earlier years have not
                        been restated. 2018 FFO represents consensus analyst projections from most recent research reports (Q2-18). Artis does not endorse analyst projections. The above
                        information represents the views of the particular analyst and not necessarily those of Artis. An investor should review the entire report of the analyst prior to making any
                        investment decisions.

                        Artis Real Estate Investment Trust Q2-18 Investor Presentation| www.artisreit.com                                                                                           13
Recently Completed Development Projects
                                                         Completion   GLA                                          Unlevered    Occupancy at
 Property            Location          Asset Class       Year         (Artis’ share)      Value on Completion      Yield        June 30, 2018
 North City          Edmonton, AB      Office            2011            19,000 sq. ft.             $4.5 million         7.0%           93.7%
 Centre                                (densification)

 Maple Grove         Twin Cities       Industrial        2012            81,000 sq. ft.          US $8.2 million         8.0%            100%
 Industrial Center   Area, MN          (densification)

 6470 Metral         Nanaimo, BC                         2013
                                       Retail                             3,000 sq. ft.             $1.0 million         8.0%            100%
 Drive

 Midtown             Twin Cities
                                       Industrial        2014          185,000 sq. ft.          US $18.0 million         7.0%            100%
 Business Center     Area, MN

 Linden Ridge        Winnipeg, MB      Retail            2014            87,000 sq. ft.            $26.5 million         8.0%            100%
 Shopping Centre                       (densification)

 2190 McGillivray                      Retail
                     Winnipeg, MB                        2011/2015       24,000 sq. ft.            $10.0 million         8.0%            100%
 Boulevard                             (densification)

 Park Lucero         Greater Phoenix
                                       Industrial        2015          209,000 sq. ft.          US $23.5 million         7.0%            100%
 Phase I             Area, AZ

 Park Lucero         Greater Phoenix
                                       Industrial        2017          119,000 sq. ft.          US $13.8 million         7.9%            100%
 Phase II            Area, AZ

 Park Lucero         Greater Phoenix
                                       Industrial        2017          147,000 sq. ft.          US $16.4 million         6.7%            100%
 Phase III           Area, AZ

 175 Westcreek       Greater Toronto
                                       Industrial        2017          130,000 sq. ft.             $14.7 million         7.5%            100%
 Boulevard           Area, ON

                                                         TOTAL        1,004,000 sq. ft.

Artis Real Estate Investment Trust Q2-18 Investor Presentation| www.artisreit.com                                                           14
New Development Activity
~ $300 Million
          Targeted weighted-average unlevered yield of 7.00% vs. Exit Cap Rate of 5.75%

              Millwright Building                          Park 8Ninety Phase I            169 Inverness Drive West
                Minneapolis, MN                                  Houston, TX                         Denver, CO
Completed in Q1-17                               Completed in Q2-17                 Completed in Q1-18

          Park Lucero Phase IV                           Tower Business Center                      Cedar Port
          Greater Phoenix Area, AZ                                Aurora, CO                         Houston, TX
In Progress                                      In Progress                        In Progress

Artis Real Estate Investment Trust Q2-18 Investor Presentation| www.artisreit.com                                     15
Active Development Pipeline

                                                                                       Approx. GLA                                          Current/
                                                                                                                 Estimated Total   %                    Estimated
 Project Name                               Asset Class          Location              (Artis’ share)                                       Projected
                                                                                                                 Cost (000’s)      Leased   Yield       Completion

                                                          Recently Completed Developments and Developments in Process

 Millwright Building                        Office               Minneapolis, MN       139,000 sq. ft.           US$34,167         60%      7.0%        Completed

 Park 8Ninety Phase I                       Industrial           Houston, TX           418,000 sq. ft.           US$37,603         94%      6.8%        Completed

 169 Inverness Drive West                   Office               Denver, CO            118,000 sq. ft.           US$37,228         -        7.3%        Completed

 Park Lucero Phase IV                       Industrial           Phoenix, AZ           95,000 sq. ft.            US$8,105          -        7.1%        53% Complete

 Cedar Port Phase I                         Industrial           Baytown, TX           519,000 sq. ft.           US$35,034         100%     7.8%        Q3-19

 Tower Business Center                       Industrial          Aurora, CO            336,000 sq. ft.           US$26,104         -        6.8%        Q2-19

 Park 8Ninety Phase II                      Industrial           Houston, TX           543,000 sq. ft.           US$49,224         -        6.5%        2019

 Park 8Ninety Build-to-Suit                 Industrial           Houston, TX           36,000 sq. ft.            US$71,529         100%     7.1%        2020

                                             Multi-Family/                             580,000 sq. ft.
 300 Main                                                        Winnipeg, MB                                    $183,000          -        5.5%        2020
                                             Commercial                                395 units

 TOTAL                                                                                 2,784,000 sq. ft.         $481,994 (1)

(1) Estimated total cost of   recently completed developments and developments in process is in mixed dollars.

Artis Real Estate Investment Trust Q2-18 Investor Presentation| www.artisreit.com                                                                                    16
Future Development Pipeline

                                              Project Name                 Asset Class     Location       Estimated GLA       Estimated Completion
                                                                                                           (Artis’ share)

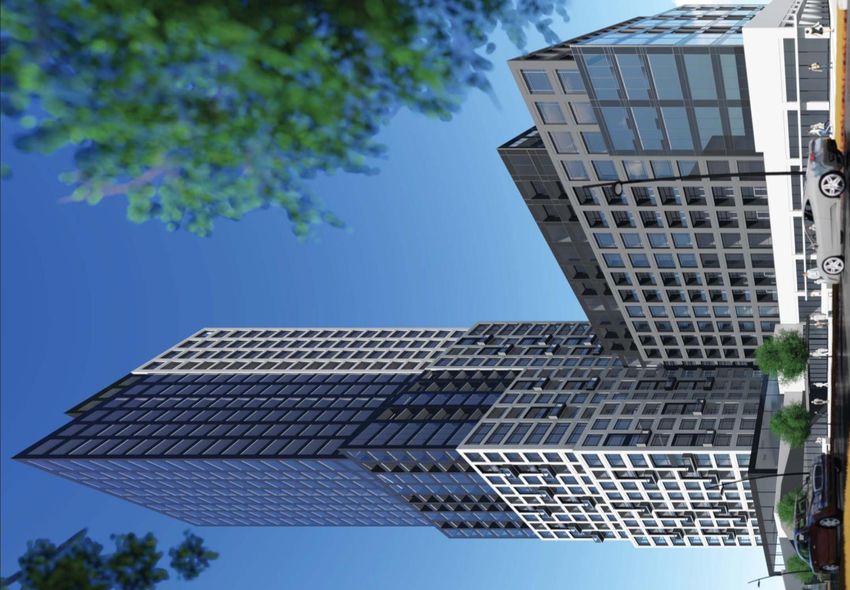
                                              415 Yonge Street               Multi-      Toronto, ON      300,000 sq. ft.            2020
                                              (Rezoning)                     Family                         375 units

                                              Concorde Corporate Centre      Multi-        GTA, ON        489,000 sg. Ft.            2021+
                                              (Rezoning)                     Family                         579 units

                                              Stampede Station               Multi-      Calgary, AB      315,000 sq. ft.            Q4-18
                                              Apartments (Rezoning)          Family
 801 Carlson Parkway – Twin Cities Area, MN
                                              Inverness Drive Phase II       Office      Denver, CO       120,000 sq. ft.            2021+

                                              TransAlta Place (Rezoning)     Multi-      Calgary, AB    500-600,000 sq. ft.          2020
                                                                             Family                       600-700 Units
                                              801 Carlson Parkway            Office      Minneapolis,     335,000 sq. ft.            2021+
                                                                                             MN

                                              Cedar Port Phase II          Industrial    Baytown, TX      520,000 sq. ft.            2021+

                                              Total                                                      2,109,000 sq. ft.
 Stampede Station Apartments – Calgary, AB

                                      Targeted weighted-average unlevered yield of 7.20 %

Artis Real Estate Investment Trust Q2-18 Investor Presentation| www.artisreit.com                                                             17
Value Creation from Developments

            (in millions of dollars, except Net Operating Income/Unit, Projected                         2019                 2020 (1)               Total
            Value Creation/Cost and Projected Value Creation/Unit) (3)

            Artis’ Share of Total Budgeted Costs of Projects Delivered                                   $184.9               $258.1                $443.0

            Estimated Artis’ Share of Combined NOI upon Stabilization                                    $12.8                $15.3                 $28.1

            Net Operating Income/Unit                                                                    $0.08                $0.10                 $0.18

            Estimated Value upon Completion
            (5.75% capitalization rate for commercial properties, 4.00% for
            apartments)                                                                                  $260.0               $405.0                $665.0

            Artis’ Share of Total Development Budget                                                     $184.9               $258.1                $443.0

            Projected Value Creation                                                                     $75.0                $147.0                $222.0

            Projected Value Creation/Cost                                                                40%                  57%                   50%

            Projected Value Creation/Unit                                                                $0.48                $0.95                  $1.43 (2)
(1) Value creation includes entitlements achieved at   415 Yonge and Concorde Place, (2) ~$1.10 is from Rezoning at Concorde, 415 Yonge, Poco Place, and TransAlta
(3) Estimated total cost of   recently completed developments and developments in process is in mixed dollars.
Artis Real Estate Investment Trust Q2-18 Investor Presentation| www.artisreit.com                                                                                    18
Projected Future Rental Income
 Total Revenue Impact $19.3 million
        Projected future net rental income from executed leases, that have yet to commence, at Artis’
          development projects. GLA amounts represent Artis’ proportionate share of leasable area.

                                                                                    24,100 sq. ft. of
                              $12.0 M                                                 GLA added

                              $10.0 M
                                                              939,600 sq. ft. of
                                                                GLA added
                               $8.0 M
         Additional Revenue

                               $6.0 M

                               $4.0 M

                               $2.0 M
                                        137,200 sq. ft. of
                                          GLA added
                               $0.0 M
                                             2018                   2019                2020
Artis Real Estate Investment Trust Q2-18 Investor Presentation| www.artisreit.com                       19
Upcoming Development
Projects – Multi-Family

         300 Main Street, Winnipeg, MB                                              Stampede Station II, Calgary, AB
              395 apartment units                                                       300 apartment units

Artis Real Estate Investment Trust Q2-18 Investor Presentation| www.artisreit.com                                      20
Upcoming Development
Projects – Multi-Family

           1-12 Concorde Gate, Toronto, ON                                          415 Yonge Street, Toronto, ON
                 500 apartment units                                                     400 apartment units

Artis Real Estate Investment Trust Q2-18 Investor Presentation| www.artisreit.com                                   21
Upcoming Development Projects – Multi-Family

           Poco Place, Port Coquitlam, BC                                           TransAlta Place, Calgary, AB
     600-900 apartment units, two to three towers                                      600 apartment units

Artis Real Estate Investment Trust Q2-18 Investor Presentation| www.artisreit.com                                  22
Market and Analyst Information

         Information as of August 2018:                                     Analyst Consensus Information per Unit (1)
         Unit price: $12.50                                                   Target price: $13.78
         Distribution per unit: $1.08                                         Net Asset Value: $14.07
         Cash Yield: 8.6%                                                     Artis IFRS NAV: $15.39
         Market cap: $2.0B
         Implied cap rate: 6.8%

                                                    2017                                                             2018

            Actual                        AFFO                 FFO             Consensus                AFFO                    FFO

            Per Unit                      $1.04               $1.43                                     $0.98                  $1.29

            Pay-Out Ratio                103.8%               75.5%                                    110.2%                  84.0%

            Unit Price
                                          12.8x                9.8x                                     13.2x                  10.0x
            Multiple

            Yield                          7.8%               10.2%                                      7.2%                  9.4%

                                                                               2013(2) 2014(2) 2015(2) 2016(3)                   2013(2) 2014(2) 2015(2) 2016(3)

(1) Consensus analyst projections from  most recent research reports (Q2-18). Artis does not endorse analyst projections. The above information represents the views of the
particular analyst and not necessarily those of Artis. An investor should review the entire report of the analyst prior to making any investment decisions.

Artis Real Estate Investment Trust Q2-18 Investor Presentation| www.artisreit.com                                                                                             23
Artis Peer Comparisons at December 31, 2017
            Annualized Total Unit Return                                             Annualized Total Unit Return
                Comparison 1 Year                                                        Comparison 3 Year
25%                                                                    10%
20%
15%                                                                     5%
10%                                                                     0%
 5%
 0%                                                                    -5%
-5%   Artis REIT TSX Cap Cominar      CREIT    H&R REIT Morguard               Artis REIT TSX Cap H&R REIT   CREIT   Cominar Morguard
                   REIT    REIT                           REIT                              REIT                       REIT    REIT

                                                 Annualized Total Unit Return
                                                     Comparison 5 Year
                                    8%
                                    6%
                                    4%
                                    2%
                                    0%
                                   -2%
                                          Artis REIT   CREIT    TSX Cap H&R REIT Morguard Cominar
                                                                  REIT             REIT     REIT

      Artis Real Estate Investment Trust Q2-18 Investor Presentation| www.artisreit.com                                                 24
Artis Peer Comparisons at June 30, 2018

                     Annualized Total Unit Return                                                Annualized Total Unit Return
                         Comparison 1 Year                                                           Comparison 3 Year
15%
10%                                                                                   8%
 5%
 0%                                                                                   3%
-5%
-10%                                                                                 -2%
           TSX Cap Cominar Artis REIT Morguard H&R REIT Choice                              TSX Cap    Artis REIT H&R REIT Morguard   Cominar
            Index    REIT               REIT           Properties                            Index                           REIT       REIT

                                                                   Annualized Total Unit Return
                                                                       Comparison 5 Year
                                                 8%
                                                 6%
                                                 4%
                                                 2%
                                                 0%
                                                -2%
                                                            TSX Cap   Artis REIT   H&R REIT Morguard    Cominar
                                                             Index                            REIT        REIT
       Note: Choice Properties became a diversified REIT in 2018

       Artis Real Estate Investment Trust Q2-18 Investor Presentation| www.artisreit.com                                                  25
Corporate Sustainability

                             25% office properties are               We are committed to improving the energy
                             BOMA BEST certified                     efficiency of our properties and reducing our
                                                                     environmental footprint.

                             24% office properties
                             are Energy Star certified

                             22% office properties                     Cara Foods Building, Vaughan, ON – LEED Gold Certified Property
                             are LEED certified

       Please view our full Sustainability
         Report at www.artisreit.com
Artis Real Estate Investment Trust Q2-18 Investor Presentation| www.artisreit.com                                                        26
Why Invest in Artis?
                   • 8.5% distribution yield
 1       Highest   • Investment-grade rating – BBB (low)
        Yielding   • 270 bps distribution yield spread and 165 bps AFFO yield spread to average investment-grade peers
     Investment    • 6.7% implied cap rate
     Grade REIT    • Strong balance sheet

              • Highly diversified platform
 2 Diversified  • 2 countries, 3 asset classes
  Platform by • 233 properties
 Geography & • $5.7 billion GBV
  Asset Class • $2.0 billion market cap

                • Accretive recycling of capital
 3                • ~$350 million recycling target
     Additional   • 20 Alberta properties sold at a premium to IFRS value
       Growth       and recycled at 150 bps spread in 2016 & 2017
        Levers  • Accretive refinancing of existing debt
                • Significant upside upon a recovery in Alberta
                  • Alberta expected to have highest GDP growth in Canada in 2017 and 2018

 4  Unlocking • ~$570 million projected value creation
        Value (~$3.80 per unit)
     Through • Industrial, Office and Apartment developments
 Development • 7.6% targeted unlevered yield

Artis Real Estate Investment Trust Q2-18 Investor Presentation| www.artisreit.com                                        27
Guideposts for 2018 and Beyond

    •     Accretive recycling of capital ($200-$300 million annual target) into:

             •    New acquisitions

             •    New development projects

    •     Improve calibre and diversification of portfolio

    •     Balance sheet considerations

             •    Maintain or improve current DBRS BBB- rating

    •     Reduce Alberta weighting to under 20% of Property NOI, and Calgary office to under 6%, in
          a disciplined manner to maximize Unit value

Artis Real Estate Investment Trust Q2-18 Investor Presentation| www.artisreit.com                     28
Portfolio Overview
Diversified Commercial Properties

                                       0.5M
                                       sq.ft              3.9M
                                                          sq.ft
                                                                            1.5M
                                                                                             3.9M
                                                                            sq.ft
                                                                                             sq.ft
                                                                                                                                         4.0M
                                                                                                                                         sq.ft

                                                                  1.2M
                                                                  sq.ft                                      5.7M
                                                                                                             sq.ft      1.7M
                                                                                                                        sq.ft

                                                      1.7M                                           0.4M
              Office                                  sq.ft                                          sq.ft
              Industrial
              Retail

                        2 countries – 3 asset classes – 10 major markets
            233 properties – 24.5 million square feet – $5.7B GBV – 94% occupancy
                                 Excellent Management Platform
    Information on this slide is inclusive of Artis’ proportionate share of its joint venture arrangements.
    Occupancy percentage includes commitments on vacant space and excludes properties held for redevelopment and certain completed new developments.

Artis Real Estate Investment Trust Q2-18 Investor Presentation| www.artisreit.com                                                                      29
Artis Real Estate Investment Trust
             Investor Presentation
                          Q2-2018
You can also read