Investors Presentation 5 February 2020 - Dr. Stephan Meeder, CFO - CropEnergies AG

Page created by Ken Waters
 
CONTINUE READING
Investors Presentation 5 February 2020 - Dr. Stephan Meeder, CFO - CropEnergies AG
Investors Presentation
      5 February 2020
      Dr. Stephan Meeder, CFO
Investors Presentation 5 February 2020 - Dr. Stephan Meeder, CFO - CropEnergies AG
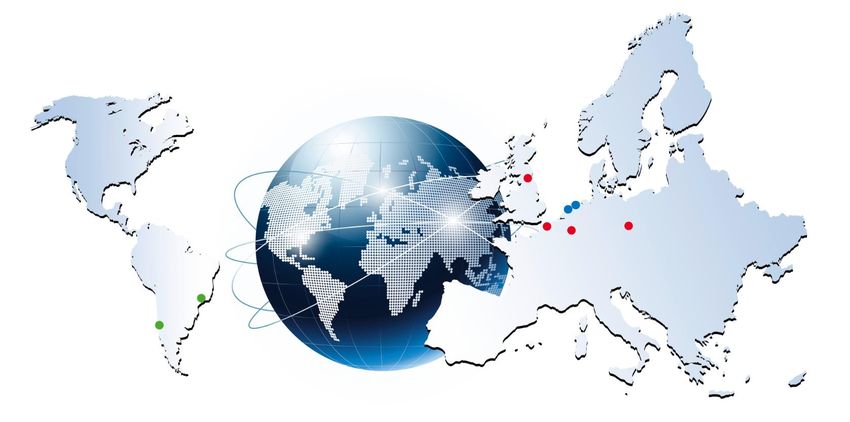
World greenhouse gas emissions

 Source: EEA

                                 CropEnergies AG, 5 February 2020   2
Investors Presentation 5 February 2020 - Dr. Stephan Meeder, CFO - CropEnergies AG
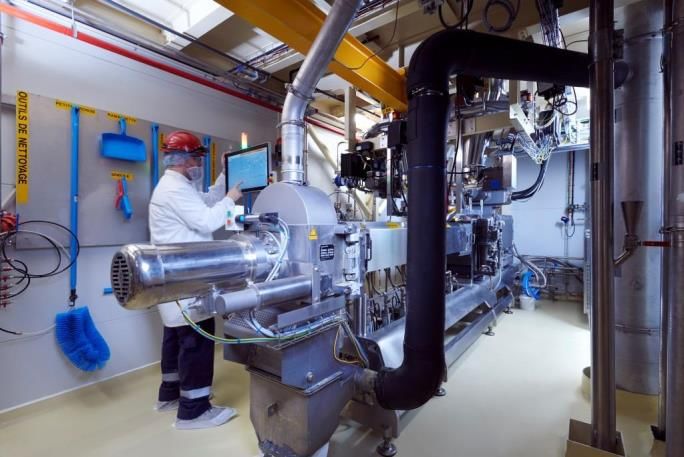
Ethanol – important element to decarbonize
the transport sector

                                          High-quality fuel
   Domestic
                                           which can be
 renewable raw
                                           used in petrol
    materials
                                              engines

                  Climate-friendly fuel
                 produced sustainably

                                                        CropEnergies AG, 5 February 2020   3
Investors Presentation 5 February 2020 - Dr. Stephan Meeder, CFO - CropEnergies AG
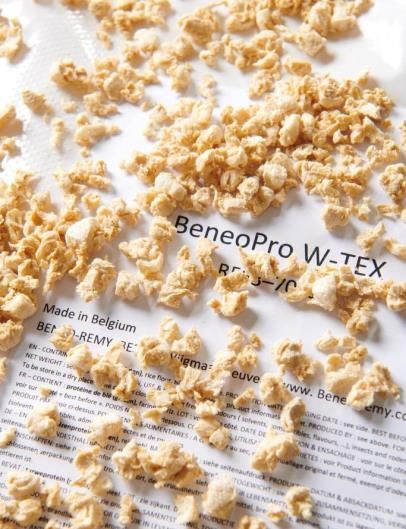
Ethanol: 70% less GHG emissions compared
to fossil fuels*

 The GHG values of all elements in the value-added chain are added up
 The emissions from ethanol when used in combustion engines is zero
 European ethanol reduces annual GHG emissions by >10 Mt**

    Cultivation                        Transport    Ethanol      Ethanol        CO2
      Grain                              Grain     Production   Transport   Liquefaction

  *83,8 gCO2eq/MJ **Own calculations

                                                                                           CropEnergies AG, 5 February 2020   4
Investors Presentation 5 February 2020 - Dr. Stephan Meeder, CFO - CropEnergies AG
Renewable ethanol – advantages

 Ethanol…                                                                                      Blending
      As direct blend to petrol (e.g. E5, E10, E85)
                                                                                                      Ethanol
      As component in ETBE (octane booster)
                                                                                                       Petrol

 E10 reduces CO2, NOx and particulate matter                                                E5 E10 E20 E85
      WLTP* benchmark, label in tank flap of all new cars
      Potential savings (EU): >20 Mt CO2eq (8 million less cars on the road)                      Super E10
                                                                                Super (E5)         Measurement:          Super E10
                                                                                Reference          particulate matter    Measurement: NOx
                                                                                                    Reduction by          Reduction by

 Potential for 20% ethanol blending (Super E20)
      Potential savings: >40 Mt CO2eq (16 million less cars on the road)
      Successful racing results (Porsche/Nürburgring)

                                                                                                                           Source: bdbe
  *Worldwide harmonized light-duty vehicle test

                                                                                      CropEnergies AG, 5 February 2020               5
Investors Presentation 5 February 2020 - Dr. Stephan Meeder, CFO - CropEnergies AG
Our co-products: Food and Fuel

 Raw materials are utilized completely

 Concept of co-production

           Vital Wheat Gluten                 ProtiGrain® – DDGS
               Valuable protein product for      High protein animal feed
               food and animal feed              from dried stillage
               industry

           Food-grade liquefied CO2           ProtiWanze® – CDS
               For food and beverages            Liquid protein animal feed
               industries                        from stillage

                                                                              CropEnergies AG, 5 February 2020   6
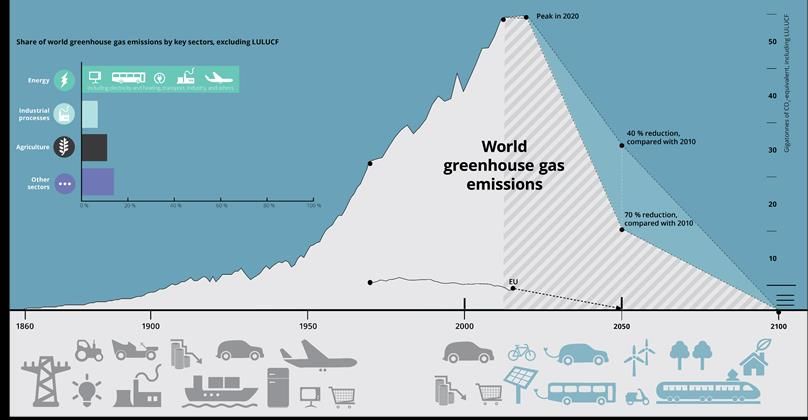
Investors Presentation 5 February 2020 - Dr. Stephan Meeder, CFO - CropEnergies AG
The ethanol markets

 World production                                       EU production
     2019e: 128 million m3 (+1%)                            2019e: 7.6 million m3 (-3%)
         Fuel applications: 109 million m³ (+1%)                                 Fuel applications: 5.2 million m³ (-4%)
     2020e: 129 million m3 (+1%)                            2020e: 7.7 million m3 (+1%)
         Fuel applications: 110 million m³ (+1%)                                 Fuel applications: 5.3 million m³ (+2%)

                                                                                   Ethanol production in the EU [M m3]
                                                                            10                   fuel          non-fuel

                                                                            8

                                                            (in Mio. m 3)
                                                                            6

                                                                            4

                                                                            2

                                                                            0
                                                                                  2014   2015   2016    2017     2018     2019e    2020e
                                    Source: F.O.Licht                                                                     Source: F.O.Licht

                                                                                                                                  CropEnergies AG, 5 February 2020   7
Investors Presentation 5 February 2020 - Dr. Stephan Meeder, CFO - CropEnergies AG
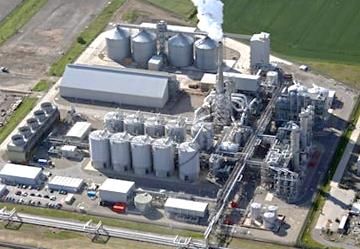
Market – E10 availability increases

 Increasing blending obligations in EU countries in 2020               EU sales fuel ethanol [Mm3]
                                                                  8              Other EU            Germany
      6% GHG-target 2020 requires more non-fossil alternatives   6
                                                                                 France              UK
                                                                                                          0.8
      RED II: 1G cap max 7% but not more than 2020 + 1%          4
                                                                           0.8
                                                                           0.9
                                                                                            0.7
                                                                                            0.9           0.9

                                                                           1.5              1.5           1.5
                                                                  2
                                                                           2.3              2.5           2.7
 EU market 2020e [Mm³]                                           0
                                                                          2018           2019e        2020e
     Production:   5.3     +2% (add. 2.4 non-fuel)                                           Source: F.O. Licht

     Consumption: 5.9      +6% (add. 2.6 non-fuel)                    E10 availability across Europe

 E10 available in more European countries
     In the Netherlands since 1 Oct 2019
     Slovakia, Hungary and Denmark as of 1 Jan 2020
     2020 plans: Austria, Lithuania, Latvia

                                                                                                     Source: ePURE

                                                                  CropEnergies AG, 5 February 2020              8
Investors Presentation 5 February 2020 - Dr. Stephan Meeder, CFO - CropEnergies AG
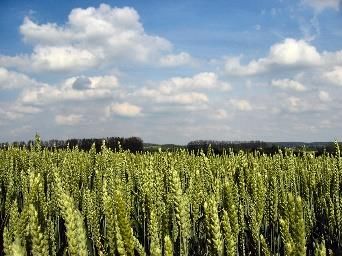
DE: National climate protection law and
emission trading system adopted
                                                                                              GHG emissions in Germany
                                                                                                 – reality and targets
 National Climate protection law                                                                     [Mt CO2eq]
     Binding statutory emission limits for all sectors                               1,000
                                                                                               866
                                                                                                             813
                                                                                                                              Transport
                                                                                                                              Other Non-ETS*
                                                                                       800                                    Energy
     Transport: reduction from 150 Mt CO2eq in 2020 to 95 Mt CO2eq in 2030                    196
                                                                                                             186              Industry
                                                                                                                            543
                                                                                       600
                                                                                               311           280             140
                                                                                       400
                                                                                                                             175
 National emission trading system                                                     200
                                                                                               197           197
                                                                                                                             133
                                                                                                                                            375
                                                                                               162           150
     Applicable on fossil fuels in transport and heating
                                                                                                                             95
                                                                                          0
                                                                                              2018          2020           2030            2040
     2021 to 2025: ”fixed price period“ – political agreement to start with 25 €/t               * in particular: buildings, agriculture, w aste

       CO2 gradual increase to 55 € until 2025                                                  GHG emissions from fuels
                                                                                                             [kg CO2eq/liter]
     From 2026 on: auctioning of CO2 certificates                                        4      3.4
                                                                                                              3.0
                                                                                          3                                 2.7

     Call for additional measures to achieve goals:

                                                                                                  2.8
                                                                                          2

                                                                                                               2.3

                                                                                                                             2.1
                                                                                          1
         Increase GHG target from 6% (2020) to 16% (2030)                                                                               0.3

                                                                                                               0.7
                                                                                                  0.7

                                                                                                                             0.7
                                                                                          0
         Reform of energy tax from volume (litre)-base into CO2-pricing

                                                                                                     combustion               upstream
                                                                                      CropEnergies AG, 5 February 2020                       9
Investors Presentation 5 February 2020 - Dr. Stephan Meeder, CFO - CropEnergies AG
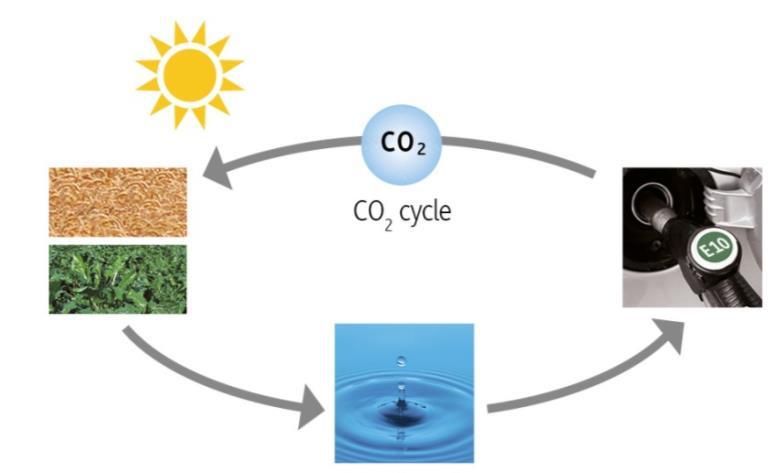
Profitability drivers

                                                                                                                                                  700
 Higher ethanol and lower raw material prices in                                                       1st   -   3rd   quarter                         Fuel EtOH T2 FOB Rdm. (1M)
         Ethanol*:               € 605 (475)             /m3                                                                                     600
      Grain**:                   € 178 (187) /t
                                                                                                                                                  500

                                                                                                                                  [€/t or €/m3]
 Raw materials prices on moderate level                                                                                                          400             Gross profit for wheat-EtOH

      World grain harvest*** 2019/20 at 2,162 Mt (+1%)
                                                                                                                                                  300
      World stocks lower at 594 Mt (-4%)
                                                                                                                                                                   Net raw material costs
      EU harvest 318 Mt (+9%) above consumption of 290 Mt                                                                                        200

                                                                                                                                                                   Euronext Paris wheat No. 2
                                                                                                                                                  100
 CE benefits from “natural hedge”
      Strong price correlation between grains and proteins

   *Ethanol T2 FOB Rdam ** Wheat (Euronext Paris), next date of expiry *** All varieties, except rice

                                                                                                                                                        CropEnergies AG, 5 February 2020    10
European ethanol prices [€/m3]*

 *1M future ethanol T2 FOB Rotterdam

                                       CropEnergies AG, 5 February 2020   11
EU climate goals – RED II

                                               EU Commission aims at climate-neutral
          Greenhouse gas emissions in the EU            Europe in 2050
                      [Mt CO2eq]
                                                  2030 GHG-target: 40% reduction
                                                       (compared to 1990) –
                                                      increase to 55% under discussion

                                                  RED II published on 18 Dec. 2018

                                               National implementation until mid 2021

                                               RED II: more renewables to reduce CO2
                                                      footprint of energy usage

                                                  At least 32% renewable energies
                                                         in 2030 (2017: 17%)
                                                 Transport: at least 14% renewables
                                                  Volume cap for biofuels from arable crops
                                                Promotion of biofules from waste and residues

                                                            CropEnergies AG, 5 February 2020    12
RED-II: Overall target of 14% in 2030 –
the “toolbox“

  Arable crops               Annex IX-A                Annex IX-B                Electricity

 Up to 7%                 Min. 0.2% in 2022        Max. 1.7%, but still    Important component
 Local, sustainable       Min. 1.0 % in 2025
                                                      x2 versus today          in the future
                                                     UCO imports: 10x        But: discretionary
 Proteins                 At least 3.5% in 2030
                                                      within last 10 years     multiplier (x4) does not
 Commitment to 1G         Strong market                                      save a single gram of
                                                     Compatibility with
  as reliable basis for     potential                                          CO2
  low-emission                                        law on waste needs
                           Very capital intense      to be ensured           Extension only
  transport sector
  necessary                                                                    reasonable if
                           Investment security                                additional electricity
                            and investment                                     will be produced
                            incentives decisive

                                                                                                          CropEnergies AG, 5 February 2020   13
Strategic outlook

 Demand: chance for new impulses
     GHG reduction targets and renewable energy                                                              Ethanol chemistry

     CO2 pricing can complement GHG sector targets for transport
                                                                                                          Liquefied CO2

                                                                              Ethanol                        Neutral alcohol

 Strategy
     Short-term: optimise production sites, protein co-products                                              Gluten
     Medium-term: R&D process innovation, alternative feedstocks
     Long-term: R&D biochemicals, expansion of product portfolio /- growth
                                                                                                         Fuel ethanol

                                                                                    ProtiGrain®

                                                                                              Animal feed

                                                                                        CropEnergies AG, 5 February 2020          14
Wheat proteins as meat alternative

 BeneoPro W-Tex as meat alternative
      Investment in the amount of € 4.3 million by sister company Beneo
      Start of operation: 1st March 2019
      Replacement of meat in products such as burgers, nuggets and bolognese
      Facility is operated by BioWanze
      Sales are concluded by Beneo

 Trend: meat replacement
      Growing demand for plant-based proteins worldwide
      Average annual growth rate of 5.5%* expected in Europe in the next 5 years

  *Global Data Market Analyzer

                                                                                    CropEnergies AG, 5 February 2020   15
Biorefinery of the future

 Source: ePURE

                            CropEnergies AG, 5 February 2020   16
Our locations

                                                                                      Wilton, UK
                                                                                     Ensus UK Ltd

    Trading office
    São Paulo, Brazil

Ryssen Chile SpA,
Santiago de Chile, Chile

                                             Tank storages
                                             Rotterdam           Tank storages         Zeitz, Germany
                                                                 Amsterdam       CropEnergies Bioethanol GmbH

                        Loon-Plage, France
                                                             Wanze, Belgium
                        Ryssen Alcools SAS
                                                              BioWanze SA

                                                                                                         CropEnergies AG, 5 February 2020   17
The production sites of CropEnergies AG

                                                                       CropEnergies AG
                                                                        Mannheim - Germany

       Zeitz – Germany                                 Wanze – Belgium                       Loon-Plage – France                             Wilton – UK
 CropEnergies Bioethanol GmbH                           BioWanze SA                           Ryssen Alcools SAS                             Ensus UK Ltd.

Annual capacity:                              Annual capacity:                        Annual capacity:                            Annual capacity:

400,000 m³ ethanol                            300,000 m³ ethanol                      >100,000 m³ ethanol for fuel applications   400,000 m³ ethanol
thereof up to 60,000 m3 neutral alcohol       60,000 t wheat gluten                    90,000 m³ ethanol for traditional and      350,000 t DDGS
>300,000 t ProtiGrain® (DDGS)                 >400,000 t ProtiWanze®                  technical applications
100,000 t liquefied CO2

Raw materials: grain and sugar syrups         Raw materials: wheat and sugar syrups   Raw material: raw alcohol                   Raw material: grain

                                                                                      Ethanol for traditional &
       ProtiGrain®                        Gluten                 Ethanol as Fuel                                           ProtiWanze®               Liquefied carbon
                                                                                       technical applications                                            dioxide

   Capacity: more than 1.3 million m³ ethanol and more than 1 million tonnes food and animal feed per year

                                                                                                                                                                  CropEnergies AG, 5 February 2020   18
Financials 2019/20 & Outlook

                               CropEnergies AG, 5 February 2020   19
Outlook 2019/20

 Insider information publication according to section 17 MAR of 16 December 2019:
     Revenues are now expected to reach around € 900 million
     Operating profit is expected to be approximately € 100 million
     This is equivalent to an EBITDA of around € 145 million

                                                                               CropEnergies AG, 5 February 2020   20
Highlights 9M 2019/20

 Ethanol production                           729 (771) ,000 m³                                     - 6%
 Revenues                                 667.6 (596.1) million €                                 + 12%

 EBITDA                                    101.9 (48.5) million €            + 53 million €
 Operating profit                           70.3 (19.1) million €            + 51 million €
 Net earnings                               50.2 (12.9) million €            + 37 million €

 Net financial assets (vs. 28 Feb 2019)    89.7 (26.9*) million €            + 63 million €

  *Incl. adjustments from IFRS 16

                                                                CropEnergies AG, 5 February 2020       21
Revenues

                                                                                                                                                Revenues / Production
(in € million)                                                             9M 19/20           9M 18/19            Δ                                [M€ / 1,000 m3]
                                                                                                                                1,000
                                                                                                                                                847
                                                                                                                                                            771            729
Revenues                                                                      667.6              596.1           + 12%            800

EBITDA*                                                                       101.9               48.5      > + 100%              600           679                        668
 Margin                                                                      15.3%               8.1%               -                                        596
                                                                                                                                  400
Depreciation*                                                                 -31.6              -29.3            - 8%
                                                                                                                                  200
Operating profit                                                               70.3               19.1      > + 100%
                                                                                                                                       0
                                                                                                                                                9M           9M             9M
                                                                                                                                               17/18        18/19          19/20
 Production decrease by 6%
 Production capacity utilisation adjusted to suit market conditions and to carry
                                                                                                                                           Revenues 9M 2019/20
    out regular maintenance activities
 Increase in revenues due to significantly higher sales prices for ethanol                                                                     78%
                                                                                                                                                                     21%
        Average ethanol price**: €                              605/m3        (€   475/m3   in previous year)

                                                                                                                                                                           1%

                                                                                                                             Ethanol       Food and animal feed products    Other revenues

  *Without restructuring costs and special items **Ethanol FOB Rotterdam

                                                                                                                         CropEnergies AG, 5 February 2020                     22
EBITDA

                                                                                                           EBITDA [M€]
                                                                                             120
 (in € million)                                     9M 19/20   9M 18/19      Δ                                               102
                                                                                                         88
                                                                                               90
 Revenues                                              667.6      596.1     + 12%
 Overall performance                                   651.2      601.4      + 8%              60
                                                                                                                        48
 Cost of materials*                                   -481.2     -481.1      - 0%
                                                                                               30
 Spread (gross)                                        170.0      120.3     + 41%

    in % of overall performance                       26.1%      20.0%           -              0
                                                                                                        9M          9M        9M
 Further operating expenses/income*                    -68.1      -71.8      + 5%                      17/18       18/19     19/20

 EBITDA*                                               101.9       48.5   > + 100%                    Spread (gross) / in % of
                                                                                                     overall performance [M€]
                                                                                              200
                                                                                                                             170
 EBITDA benefits from first-time adoption of IFRS 16                                                   158
                                                                                              150
 EBITDA doubled despite higher raw material prices                                                                 120
                                                                                              100                            26%
                                                                                                        24%
                                                                                                                   20%

                                                                                               50

                                                                                                 0
                                                                                                        9M          9M        9M
   *Without restructuring costs and special items                                                      17/18       18/19     19/20
                                                                                     CropEnergies AG, 5 February 2020           23
Operating profit

                                                                                                        Operating profit [M€]
                                                                                               80
(in € million)                                     9M 19/20   9M 18/19       Δ                                                70
                                                                                                         59
Revenues                                              667.6      596.1      + 12%              60

EBITDA*                                               101.9       48.5   > + 100%
                                                                                               40
 Margin                                              15.3%       8.1%            -
Depreciation*                                         -31.6      -29.3       - 8%              20
                                                                                                                        19

Operating profit                                       70.3       19.1   > + 100%
                                                                                                0
 Margin                                              10.5%       3.2%            -                      9M          9M        9M
                                                                                                       17/18       18/19     19/20

 Slightly higher depreciation from first-time adoption of IFRS 16
 Increase in operating margin from 3.2% to 10.5% yoy

  *Without restructuring costs and special items

                                                                                     CropEnergies AG, 5 February 2020           24
Net earnings for the period

                                                                                                      Net earnings for the period
                                                                                                60               [M€]
(in € million)                                     9M 19/20    9M 18/19       Δ                                                50
Revenues                                              667.6       596.1      + 12%              45        42

EBITDA*                                               101.9        48.5    > + 100%
                                                                                                30
Operating profit                                       70.3        19.1    > + 100%
Restructuring costs / special items                     0.0        10.1    < - 100%                                      13
                                                                                                15
At equity result                                        0.1         0.1       + 2%
                                                                                                 0
Income from operations                                 70.5        29.4    > + 100%                      9M          9M        9M
Financial result                                        -2.6        -1.0   < - 100%                     17/18       18/19     19/20

Earnings before income taxes                           67.9        28.4    > + 100%
Taxes on income                                       -17.6       -15.5      - 14%

Net earnings for the period                            50.2        12.9    > + 100%

Earnings per share (in €)                              0.58        0.15    > + 100%

 Financial result increases due to unrealized currency effects
 Tax rate drops to 26 (55)%
  *Without restructuring costs and special items

                                                                                      CropEnergies AG, 5 February 2020          25
Cash flow

                                                                                                                                           Cash flow (+) /
(in € million)                                                               9M 19/20     9M 18/19        Δ                             Investments* (-) [M€]
                                                                                                                                90                          81
Cash flow                                                                         80.7         42.9      + 88%
Change in net working capital                                                     15.3          7.1    > + 100%                 60
                                                                                                                                         43
Net cash flow from operating activities                                           96.0         49.9      + 92%
                                                                                                                                30
Investments in property, plant et al.                                            -19.7          -8.5   < - 100%
Payments into current financial investments                                      -14.9          0.0             -
                                                                                                                                  0
Cash flow from investing activities                                              -34.6          -8.5   < - 100%                                  -8
                                                                                                                               -30                                   -20
Cash flow from financing activities                                              -52.2        -64.9      + 20%
                                                                                                                                            9M                  9M
Exchange rate changes et al.                                                       1.5          0.0             -                          18/19               19/20
                                                                                                                                                 *excl. financial investments
Increase/Decrease in cash and cash equivalents                                    10.7        -23.5           + 0.0
                                                                                                                -

                                                                             30/11/2019   30/11/2018      Δ
Net financial assets**                                                            89.7         56.5      + 59%
                                                                                                            + 0.0

 Higher investments in PPE to enhance production plants
 Significant improvement of net financial assets
   **Net financial assets as of 30/11/2019: excl. adjustments from IFRS 16

                                                                                                                      CropEnergies AG, 5 February 2020                 26
Balance sheet structure and financial ratios

                                                                                                                         Shareholders' equity [M€]
                                                                                                                  500
 (in € million)                                                      30/11/2019    30/11/2018      Δ
                                                                                                                                                  481
                                                                                                                  480
 Assets
 Non-current assets                                                        382.4       385.8      - 1%            460
 Current assets                                                            274.6       207.2    + 33%                                       442
                                                                                                                  440       432
 Total assets                                                              657.0       593.1    + 11%
                                                                                                                  420
 Liabilities
                                                                                                                  400
 Shareholders' equity                                                      480.6       442.3     + 9%                    30/11/17 30/11/18 30/11/19
 Non-current liabilities                                                    57.8        49.7    + 16%
 Current liabilities                                                       118.6       101.1    + 17%

 Total liabilities and equity                                              657.0       593.1    + 11%

 Net financial assets*                                                     89.7         56.5    + 59%
 Equity ratio                                                              73%          75%          -

 Strong cash base
 Increase in equity reflects positive earnings situation
  *Net financial assets as of 30/11/2019: excl. adjustments from IFRS 16

                                                                                                         CropEnergies AG, 5 February 2020          27
Financial Calendar                                                                                                          Contact
13 May 2020:                       Annual report and press and analysts’ conference                                         CropEnergies AG
                                   financial year 2019/20
                                                                                                                            Maximilianstraße 10
8 July 2020:                       Statement for the 1st quarter of 2020/21                                                 68165 Mannheim

14 July 2020:                      Annual General Meeting 2020                                                              www.cropenergies.com

7 October 2020:                    Report for the 1st half of 2020/21

13 January 2021:                   Statement for the 1st-3rd quarter of 2020/21                                              Investor Relations                                Public Relations / Marketing

Stock Information                                                                                                            Heike Baumbach                                    Nadine Dejung-Custance
                                                                                                                             Phone: +49 (621) 71 41 90-30                      Phone: +49 (621) 71 41 90-65
ISIN:                             DE000A0LAUP1
                                                                                                                             ir@cropenergies.de                                presse@cropenergies.de
Symbol:                           CE2

Bloomberg / Reuters:              CE2 GY / CE2G.DE

Transparency standard:            Prime Standard
Disclaimer
This presentation contains forward-looking statements based on assumptions and estimates made by the executive board of CropEnergies AG. Although the executive board may be convinced that these assumptions and
estimates are reasonable, the future actual developments and future actual results may vary considerably from the assumptions and estimates due to many external and internal factors. For example, matters to be mentioned
in this connection include changes in the general economic conditions, competitive product and pricing pressures and developments in the regulatory framework. CropEnergies AG assumes no responsibility and accepts no
liability for future developments and future actual results achieved being the same as the assumptions and estimates included in this presentation. This presentation includes percentage and number rounding.

                                                                                                                                                                                     CropEnergies AG, 5 February 2020         28
You can also read