International Seaways, Inc - Fourth Quarter 2020 Earnings Presentation March 12, 2021
←
→
Page content transcription
If your browser does not render page correctly, please read the page content below
International Seaways, Inc.
       Fourth Quarter 2020
      Earnings Presentation
         March 12, 2021
Disclaimer
Forward-Looking Statements
During the course of this presentation, the Company (International Seaways, Inc. (INSW)) may make forward-looking statements or provide
forward-looking information. All statements other than statements of historical facts should be considered forward-looking statements. Some of
these statements include words such as ‘‘outlook,’’ ‘‘believe,’’ ‘‘expect,’’ ‘‘potential,’’ ‘‘continue,’’ ‘‘may,’’ ‘‘will,’’ ‘‘should,’’ ‘‘could,’’ ‘‘seek,’’ ‘‘predict,’’
‘‘intend,’’ ‘‘plan,’’ ‘‘estimate,’’ ‘‘anticipate,’’ ‘‘target,’’ ‘‘project,’’ ‘‘forecast,’’ ‘‘shall,’’ ‘‘contemplate’’ or the negative version of those words or other
comparable words. Although they reflect INSW’s current expectations, these statements are not guarantees of future performance, but involve a
number of risks, uncertainties, and assumptions which are difficult to predict. Some of the factors that may cause actual outcomes and results to
differ materially from those expressed in, or implied by, the forward-looking statements include, but are not necessarily limited to, vessel
acquisitions, general economic conditions, competitive pressures, the nature of the Company’s services and their price movements, and the ability
to retain key employees. The Company does not undertake to update any forward-looking statements as a result of future developments, new
information or otherwise.
Non-GAAP Financial Measures
Included in this presentation are certain non-GAAP financial measures, including Time Charter Equivalent (“TCE”) revenue, EBITDA, Adjusted
EBITDA, and total leverage ratios, designed to complement the financial information presented in accordance with generally accepted accounting
principles in the United States of America because management believes such measures are useful to investors. TCE revenues, which represents
shipping revenues less voyage expenses, is a measure to compare revenue generated from a voyage charter to revenue generated from a time
charter. EBITDA represents net (loss)/income before interest expense, income taxes and depreciation and amortization expense. Adjusted EBITDA
consists of EBITDA adjusted for the impact of certain items that we do not consider indicative of our ongoing operating performance. Total leverage
ratios are calculated as total debt divided by Adjusted EBITDA. We present non-GAAP measures when we believe that the additional information is
useful and meaningful to investors. Non-GAAP financial measures do not have any standardized meaning and are therefore unlikely to be
comparable to similar measures presented by other companies. The presentation of non-GAAP financial measures is not intended to be a substitute
for, and should not be considered in isolation from, the financial measures reported in accordance with GAAP. See Appendix for a reconciliation of
certain non-GAAP measures to the comparable GAAP measures.
This presentation also contains estimates and other information concerning our industry that are based on industry publications, surveys and
forecasts. This information involves a number of assumptions and limitations, and we have not independently verified the accuracy or completeness
of the information.
Additional Information
You should read the Company’s Annual Report on Form 10-K for the year ended December 31, 2020, and other documents the Company has filed
with the SEC for additional information regarding the Company, its operations and the risks and uncertainties it faces. You may obtain these
documents for free by visiting EDGAR on the SEC Web site at www.sec.gov, or from the Company’s website at www.intlseas.com.

                                                                                                                                                       2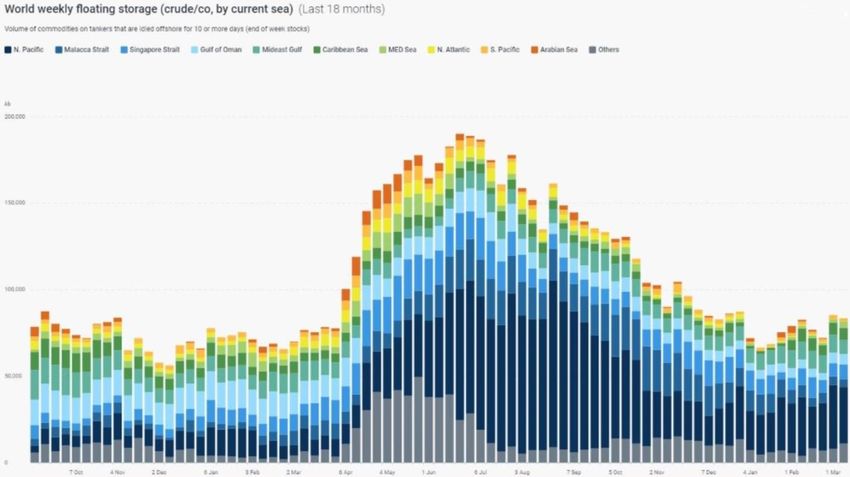
Business Review
  Lois K. Zabrocky
  President & CEO

                     3
Fourth Quarter 2020 Highlights and Recent Developments

•   Increased Financial Strength During Weak Quarter
    o   Signed 10-year extensions for our FSO JVs in direct continuation of the current 5
        year contracts. New contracts will generate approximately $20 million annually
        for INSW continuing through 2032
    o   Sold three unencumbered ships for over $60 million in cash: two older VLCCs
        and one older Aframax. 11 unencumbered ships remain in fleet
    o   Ended the quarter with over $215 million in cash and $255 million liquidity
    o   Net loan to value of 33% continues to be one of the lowest in the space
•   Constructing Three Dual Fuel VLCCs
    o   Subsequent to the end of the quarter, INSW announced contract to build three
        newbuilding dual-fuel LNG VLCCs
        •   Ships will have seven-year time charters with Shell
        •   These VLCCs will be 40% more efficient than a 10 year old VLCC and 20%
            more efficient than a modern ECO VLCC.
        •   Highly efficient, the ships will substantively outperform 2025 Phase III EEDI
            targets, keeping with Seaway’s commitment to ESG principles
•   Capital Allocation Strategy Execution and Update
    o   Share repurchase authorization stands at $50 million
    o   Regular $0.06/share quarterly dividend declared in February, $0.24/share paid in
        2020
•   Full Year and Fourth Quarter 2020 Results
    o   2020 net loss $5.5 million, or $0.20/share. Excluding $114.6 million in
        impairments and deferred finance cost write-offs and $16 million non-cash
        deferred tax charge related to the FSO extensions, net income was $125.2
        million, or $4.39/share, our highest on record.
    o   Fourth Quarter net loss $116.9 million or $4.18/share. Excluding $85.9 million in
        vessel impairments and $16 million related to the FSO extensions, net loss was
        $14.6 million or $0.52/share

                                                                                            4
Market Update – Oil Supply, Demand and Implications
• Oil Supply and Demand
o IEA’s February forecast estimates 2021 demand to be up 5.4 mb/d, recovering about 60% of the volume lost in 2020, and
increasing to 99.2 mb/d by Q4 2021
o EIA expects a similar 5.4 mb/d increase in demand for 2021 and 3.5 mb/d for 2022
o IEA reported global oil stocks were 62.8 mb below the May 2020 peak, which is needed to set the stage for tanker recovery
o OPEC meeting on March 3 did not lead to a lifting of production quotas aside from small amounts for Russia and Kazakhstan
o Floating oil storage has decreased to pre-pandemic levels
Source: IEA, EIA, Kpler
5Market Update – Ship Supply
• Orderbook Update
o Orderbook remains at historical lows: VLCC Orderbook Recycling Candidates
• VLCC 8.1%
• Suezmax 10.0%
20
• Aframax/LR2 10.2% 18
• Panamax/LR1 1.8% 16
• MR 6.1%
14
o 31 VLCCs ordered in 2019; 41 in 2020; 10 cancelled recently
Million DWT
o Ordering tempered by uncertainty surrounding markets, 12
decarbonization, and higher steel and newbuilding prices
10
• Recycling potential
8
o The VLCC fleet is aging – 208 (25%) ships out of a fleet of 836
are 15 years old or older and 64 (8%) are already 20 years old or 6
older. This is equal to the entire VLCC orderbook
4
o A further 13 VLCCs will reach age 20 during the balance of 2021
o At age 15 and every 2.5 years thereafter significant investment 2
required to continue to trade
0
o As ships reach ballast water treatment deadlines, even greater
19
18
17
16
15
2021
2022
2023
20+
capital expenditure is required to keep trading
o After a record 31 ships recycled in 2018, only four VLCCs were Delivery Year Age as of March 2021
recycled in both of 2019 and 2020. At current spot rates and
steel prices, we expect to see recycling increase
Source: Clarksons
6Financial Review
Jeffrey D. Pribor
SVP & CFO
7Financial Summary – TCE Revenue & Adjusted EBITDA1
($ millions)
4Q 2019 vs 4Q 2020
Quarterly TCE Revenue Quarterly Adjusted EBITDA
$118
$25
$53
$9 $72
$93
$44 ($5) LTM
2019 Q4 2020 Q4 2019 Q4 2020 Q4
Adjusted
Crude Tankers Product Tankers
EBITDA1:
FY 2019 vs FY 2020
$220.1M
Annual TCE Revenue Annual Adjusted EBITDA
$402
$340 $83
$80
$220
$319 $165
$260
FY 2019 FY 2020 FY 2019 FY 2020
Crude Tankers Product Tankers
1 See Appendix for TCE Revenue and EBITDA reconciliation
8Financial Summary – Q4 & Q1 Earnings Update
2020 Q4 Actual 2021 Q1 Booked to Date 1
SPOT TC OVERALL SPOT TC OVERALL
TCE TCE TCE Fixed TCE Fixed TCE Fixed TCE
VLCC $17,500 $63,600 $29,400 93% $16,800 100% $47,000 94% $22,200
VLCC < 15 $19,200 $70,100 $29,500 93% $16,800 100% $43,900 93% $19,900
Suezmax $10,400 --- $10,400 86% $10,900 0% $0 86% $10,900
Aframax/LR2 $9,100 $17,400 $10,100 91% $10,400 100% $17,800 94% $12,400
Panamax/LR1 $13,600 $14,600 $14,000 72% $13,000 74% $10,700 73% $11,900
MR $10,000 --- $10,000 67% $9,400 0% $0 67% $9,400
1As of March 11, 2021
Overall 2020 Q4 VLCC TCE includes 260 time charter days at $63,600/day. Overall 2021 Q1 VLCC TCE includes 149 time charter days at $47,000/day
Overall 2020 Q4 Afra/LR2 TCE incudes 52 time charter days at $17,400/day. Overall 2021 Q1 Afra/LR2 TCE includes 90 time charter days at $17,800/day 9
Overall 2020 Q4 Pana/LR1 TCE includes 297 time charter days at $14,600/day. Overall 2021 Q1 Pana/LR1 TCE includes 341 time charter days at 10,700/day
Rates exclude average pool fees of approximately $654/day. Excludes prior period accounting adjustmentsLean and Scalable Model – Cash Breakevens
TCE breakeven levels allow INSW to navigate low points in the tanker cycle
while providing significant operating leverage in rising markets
INSW Daily OPEX excludes DDK deviation bunkers, insurance claims and one-off expenses
G&A for the Lightering segment is excluded
Vessels that have been sold are excluded 10
Only includes owned vessels. Two bareboat-in Aframaxes vessels have charter hire and OPEX expenses of approx. $16,400 per day
Breakevens are basis Revenue DaysFinancial Summary – Change in Cash Balance
11Strong Financial Position – Balance Sheet
Strong balance sheet protects INSW during low portions of tanker cycle
December 31, 2020
($ M)
Assets Liabilities INSW Book Value of FSO JV as of
Current Liabilities (including $61M current December 31, 2020: $129 million
Cash and Equivalents $199 portion of long term debt and $9M current $109
portion of lease liabilities)
Other Current Assets $57 Long Term Debt $474 • Net Debt to Total Capitalization: 25%
Long Term Portion of Lease Liabilities $10
Other Long Term Liabilities $21 • Net Debt to LTM EBITDA: 1.45x
Total Current Assets $257 Total Liabilities $614 • Net Loan to Asset Value1: 33%
Restricted Cash $16 • Portion of debt which is fixed or hedged: 96%
Vessels $1,144
Right of Use Assets $22 Equity
Other Long Term Assets $147 Total Equity $972
Total Assets $1,587 Total Liabilities and Equity $1,587
INSW Debt at 12/31/20
Principal Balance ($M) Maturity Rate Quarterly Amortization
Core Facility $271.6 1/23/2025 LIBOR +240 bps $9.5M
Sinosure Credit Facility $246.1 2027-2028 LIBOR +200 bps $5.9M
8.5% Senior Notes $25.0 6/30/2023 8.50% 0
Total Debt Balance $542.7
Undrawn Revolver $40.0 LIBOR +240 bps
1 Conventional tanker fleet only; excludes value of FSO joint ventures
12Summary
• Increased Financial Strength During Weak Quarter
o Signed 10-year extensions for our FSO JVs in direct continuation of the current 5
year contracts. New contracts will generate approximately $20 million annually
for INSW continuing through 2032
o Sold three unencumbered ships for over $60 million in cash: two older VLCCs
and one older Aframax. 11 unencumbered ships remain in fleet
o Ended the quarter with over $215 million in cash and $255 million liquidity
o Net loan to value of 33% continues to be one of the lowest in the space
• Constructing Three Dual Fuel VLCCs
o Subsequent to the end of the quarter, INSW announced contract to build three
newbuilding dual-fuel LNG VLCCs
• Ships will have seven-year time charters with Shell
• These VLCCs will be 40% more efficient than a 10 year old VLCC and 20%
more efficient than a modern ECO VLCC.
• Highly efficient, the ships will substantively outperform 2025 Phase III EEDI
targets, keeping with Seaway’s commitment to ESG principles
• Capital Allocation Strategy Execution and Update
o Share repurchase authorization stands at $50 million
o Regular $0.06/share quarterly dividend declared in February, $0.24/share paid in
2020
• Full Year and Fourth Quarter 2020 Results
o 2020 net loss $5.5 million, or $0.20/share. Excluding $114.6 million in
impairments and deferred finance cost write-offs and $16 million non-cash
deferred tax charge related to the FSO extensions, net income was $125.2
million, or $4.39/share, our highest on record.
o Fourth Quarter net loss $116.9 million or $4.18/share. Excluding $85.9 million in
vessel impairments and $16 million related to the FSO extensions, net loss was
$14.6 million or $0.52/share
13Appendix
14Estimated Drydock and CAPEX costs and Out-of-Service Days
($ millions)
2020 Out-of-Service Days 2021 Out-of-Service Days
Q1 (A) Q2 (A) Q3 (A) * Q4 (A) FY 2020 Q1 Q2 Q3 Q4 FY 2021
VLCC 390 203 -86 109 616 VLCC 95 107 10 66 277
Suezmax 0 2 4 0 7 Suezmax 3 3 2 2 9
Aframax / LR2 8 30 0 19 57 Aframax / LR2 5 5 10 10 30
Panamax / LR1 16 7 275 501 800 Panamax / LR1 140 18 12 43 213
MR 43 -14 1 44 74 MR 6 5 23 7 41
456 229 195 674 1,553 249 138 56 127 570
2020 Drydock Costs 2021 Drydock Costs
Q1 (A) Q2 (A) Q3 (A) Q4 (A) FY 2020 Q1 Q2 Q3 Q4 FY 2021
VLCC $6.4 $4.8 $0.7 $0.7 $12.5 VLCC $1.9 $7.5 $0.0 $4.5 $13.9
Suezmax $0.0 $0.0 $0.0 $0.0 $0.0 Suezmax $0.0 $0.0 $0.0 $0.0 $0.0
Aframax / LR2 $0.8 $0.0 $0.0 $0.0 $0.8 Aframax / LR2 $0.0 $0.0 $0.1 $0.1 $0.2
Panamax / LR1 $0.1 $0.1 $2.6 $8.3 $11.1 Panamax / LR1 $7.2 $0.0 $0.0 $1.2 $8.5
MR $0.3 $0.0 $0.1 $0.8 $1.1 MR $0.3 $0.0 $1.6 $0.0 $1.9
$7.6 $4.9 $3.3 $9.8 $25.6 $9.5 $7.5 $1.7 $5.9 $24.5
2020 CAPEX Costs ** 2021 CAPEX Costs **
Q1 (A) Q2 (A) Q3 (A) Q4 (A) FY 2020 Q1 Q2 Q3 Q4 FY 2021
VLCC $11.2 $8.3 $3.6 $1.5 $24.7 VLCC $1.9 $4.7 $0.3 $1.8 $8.6
Suezmax $0.0 $0.0 $0.0 $0.0 $0.0 Suezmax $0.0 $0.0 $0.0 $0.0 $0.0
Aframax / LR2 $0.0 $0.0 $0.0 $0.1 $0.1 Aframax / LR2 $0.0 $0.2 $0.0 $0.0 $0.2
Panamax / LR1 $0.4 $3.7 $1.1 $1.7 $6.9 Panamax / LR1 $0.6 $0.0 $0.0 $0.0 $0.6
MR $0.4 $0.0 $0.8 $0.3 $1.5 MR $0.0 $0.0 $0.4 $0.0 $0.4
$12.0 $12.0 $5.5 $3.6 $33.2 $2.5 $4.8 $0.7 $1.8 $9.8
* Loss of Hire recovery relating to the Mulan of 113 out-of-service days is included in Q3
** Principally relates to Scrubber and BWTS costs
International Seaways, Inc.
15TCE Revenue Reconciliation
($ thousands)
4Q19 4Q20 LTM 4Q19 LTM 4Q20
Time charter equivalent revenues 117,595 52,953 339,919 402,005
Add: Voyage expenses 6,427 3,750 26,265 19,643
Shipping revenues 124,022 56,703 366,184 421,648
16Adjusted EBITDA Reconciliation
($ thousands)
All INSW 4Q19 4Q20 3Q20 LTM 4Q19 LTM 4Q20
Net income / (loss) 15,891 (116,889) 13,981 (830) (5,531)
Income tax provision 1 - - 1 1
Interest expense 14,281 7,823 7,999 66,267 36,712
Depreciation and amortization 18,945 18,182 19,014 75,653 74,343
EBITDA 49,118 (90,884) 40,994 141,091 105,525
Third-party debt modification fees - - - 30 232
Loss on disposal of vessels, net of impairments 280 85,923 12,834 308 100,087
Gain on sale of investment in affiliated companies (3,033) - - (3,033) -
Release of other comprehensive loss upon sale of
21,615 - - 21,615 -
investment in affiliated company
Write-off of deferred financing costs 3,215 - 572 3,558 13,073
Loss on extinguishment of debt 1,000 2 181 1,100 1,197
Adjusted EBITDA 72,195 (4,959) 54,581 164,669 220,114
17Chartered In Fleet
Charter-In Hire Details
• Time Charter-Ins:
– 1 MR vessel at 25% - redelivers March 2021 - Charter Hire expense for 2021: $0.1M
– 1 LR1 vessel that redelivers in August 2021 – Charter Hire expense for 2021 : $3.0M
• Bareboat-Ins:
– 2 Aframax vessels that redeliver in 2024 – Charter Hire expense for 2021 : $6.3M
• Lightering:
– 5 workboats that redeliver between December 2020 and July 2023 – Charter Hire expense for
2021 : $8.6M
International Seaways, Inc.
18INSW Fleet as of March 1, 2021
Ship Type Built DWT Ownership Ship Type Built DWT Ownership
Gener8 Chiotis VLCC 2016 300,973 Owned Seaways Leyte LR1 2011 73,944 Owned
Gener8 Success VLCC 2016 300,932 Owned Seaways Samar LR1 2011 73,920 Owned
Seaways Triton VLCC 2016 300,933 Owned Seaways Guayaquil LR1 2009 74,999 Owned
Seaways Diamond Head VLCC 2016 300,781 Owned Ice Victory LR1 2006 70,372 TC-in
Seaways Hendricks VLCC 2016 300,757 Owned Seaways Visayas LR1 2006 74,933 Owned
Seaways Tybee VLCC 2015 300,703 Owned Seaways Luzon LR1 2006 74,908 Owned
Seaways Kilimanjaro VLCC 2012 296,520 Owned Seaways Athens MR 2012 50,342 Owned
Seaways Mckinley VLCC 2011 296,305 Owned Seaways Milos MR 2011 50,378 Owned
Seaways Everest VLCC 2010 296,409 Owned Seaways Kythnos MR 2010 50,284 Owned
Seaways Raffles VLCC 2010 317,858 Owned Seaways Skopelos MR 2009 50,221 Owned
Seaways Tanabe VLCC 2002 298,561 Owned FSO Africa FSO 2010 432,023 JV 50%
Seaways Hatteras Suezmax 2017 158,432 Owned FSO Asia FSO 2009 432,023 JV 50%
Seaways Montauk Suezmax 2017 158,432 Owned
Seaways Redwood Aframax 2013 112,792 Owned
Seaways Yellowstone Aframax 2009 112,989 BB-in
Seaways Yosemite Aframax 2009 112,905 BB-in
Seaways Shenandoah LR2 2014 112,691 Owned
Seaways Reymar Panamax 2004 69,501 Owned Trading Crude
Seaways Hellas Panamax 2003 69,636 Owned Trading Products
Seaways Jademar Panamax 2002 69,708 Owned JV Ships
Seaways Goldmar Panamax 2002 69,684 Owned
Seaways Rosemar Panamax 2002 69,628 Owned
Seaways Silvermar Panamax 2002 69,609 Owned
Seaways Rubymar Panamax 2002 69,599 Owned
19You can also read