2016 Budget - Toronto Community Housing 2016 Budget
←
→
Page content transcription
If your browser does not render page correctly, please read the page content below

2016 Budget
Agenda

1.   Overview of Toronto Community Housing
2.   Current financial position
3.   2016 budget overview
4.   2017 outlook

                                             2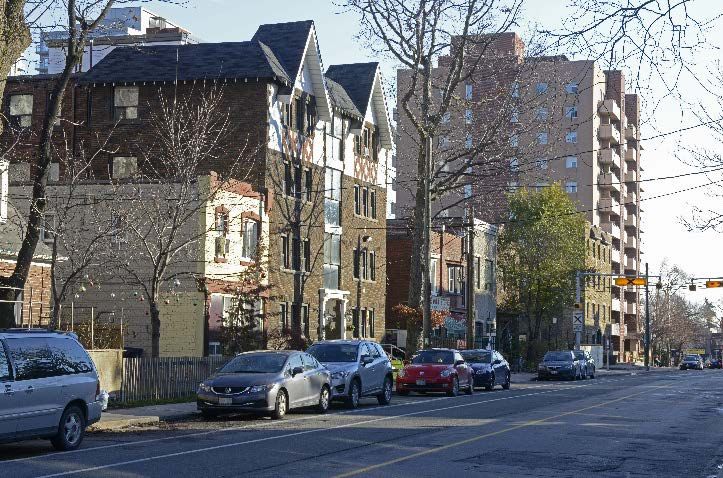
Overview of Toronto Community
Housing

                                3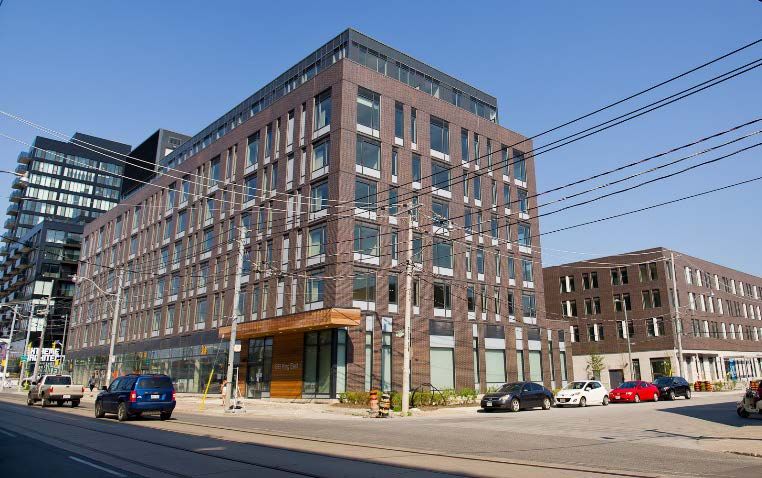
About us
We’re Canada’s largest social housing provider

• 60,000 households            Management of Toronto’s
                              93,404 social housing units
• 110,000 residents
• 2,100 buildings
                                                            37%
• 95,000 households
                                63%
  on city-wide waiting list
  in 2015
                              240 other housing providers    TCHC

                                                                    4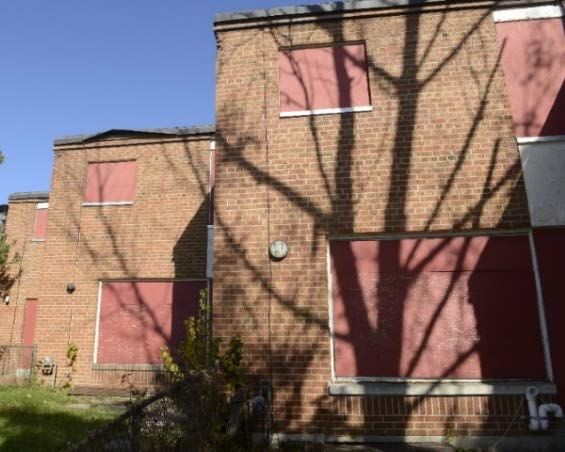
110,000 residents
                            21,000 of
                            27,000 senior
                            households        25%           38%
                            are seniors      seniors
94% of RGI
                 $58,381    living alone                  children &
residents live
                                                            youth
below the
poverty line
                                                 37%
                                                 adults

                            29% of RGI households have a member
 $14,916                    with a disability (versus 12% in Ontario)

 RGI Residents    Toronto
       Median Income

                                                                        5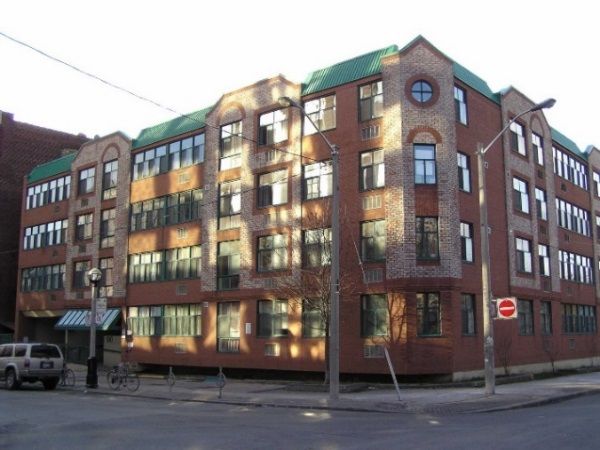
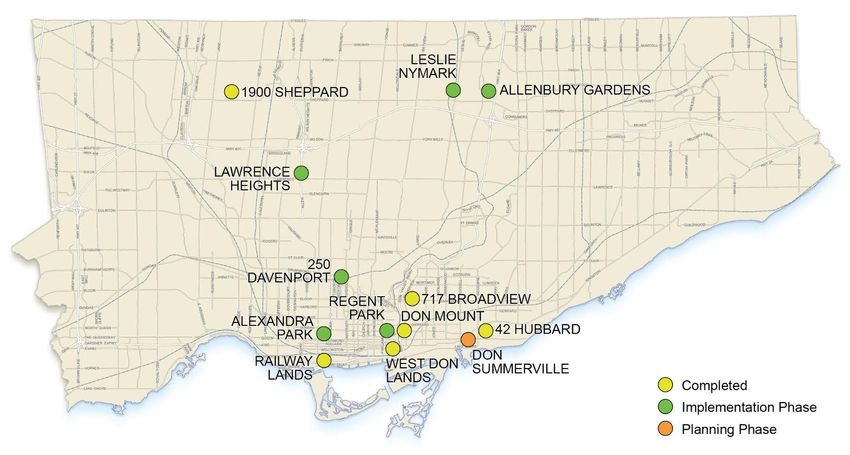
2,100 buildings across the city

                                  6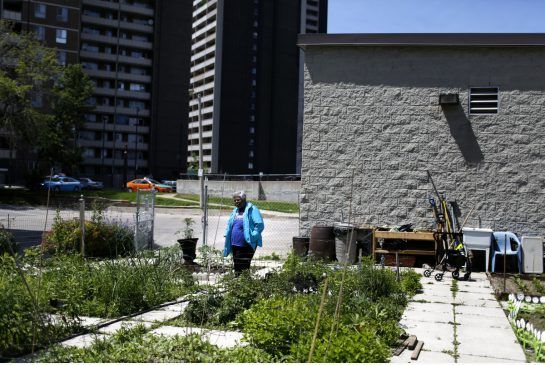
What we do
• Property management
• Tenancy administration
• Capital repairs and demand maintenance
• Development
• Tenant engagement
• Tenant support
• Community safety
• Commercial property management and parking

                                               7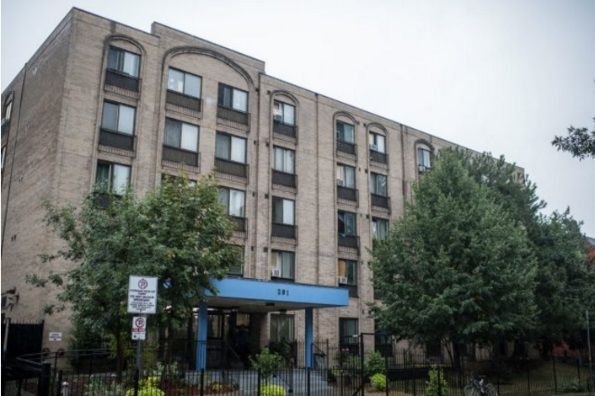
1,639 employees
                                                                  TCH
                                                            Board of Directors
                                Chief Internal
                                   Auditor
                               Commissioner of
                                Housing Equity              Interim President
                                                                 and CEO
                                                                                     Director, Strategic                         Director, Service
                                                                                                           Director, Strategic
                                                                                  Planning & Stakeholder                          Integration &
                                                                                                           Communications
                                                                                         Relations                                   Delivery

                                         General                                         VP, Resident
   VP,        Chief        Chief
                                        Counsel &        VP, Facilities    VP, Asset          &
 Human      Financial   Development
                                        Corporate        Management       Management     Community
Resources    Officer       Officer
                                        Secretary                                          Services

         Senior Director,                                                               Senior Director,
                                      Senior Director,
           Information                                                                 Community Safety
                                       Procurement
       Technology Services                                                                   Unit

    1,639 Employees
              • 1,193 Union (CUPE Local 79 and Local 416; OPSEU Local 529; trades)
              • 446 Management/Exempt
                                                                                                                                                8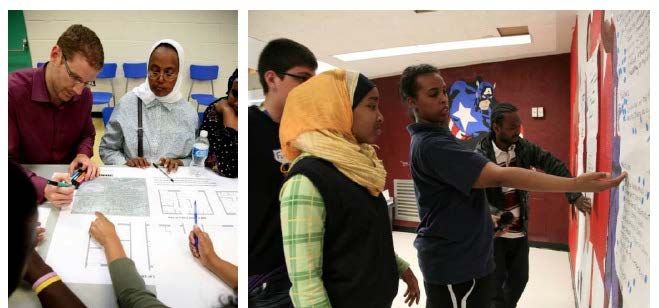
Key performance indicators
As of September 30, 2015

Capital repair $ committed                          $134.28 M
Value of revitalization projects in all stages         $2.2 B
Number of tenants connected to services                  719
Maintenance repairs closed within five days              75%
‘Closing the loop’ satisfaction rating (out of 5)        3.37
Vacancy rate                                            2.6%
Eviction rate                                           0.1%

                                                                9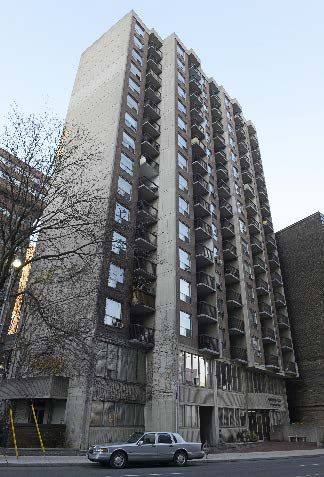
Most buildings are old
• Most buildings 40 to 50 years old or older
• $2.6-billion investment needed over 10 years to bring
  them to fair condition
• Portfolio represents a $9 billion public asset

                                                          10
Many residents need support
• An estimated 1 in 5 residents is living with serious
mental health challenges
• There are over 4,000 households with excessive clutter
issues, impacting safety and quality of life
• We need additional dedicated support from the
provincial government to bring mental health expertise
on-site in high needs buildings, as we have at 291
George St. and 220 Oak St.
11How we got here
Formed without adequate capital Social policy changes resulted in
reserves for most buildings. residents with higher needs.
“Are we concerned that social “Social housing has become the
housing stock repair requirements go-to solution for people with mental
are a financial ticking time bomb? illness leaving institutions, for
We can't help but think the households fleeing abuse, and for
government is passing it off to us, homeless people leaving the
the city, knowing that at some point streets…The result?
it's going to blow…I can't help but “Housing that was designed and
think that is a potential happening funded for low- and moderate-
down the road, and that is of great income families and seniors able to
concern to us.” live independently is now home to
- Councillor Brad Duguid, 2000 Ontario’s most vulnerable people.”
- Ontario Non-Profit Housing Association
(ONPHA), 2015
12Current financial position
13The operating budget gap
Due to fixed rent
Per unit and subsidy
$1,264
operating costs amounts, TCHC
grow every Market rent has to cover this
year. Hydro gap, which grows
(average two-
costs have every year.
increased 43%
bedroom market rent
from CMHC’s 2014 Other providers
since 2012,
have a different
while water Toronto Market Rent
costs have Survey) $320 formula which
results in a smaller
gone up by subsidy
gap.
39%. per unit
Utility costs $360 0.7% increase this
were $104 M in Average RGI rent year.
2012, $142 M per unit Tenants pay 30%
in 2016. of total income.
14Operating outlook
Operating Cost vs. Revenue Growth
$35,000
$30,000
Operating cost growth
$25,000
Amount in $000
$20,000
$15,000
$10,000 Revenue growth
$5,000
$-
2017 2018 2019 2020 2021 2022 2023 2024 2025
15Operating outlook Operating Costs*: 10-Year Projection
$35,000
$30,000
$25,000
Amount in $000
$20,000
$15,000
$10,000
$5,000
$-
2017 2018 2019 2020 2021 2022 2023 2024 2025
Taxes Resident & community services Community safety services Maintenance capital Overhead Operating and maintenance Utilities
*Operating costs excludes mortgage and loan principal and interest payments.
16The capital budget gap
• Until 2013, Toronto Community Housing had
an approximate $50 million annual operating
surplus:
• $50 million = $1 per square foot
• This inadequate repair allocation led the City and
TCHC to develop the 10-year capital financial plan
that Council approved in 2013
• The 10-year repair plan assumes that TCHC will
continue to generate an annual $50 million surplus
• Going forward after 2016, there will be no surplus
17The capital backlog
$4,000,000 45.0%
$3,500,000 40.0%
35.0%
$3,000,000
30.0%
$2,500,000
25.0%
$2,000,000
20.0%
$1,500,000
15.0%
$1,000,000
10.0%
10.0% Target
$500,000 5.0%
- 0.0%
Amount in 2016 2017 2018 2019 2020 2021 2022 2023 2024 2025
$000
Asset Type 1 - High and Mid Rise Asset Type 2 - Low Rise Asset Type 3 - Towns & Walkups
Asset Type 4 - Houses Asset Type 5 - Site and Parking Garages Asset Type 6 - Community Bldgs
Backlog %Asset Value
• Backlog accumulating with no funding from
other orders of government
18Capital repair plan
• From 2013 to the end of 2015, TCH has
invested $372 million in repairs to the portfolio,
thanks to strong support from City Council
• As part of our 2016 budget, we will invest a
further $250 million, bringing the total
investment in the ten year repair plan to $622
million, or 24% of the total plan
19Results of that investment
Better living conditions for residents
36,000 residents have 22,400 residents have
new or repaired roofs new or refurbished
(38 football fields). furnaces or boilers.
31,000 residents have
8,500 residents have
new or refurbished
upgraded balconies.
elevators.
15,000 residents have
new windows.
20Federal and provincial support
10-year capital repair plan
• We have received growing financial and
‘guarantee’ support from the City of Toronto
• We have not secured any funding from the
Provincial and Federal governments to date
• However:
• Mortgage refinancing through Infrastructure Ontario
• Grants for developing affordable rental
• One-off grant support for Revitalizations
212016 budget priorities
In 2016, every action or spend is being tested against
one or both of these questions:
1. How will this extend the viability of our homes for
current and future generations of residents?
2. How will this contribute to better living conditions
or better outcomes for residents?
22Key deliverables in 2016
Extending the viability of our homes
• Deliver $250 M in capital repair work by year-end
• Execute mortgage and debt restructuring to raise $200 M in
2016 for capital repairs in 2017 (subject to Council approval)
Better living conditions for residents
• Implement new cleaning standards in all buildings to maintain
consistent service delivery
• Deliver 55 new elevators and initiate the replacement of 70
more elevators to improve safety, reliability, and performance
• Expand the pilot resident feedback system “Closing the Loop”
across the portfolio to measure satisfaction on work completed
in residents’ units
232016 budget overview
24Budget overview
• 0% increase in discretionary expenses
• Balanced operating cash budget
• Operating budget funded primarily through
tenant rent, City subsidy and commercial
revenue
• 35% increase in capital investment over 2015
• Capital budget funded through mortgage
refinancing, internally restricted reserves and
draws on our line of credit
25Operating budget overview
Revenue sources
• Residential rents (55%)
− increase by about 1% per year
• City subsidy (39%)
• RGI units: rent + subsidy = $680 per unit per month on
average vs. $1264 CMHC average
Expenses
• Utility costs have increased 37% in the last 5 years
• Hydro up 43%, Water up 38%. Well above inflationary trends
2017 outlook
• Operating surplus unlikely in 2017 if existing trends continue
− This will severely restrict funds available for capital repairs
26Sources of funds: Operating
2016 Operating Budget Sources of Funds: $548.0 million
($ million)
Commercial rent, $14.7 , 3% District heating plant,
Parking, laundry and cable fees, $17.2 , 3% $2.0 , 0%
Grants for rental Other, $2.0 , 0%
development, $0.7 , 0%
Subsidies, $212.9 ,
39% Residential rent, $298.5 , 55%
27Uses of funds: Operating
2016 Operating Budget Uses of Funds: $548.0 million
($ million)
Guaranteed equity housing
RPEI operating expenditure, Surplus - Contribution to
project, $0.1 , 0%
$2.5 , 0% reserve fund, $4.7 , 1%
Municipal taxes, $15.5 , 3% Taskforce expense,
$13.7 , 2%
Mortgage & loan P&I, $129.2 ,
Utilities, $142.4 , 26% 24%
Corporate services,
$25.5 , 5%
Operating and maintenance,
$151.7 , 28%
Resident services, $11.8 ,
2%
Tenancy management,
$9.1 , 2%
Human resources,
$12.4 , 2%
Information technology,
Community safety services, $11.9 , 2%
$17.5 , 3% 28A Balanced Cash Budget
Budget Reforecast Budget Actual
(Amounts in $000's) 2016 2015* 2015* 2014*
Operating
Cash inflows
Residential rent 298,481 296,117 294,288 299,037
Subsidies 212,932 196,782 198,782 198,280
Parking, laundry and cable fees 17,221 16,769 18,184 16,663
Commercial rent** 14,682 14,931 14,084 16,912
Other revenue 2,018 2,483 2,483 2,434
RPEI revenue 1,985 1,912 2,107 1,330
Grants for rental properties 687 441 441 268
548,006 529,434 530,368 534,924
Cash outflows
Operating and maintenance 151,607 147,823 148,380 145,231
Utilities 142,303 135,192 136,763 128,527
Mortgage & loan P&I 129,257 116,175 124,231 123,185
Corporate services 25,516 23,797 24,547 17,591
Tenancy management 9,051 7,165 7,454 4,966
Municipal taxes 15,535 15,188 15,675 17,357
Community safety services 17,500 16,628 15,533 14,051
Human resources 12,432 13,443 13,770 9,730
Resident & community services 11,825 9,937 11,639 9,346
Information technology 11,871 11,093 11,582 8,331
RPEI operating expenditure 2,494 2,616 2,932 2,140
Guaranteed equity housing project 129 305 305 267
Task force expense 13,730 - -
543,250 499,362 512,810 480,722
Net operating cash surplus (shortfall) 4,756 30,072 17,558 54,202
*Access Housing Connections balances have been removed for comparative purposes
**Deferred rent receivable is not included in commercial rent as it is a non-cash item. 29Capital budget overview
Revenue sources
• Mortgage refinancing, usage of line of credit and internal restricted
capital reserves, totaling $749 M (Budget 2015 = $398 M)
Expenses
Budget 2016 Budget 2015
Capital repairs that will improve living conditions for
$ 250 million $ 180 million
40,500 households
Revitalization in six active sites 170 million 127 million
Information technology and corporate capital 13 million 12 million
Total capital budget presented for TCHC board
$ 433 million $ 319 million
approval
Contribution to capital repairs reserve fund for
224 million 46 million
2017 and on
Repayment of expired mortgages 93 million 33 million
Total capital expenses $ 749 million $ 398 million
30Capital deployment growth
(Amounts in $millions)
$300
$250 M
$250
$200
$180 M
$170 M
$150
$125 M $127 M
$100
$68 M
$50
$12 M $13 M
$4 M
$-
Actual 2014 ($197 M) Budget 2015 ($319 M) Budget 2016 ($433 M)
Corporate and IT Capital Development capital Building and Base Energy capital
31Mortgage refinancing
Mortgages Coming to End of Term (In Millions)
$ Millions
350
300
250
200
200
150
200
100 94
50
93
60 31
32 9 7 23
- 19 19
Years 2013 2014 2015 2016 2017 2018 2019 2020
$ amount of additional proceeds obtained through refinancing for building capital
$ amount of mortgages coming to end of term in year
• $174 M in mortgage renewals over next 10 years; $93 M in 2016
• TCHC will align all 2016 renewals to a single renewal date of Nov. 1, 2016
• Allows for bulk refinancing by blend-and-extend, if approved by shareholder
32Sources of funds: Capital
2016 Capital Budget Sources of Funds: $749.0 million
($ million)
Gain on sale of housing
projects, $5.0 , 1%
Profit distribution from condo
sales, $8.8 , 1%
Proceeds from land sale,
Internally restricted reserve,
$18.1 , 2%
$68.4 , 9%
Investment income, $6.0 ,
1%
Lender capital reserve,
$203.2 , 27%
Proceeds from mortgage
refinancing, $319.0 , 43%
Bank Loan, $58.3 , 8%
State of good repairs
reserve, $18.8 , 2%
Grants for rental development, Operating cash & cash
$30.9 , 4% 33
equivalents, $12.5 , 2%Uses of funds: Capital
2016 Capital Budget Uses of Funds: $749.0 million
($ million)
Repayment of expired
mortgages, $92.7 , 12%
Revitalization capital,
$169.8 , 23%
Contribution to reserve
fund, $224.0 , 30%
Building capital, $250.0 ,
33%
Corporate capital, $3.5 , 1%
IT capital, $9.0 , 1%
34Revitalization
Leveraging assets to reduce repair needs
352016 Capital repair program
Addressing the most critical needs
2013-2015
*2013 2014 2015 2016
Building Major Discipline Total Budget
(in millions) (in millions) (in millions) (in millions) (in millions)
Building Envelope 3.8 9.5 20.7 34.0 45.8
Electrical 0.5 1.9 2.1 4.5 7.8
Elevators 2.8 4.6 3.2 10.6 21.6
Equipment 3.2 0.8 1.0 5.0 3.0
Grounds 3.0 7.0 17.1 27.1 11.4
Interiors 29.6 39.5 55.5 124.6 30.8
Life Safety 4.8 5.9 7.4 18.1 26.7
Mechanical Systems 9.8 17.9 28.3 56.0 44.0
Parking Garages 0.8 8.0 10.5 19.3 8.8
Roofing 4.2 9.3 7.5 21.0 13.4
Structural 7.2 7.0 9.4 23.6 23.5
Capital Category Totals 69.7 111.4 162.7 343.8 236.8
Project Management 0.4 6.6 11.6 18.6 12.7
% of Project Management 5.5% 6.6% 5.1%
Building Condition Audits 7.0 2.0 0.7 9.7 0.5
Admin/BCA Totals 7.4 8.6 12.3 28.3 13.2
Overall Totals 77.1 120.0 175.0 372.1 250.0
*Project Management was calculated within jobs in 2013 not as a separate line item 362016 opportunities, challenges
Opportunities Challenges
• Raising $200 M for capital repairs • Running out of mortgages to
through mortgage refinancing refinance.
(subject to City Council approval).
• Delivering capital repairs • Need provincial and federal
benefiting 40,500 households. support to continue the 10 year
plan.
• Opening 768 units of new and • Gap funding required to continue
refurbished rental housing through to finance Revitalizations.
Revitalization.
• Potential for new opportunities to • Cost of operating housing
address the operating funding continues to far outpace revenues.
gap.
• No additional units to be boarded • Low turn-over means the waitlist
up in 2016: 110,000 residents will for housing continues to grow.
maintain a stable home.
372017 outlook
382017 Outlook
With Deliver the planned $300 M in capital repairs
federal/provincial
support
Improve tenants’ living conditions and extend
the life of many assets
Expand revitalization
Without Repairs limited to keeping the lights on where
federal/provincial
support
possible
Deteriorating living conditions
More units boarded up
39Discussion
40You can also read