International Seaways, Inc - First Quarter 2021 Earnings Presentation May 6, 2021 - Seeking Alpha
←
→
Page content transcription
If your browser does not render page correctly, please read the page content below
International Seaways, Inc.
       First Quarter 2021
      Earnings Presentation
          May 6, 2021
Disclaimer
Forward-Looking Statements
During the course of this presentation, the Company (International Seaways, Inc. (INSW)) may make forward-looking statements or provide
forward-looking information. All statements other than statements of historical facts should be considered forward-looking statements. Some of
these statements include words such as ‘‘outlook,’’ ‘‘believe,’’ ‘‘expect,’’ ‘‘potential,’’ ‘‘continue,’’ ‘‘may,’’ ‘‘will,’’ ‘‘should,’’ ‘‘could,’’ ‘‘seek,’’ ‘‘predict,’’
‘‘intend,’’ ‘‘plan,’’ ‘‘estimate,’’ ‘‘anticipate,’’ ‘‘target,’’ ‘‘project,’’ ‘‘forecast,’’ ‘‘shall,’’ ‘‘contemplate’’ or the negative version of those words or other
comparable words. Although they reflect INSW’s current expectations, these statements are not guarantees of future performance, but involve a
number of risks, uncertainties, and assumptions which are difficult to predict. Some of the factors that may cause actual outcomes and results to
differ materially from those expressed in, or implied by, the forward-looking statements include, but are not necessarily limited to, the Company’s
planned merger with Diamond S, plans to issue dividends, vessel acquisitions, general economic conditions, competitive pressures, the nature of
the Company’s services and their price movements, and the ability to retain key employees. The Company does not undertake to update any
forward-looking statements as a result of future developments, new information or otherwise.
Non-GAAP Financial Measures
Included in this presentation are certain non-GAAP financial measures, including Time Charter Equivalent (“TCE”) revenue, EBITDA, Adjusted
EBITDA, and total leverage ratios, designed to complement the financial information presented in accordance with generally accepted accounting
principles in the United States of America because management believes such measures are useful to investors. TCE revenues, which represents
shipping revenues less voyage expenses, is a measure to compare revenue generated from a voyage charter to revenue generated from a time
charter. EBITDA represents net (loss)/income before interest expense, income taxes and depreciation and amortization expense. Adjusted EBITDA
consists of EBITDA adjusted for the impact of certain items that we do not consider indicative of our ongoing operating performance. Total leverage
ratios are calculated as total debt divided by Adjusted EBITDA. We present non-GAAP measures when we believe that the additional information is
useful and meaningful to investors. Non-GAAP financial measures do not have any standardized meaning and are therefore unlikely to be
comparable to similar measures presented by other companies. The presentation of non-GAAP financial measures is not intended to be a substitute
for, and should not be considered in isolation from, the financial measures reported in accordance with GAAP. See Appendix for a reconciliation of
certain non-GAAP measures to the comparable GAAP measures.
This presentation also contains estimates and other information concerning our industry that are based on industry publications, surveys and
forecasts. This information involves a number of assumptions and limitations, and we have not independently verified the accuracy or completeness
of the information.
Additional Information
You should read the Company’s Annual Report on Form 10-K for the year ended December 31, 2020, the Quarterly Report on Form 10-Q for the
quarter ended March 31, 2021, the Company’s Registration Statement on Form S-4 dated May 5, 2021, and other documents the Company has
filed with the SEC for additional information regarding the Company, its operations and the risks and uncertainties it faces. You may obtain these
documents for free by visiting EDGAR on the SEC Web site at www.sec.gov, or from the Company’s website at www.intlseas.com.

                                                                                                                                                        2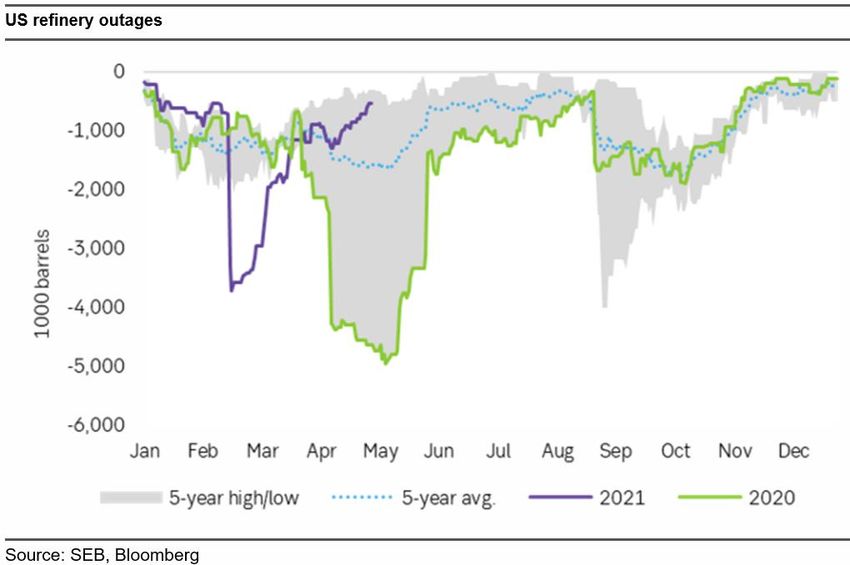
Business Review
  Lois K. Zabrocky
  President & CEO

                     3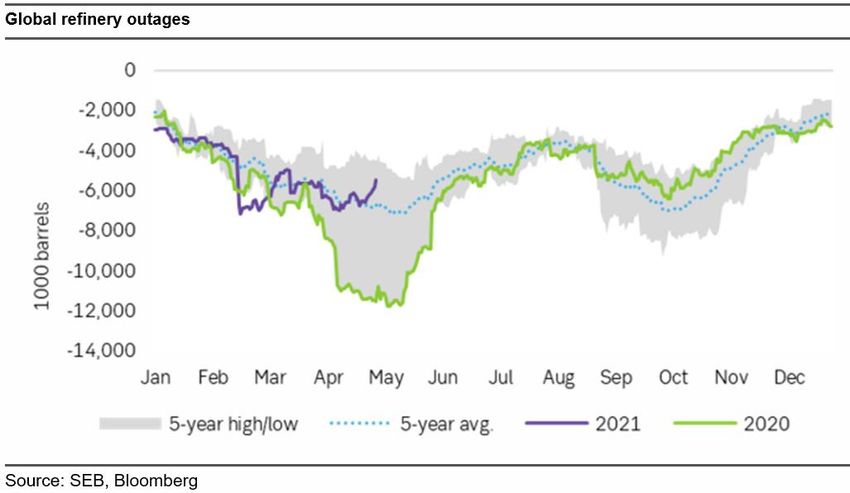
First Quarter 2021 Highlights and Recent Developments

• Announced Merger Agreement with Diamond S Shipping
  o   Will double INSW’s net asset value in an all-stock merger and triple the
      size of the fleet; will be second largest US tanker owner by ship count
  o   Accretive to INSW’s earnings, cash flow per share
  o   Estimated annual cost synergies of $23 million and revenue synergies of
      $9 million by adhering to INSW’s lean and scalable model
  o   Enhances trading liquidity
  o   Maintains financial strength and low leverage
  o   Maintain $50 million share repurchase authorization
  o   Special dividend of $31.5 million to existing INSW shareholders
      immediately prior to closing
• Constructing Three Dual Fuel VLCCs for Delivery in 2023
  o   Seven-year time charters with Shell with a base rate that protects the
      downside and profit sharing that takes advantage of these innovative,
      efficient ships to capture the upside
  o   40% more fuel efficient than a 10 year old VLCC
  o   20% more efficient than a modern ECO VLCC.
  o   Outperform 2025 Phase III EEDI targets
  o   In line with Seaway’s ESG principles
  o   Attractive contract prices demonstrate INSW’s commitment to deploy
      capital for growth at the right part of the cycle
• First Quarter 2021 Results
  o   Net loss $13.4 million, or $0.48/share
  o   Adjusted EBITDA $10.7 million
  o   $172 million in cash at quarter end, $212 million in total liquidity

                                                                                 4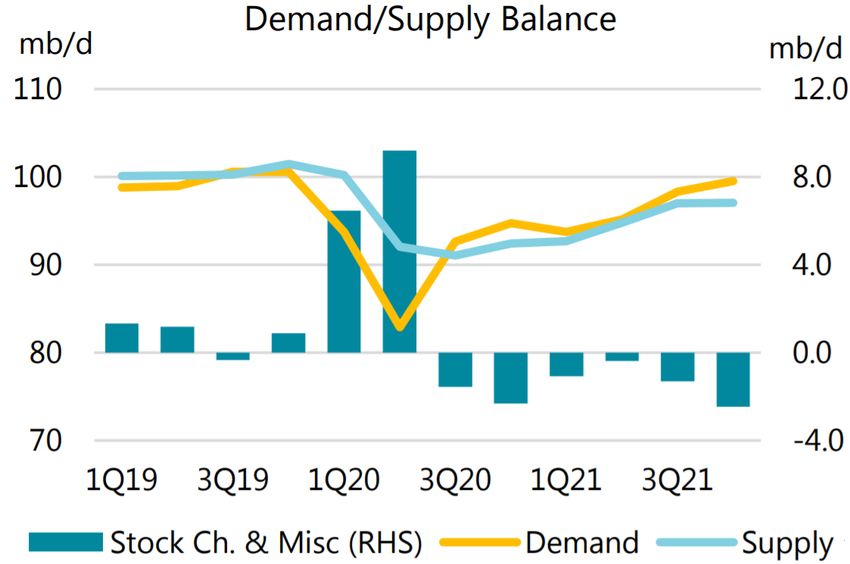
Disciplined Capital Allocation – Fleet Renewal
•     International Seaways invested $900 million at the bottom of the cycle
      o                      Two Suezmax newbuilding resales purchased for $58 million each in 2017
      o                      2010-built VLCC purchased for $53 million in 2017
      o                      Six VLCCs built 2016 and 2015 purchased for $434 million total in 2018
      o                      Since acquisition, the nine ships have contributed a cumulative $225 million in operating income (TCE revenue minus opex)
                             through March 31, 2021
      o                      Three dual-fuel LNG VLCCs ordered for $290 million at bottom of market; newbuilding prices have increased since

                                               Timely Asset Purchases Provide Maximum Return
                             120

                             110
                                                                                               6 VLCCs
    Index (Jan 2010 = 100)

                             100

                             90

                             80

                             70
                                                                                   2 Suezmaxes
                             60
                                                                                          1 VLCC                     3 LNG VLCCs
                             50

                                                     VLCC NB         VLCC Resale         VLCC 5 y/o        Suezmax Resale

Source: Clarksons

                                                                                                                                         5
Market Update – Oil Supply, Demand and Implications

•   Oil Supply and Demand
    o    OPEC+ has announced increased production, as well as rollbacks of Saudi Arabia’s voluntary cuts, amounting to an additional
         600,000 b/d production for May, followed by an additional 700,000 b/d in June and 800,000 b/d in July, reaching 2.1 million b/d
         above present levels
    o    IEA’s April forecast estimates 2021 demand to be up 5.7 mb/d, an increase of 300,000 barrels/day from their February
         forecast. EIA is even more optimistic, expecting 2021 demand to average 97.7 million b/d
    o    EIA expects global oil inventories will fall by 1.8 million b/d in the first half of 2021; combined with OPEC+ production
         increases, this should provide improvements in the tanker markets.

Source: IEA, EIA,

                                                                                                                            6
Market Update – Clean Products
• Refinery Outages
o 2020 saw a drastic reduction in global refinery
utilization due to the global pandemic
o February 2021 saw a similar drop in US
refinery utilization due to record cold
temperatures
o Both US and global outages are now
approaching 5 year lows, which should give
strength to the product tanker markets
7Market Update – Ship Supply
• Orderbook Update
o Orderbook remains at historical lows: VLCC Orderbook Recycling Candidates
• VLCC 9.6%
• Suezmax 8.0%
20
• Aframax/LR2 9.2% 18
• Panamax/LR1 1.5% 16
• MR 6.1%
14
o 31 VLCCs ordered in 2019; 31 in 2020; 27 YTD 2021
Million DWT
o Ordering tempered by uncertainty surrounding markets, 12
decarbonization, and higher steel and newbuilding prices
10
• Recycling potential
8
o The VLCC fleet is aging – out of a total fleet of 842 ships:
• 141 ships are 17.5 years old or older (17%). Of these, 6
• 66 ships are already 20 years old or older (8%). This 4
represents the majority of the VLCC orderbook
2
• A further 9 VLCCs will reach age 20 during the balance of
2021 (1%) 0
19
2021
2022
2023
20+
18
17
o Every 2.5 years starting with age 17.5, significant investment
required to continue to trade
o As ships reach ballast water treatment deadlines, even greater Delivery Year Age as of March 2021
capital expenditure is required to keep trading
o After a record 31 ships recycled in 2018, only four VLCCs were
recycled in both of 2019 and 2020, and 3 YTD 2021. At current
spot rates and steel prices, we expect to see recycling increase
Source: Clarksons
8Financial Review
Jeffrey D. Pribor
SVP & CFO
9Financial Summary – TCE Revenue & Adjusted EBITDA1
($ millions)
Quarterly: 1Q 2020 vs 1Q 2021
Quarterly TCE Revenue Quarterly Adjusted EBITDA
$120
$74
$31
$45
$89 $9
$36 $11 LTM
2020 Q1
Crude Tankers
2021 Q1
Product Tankers 2020 Q1 2021 Q1
Adjusted
EBITDA1:
LTM: 1Q 2020 vs 1Q 2021
LTM TCE Revenue LTM Adjusted EBITDA $156.6M
$366 $192
$327 $157
$90 $61
$276 $266
2020 Q1 - LTM 2021 Q1 - LTM 2020 Q1 - LTM 2021 Q1 - LTM
Crude Tankers Product Tankers
1 See Appendix for TCE Revenue and EBITDA reconciliation
10Financial Summary – 2021 Q1 & Q2 Earnings Update
2021 Q1 Actual 2021 Q2 to Date 1
SPOT TC OVERALL SPOT TC OVERALL
TCE TCE TCE Fixed TCE Fixed TCE Fixed TCE
VLCC (ALL) $15,700 $47,400 $21,100 63% $15,200 100% $43,900 67% $19,800
Scrubber $17,100 $43,900 $20,400 62% $15,600 100% $43,900 66% $20,400
No Scrubber $11,200 --- $11,200 91% $9,300 --- --- 91% $9,300
> 15 years --- $51,700 $51,700 --- --- --- --- --- ---
Suezmax $12,200 --- $12,200 75% $16,000 --- --- 75% $16,000
Aframax/LR2 $11,700 $17,800 $13,200 37% $11,100 100% $17,800 53% $14,300
Panamax/LR1 $13,100 $10,700 $11,800 49% $21,000 72% $11,100 60% $15,200
MR $7,400 --- $7,400 65% $12,600 --- --- 65% $12,600
1As of April 29, 2021
Overall 2021 Q1 VLCC TCE includes 155 time charter days at $47,400/day. Overall 2021 Q2 VLCC TCE includes 91 time charter days at $43,900/day
Overall 2021 Q1 Afra/LR2 TCE incudes 90 time charter days at $17,800/day. Overall 2021 Q2 Afra/LR2 TCE includes 91 time charter days at $17,800/day 11
Overall 2021 Q1 Pana/LR1 TCE includes 516 time charter days at $10,700/day. Overall 2022 Q1 Pana/LR1 TCE includes 435 time charter days at $11,100/day
Rates exclude average pool fees of approximately $620/day. Excludes prior period accounting adjustmentsLean and Scalable Model – Cash Breakevens
TCE breakeven levels allow INSW to navigate low points in the tanker cycle while
providing significant operating leverage in rising markets
INSW Daily OPEX excludes DDK deviation bunkers, insurance claims and one-off expenses
G&A for the Lightering segment is excluded
Vessels that have been sold are excluded 12
Only includes owned vessels. Two bareboat-in Aframaxes vessels have charter hire and OPEX expenses of approx. $16,400 per day
Breakevens are basis Revenue DaysFinancial Summary – Change in Cash Balance
13Strong Financial Position – Balance Sheet
Strong balance sheet protects INSW during low portions of tanker cycle
March 31, 2021
($ M)
Assets Liabilities INSW Book Value of FSO JV as of
Current Liabilities (including $61M current March 31, 2021: $132 million
Cash and Equivalents $156 portion of long term debt and $8M current $98
portion of lease liabilities)
Other Current Assets $65 Long Term Debt $459 • Net Debt to Total Capitalization: 26%
Long Term Portion of Lease Liabilities $9
• Net Debt to LTM EBITDA: 2.23x
Other Long Term Liabilities $18
Total Current Assets $221 Total Liabilities $584 • Net Loan to Asset Value1: 33%
Restricted Cash $16 • Portion of debt which is fixed or hedged: 96%
Vessels $1,136
Right of Use Assets $19 Equity
Other Long Term Assets $159 Total Equity $968
Total Assets $1,552 Total Liabilities and Equity $1,552
INSW Debt at 3/31/21
Principal Balance ($M) Maturity Rate Quarterly Amortization
Core Facility $262.1 1/23/2025 LIBOR +240 bps $9.5M
Sinosure Credit Facility $240.2 2027-2028 LIBOR +200 bps $5.9M
8.5% Senior Notes $25.0 6/30/2023 8.50% 0
Total Debt Balance $527.3
Undrawn Revolver $40.0 LIBOR +240 bps
1 Conventional tanker fleet only; includes value of FSO joint ventures
14Summary
• Announced Merger Agreement with Diamond S Shipping
o Will double INSW’s net asset value in an all-stock merger and triple the
size of the fleet; will be second largest US tanker owner by ship count
o Accretive to INSW’s earnings, cash flow per share
o Estimated annual cost synergies of $23 million and revenue synergies of
$9 million by adhering to INSW’s lean and scalable model
o Enhances trading liquidity
o Maintains financial strength and low leverage
o Maintain $50 million share repurchase authorization
o Special dividend of $31.5 million to existing INSW shareholders
immediately prior to closing
• Constructing Three Dual Fuel VLCCs for Delivery in 2023
o Seven-year time charters with Shell with a base rate that protects the
downside and profit sharing that takes advantage of these innovative,
efficient ships to capture the upside
o 40% more fuel efficient than a 10 year old VLCC
o 20% more efficient than a modern ECO VLCC.
o Outperform 2025 Phase III EEDI targets
o In line with Seaway’s ESG principles
o Attractive contract prices demonstrate INSW’s commitment to deploy
capital for growth at the right part of the cycle
• First Quarter 2021 Results
o Net loss $13.4 million, or $0.48/share
o Adjusted EBITDA $10.7 million
o $172 million in cash at quarter end, $212 million in total liquidity
15Appendix
16Estimated Drydock and CAPEX costs and Out-of-Service Days
($ millions)
2021 Out-of-Service Days
Q1 (A) Q2 (E) Q3 (E) Q4 (E) FY 2021
VLCC 76 158 0 52 287
Suezmax 0 0 0 0 0
Aframax / LR2 0 0 6 6 12
Panamax / LR1 169 6 0 32 208
MR 2 0 19 3 24
248 164 25 93 531
2021 Drydock Costs
Q1 (A) Q2 (E) Q3 (E) Q4 (E) FY 2021
VLCC $2.2 $7.5 $0.0 $4.5 $14.2
Suezmax $0.0 $0.0 $0.0 $0.0 $0.0
Aframax / LR2 $0.0 $0.0 $0.1 $0.1 $0.2
Panamax / LR1 $5.8 $1.3 $0.0 $1.2 $8.4
MR $0.5 $0.0 $1.6 $0.0 $2.1
$8.6 $8.8 $1.7 $5.9 $24.9
2021 CAPEX Costs *
Q1 (A) ** Q2 (E) Q3 (E) Q4 (E) FY 2021
VLCC $2.1 $18.1 $15.2 $1.7 $37.1
Suezmax $0.0 $0.0 $0.0 $0.0 $0.0
Aframax / LR2 $0.0 $0.2 $0.0 $0.0 $0.2
Panamax / LR1 $0.6 $0.1 $0.0 $0.0 $0.7
MR $0.0 $0.0 $0.4 $0.0 $0.4
$2.7 $18.4 $15.6 $1.7 $38.4
* Principally relates to Scrubber and BWTS costs. VLCC cost in Q2 and Q3 include payments for 3 VLCC newbuildings
** Q1 2021 CAPEX does not include $0.6M in costs related to the Diamond S merger
17TCE Revenue Reconciliation
($ thousands)
1Q20 1Q21 LTM 1Q20 LTM 1Q21
Time charter equivalent revenues 119,731 45,169 365,621 327,443
Add: Voyage expenses 5,606 1,587 24,026 15,624
Shipping revenues 125,337 46,756 389,647 343,067
18Adjusted EBITDA Reconciliation
($ thousands)
All INSW 1Q20 1Q21 LTM 1Q20 LTM 1Q21
Net income / (loss) 33,019 (13,365) 21,292 (51,915)
Income tax provision - - 1 1
Interest expense 12,009 7,280 60,743 31,983
Depreciation and amortization 18,267 16,754 74,991 72,830
EBITDA 63,295 10,670 157,027 52,900
Third-party debt modification fees 232 - 232 -
(Loss)/income on disposal of vessels, net of
(2,804) 11 (2,448) 102,902
impairments
Loss on sale of investment in affiliated companies - - (3,033) -
Release of other comprehensive loss upon sale of
- - 21,615 -
investment in affiliated company
Write-off of deferred financing costs 12,501 - 16,059 572
Loss on extinguishment of debt 992 - 2,092 205
Adjusted EBITDA 74,216 10,681 191,544 156,580
19Chartered In Fleet
Charter-In Hire Details
• Time Charter-Ins:
– 1 LR1 vessel that redelivers in August 2021 – Charter Hire expense for 2021 : $1.7M
• Bareboat-Ins:
– 2 Aframax vessels that redeliver in 2024 – Charter Hire expense for 2021 : $4.7M
• Lightering:
– 5 workboats that redeliver between June 2021 and July 2023 – Charter Hire expense for 2021 :
$6.2M
20INSW Fleet as of May 4, 2021
Ship Type Built DWT Ownership Ship Type Built DWT Ownership
Gener8 Chiotis VLCC 2016 300,973 Owned Seaways Leyte LR1 2011 73,944 Owned
Seaways Cape Henry VLCC 2016 300,932 Owned Seaways Samar LR1 2011 73,920 Owned
Seaways Triton VLCC 2016 300,933 Owned Seaways Guayaquil LR1 2009 74,999 Owned
Seaways Diamond Head VLCC 2016 300,781 Owned Ice Victory LR1 2006 70,372 TC-in
Seaways Hendricks VLCC 2016 300,757 Owned Seaways Visayas LR1 2006 74,933 Owned
Seaways Tybee VLCC 2015 300,703 Owned Seaways Luzon LR1 2006 74,908 Owned
Seaways Kilimanjaro VLCC 2012 296,520 Owned Seaways Athens MR 2012 50,342 Owned
Seaways Mckinley VLCC 2011 296,305 Owned Seaways Milos MR 2011 50,378 Owned
Seaways Everest VLCC 2010 296,409 Owned Seaways Kythnos MR 2010 50,284 Owned
Seaways Raffles VLCC 2010 317,858 Owned Seaways Skopelos MR 2009 50,221 Owned
Seaways Tanabe VLCC 2002 298,561 Owned FSO Africa FSO 2010 432,023 JV 50%
Seaways Hatteras Suezmax 2017 158,432 Owned FSO Asia FSO 2009 432,023 JV 50%
Seaways Montauk Suezmax 2017 158,432 Owned
Seaways Redwood Aframax 2013 112,792 Owned
Seaways Yellowstone Aframax 2009 112,989 BB-in
Seaways Yosemite Aframax 2009 112,905 BB-in
Seaways Shenandoah LR2 2014 112,691 Owned
Seaways Reymar Panamax 2004 69,501 Owned Trading Crude
Seaways Hellas Panamax 2003 69,636 Owned Trading Products
Seaways Jademar Panamax 2002 69,708 Owned JV Ships
Seaways Goldmar Panamax 2002 69,684 Owned
Seaways Rosemar Panamax 2002 69,628 Owned
Seaways Silvermar Panamax 2002 69,609 Owned
Seaways Rubymar Panamax 2002 69,599 Owned
21You can also read