Academy Sports + Outdoors (ASO) Still Mispriced; Potential to Double over Two Years - John M. Zolidis Jan 31, 2021 - Quo Vadis Capital
←
→
Page content transcription
If your browser does not render page correctly, please read the page content below
Academy Sports + Outdoors (ASO)
Still Mispriced; Potential to Double
           over Two Years

           John M. Zolidis
            Jan 31, 2021
Academy Sports + Outdoors (ASO) John Zolidis
john.zolidis@quovadiscapital.com
Investment Deck Outline
Intro/ Summary of Key Fundamentals (ASO) Sides 4-5
Investment thesis Slide 6
Discussion of 10% EBITDA target Slide 7-9
Long-term forecasts vs. consensus Slides 10-13
Argument for Valuation Slide 14-16
Investment Recap, Risks Slide 17-18
Disclosures Slide 19
Appendix: Quo Vadis Capital Process Slide 20
2Academy Sports + Outdoors (ASO) John Zolidis
john.zolidis@quovadiscapital.com
Six Month Chart: Mispriced at IPO and STILL Mispriced
Click here for our initial analysis published shortly after the IPO.
ADDED TO
QUO VADIS
LONG LIST
10/19/20 @
$13.92
3Academy Sports + Outdoors (ASO) John Zolidis
john.zolidis@quovadiscapital.com
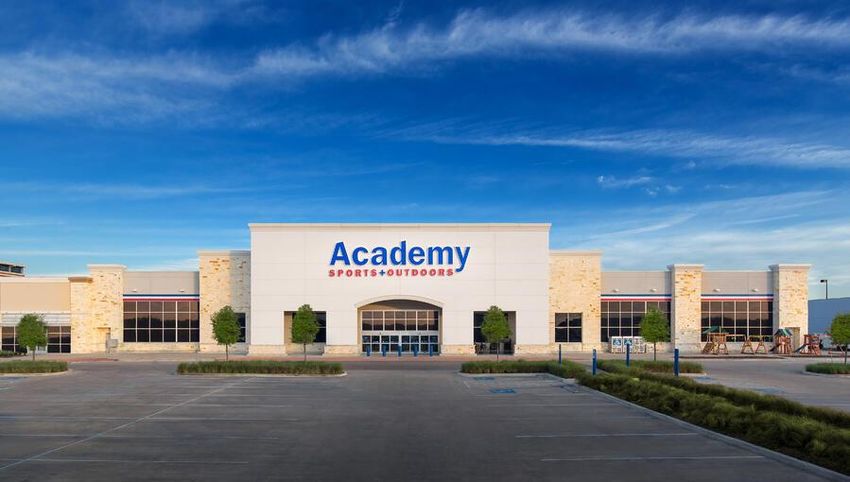
Intro to Academy Sports + Outdoors (ASO)
Academy Sports is a regional big-box sporting goods retailer with 260 locations
and pre-covid19 (FY19) annual sales of $4.8B.
➢ The company conducted an IPO in October 2020 selling 17.4M shares at $13.
Last week selling stockholders sold 12.0M shares at $21.50.
➢ ASO has been owned since 2011 by KKR with the founding family retaining a
minority stake. Following the IPO and last week’s follow-on, KKR held a 55%
stake.
➢ EBITDA margin: 6.1% FY19A, and 9.1% FY20E.
➢ FY20E Capex ~$47M (1% of sales). We estimate FY21 capex at $65M.
➢ Forecasted FY20 YE balance sheet: $188M cash, $800M LT debt aside from
operating leases, representing 3.3x lease-adj. debt to EBITDAR, $1.2B
Shareholders’ equity
➢ FY19 Free cash flow was $200M
➢ No dividend
➢ Recent price $21.50 (as of Jan 29 2021), current market cap: $2.0B.
4Academy Sports + Outdoors (ASO) John Zolidis
john.zolidis@quovadiscapital.com
ASO was materially undervalued in its IPO. Here’s
why ASO might STILL be mispriced:
➢ Recent IPO with limited exposure to investors
➢ Limited sell-side coverage (only banking-analysts)
➢ FactSet and other services currently list an incorrect share count (99M vs.
91M) which fails to adjust for a reorganization in connection with the IPO
➢ Most recent balance sheet data may not reflect refinancing of LT debt or
incremental equity issuance (Screens are wrong)
➢ Distortions related to Covid19 including stimulus spending make sales and
margin trend difficult to read
➢ Market has short term focus on Covid19 performance and lack of appreciation
of long-term margin opportunities
➢ Stock is grouped with no-growth traditional retailers and fails to account for
transition to more comprehensive omni-channel consumer offer
In summary we believe ASO shares are under-analyzed by market participants
setting up an ongoing opportunity
5Academy Sports + Outdoors (ASO) John Zolidis
john.zolidis@quovadiscapital.com
Investment Thesis : How We Get a Double in ASO
ASO is still in the early stages of a multi-year sales growth and EBITDA
expansion opportunity that is not appreciated by the market
Using a 10% EBITDA margin target for the business by FY23, we estimate
earnings and free cash flow of ~$4 per share.
Employing a still-modest P/E of 12x or an EV/ EBITDA multiple of 6x and
our FY23 forecasts, we generate a potential value for ASO shares
between $41 and $48, representing 107% upside over two years at the
mid-point.
6Academy Sports + Outdoors (ASO) John Zolidis
john.zolidis@quovadiscapital.com
But how realistic is a 10% EBITDA margin for ASO?
7Academy Sports + Outdoors (ASO) John Zolidis
john.zolidis@quovadiscapital.com
Can ASO do 10% EBITDA? Where are Comparable
Retailers?
➢ ASO produced a 6.1% EBITDA margin in FY19 and we currently estimate a
9.4% EBITDA margin for FY20 (Street is at 8.8%).
➢ A look at the most similar public companies (off-mall sporting good
retailers) suggests a 10% EBITDA margin is well within industry norms
Academy Sports Peer Group FY20E EBITDA Margins
Big Five Dick's Sportsman's
Sporting Sporting Hibbett Sports Warehouse
Goods Corp. Goods, Inc. Inc. Holdings, Inc.
BGFV DKS HIBB SPWH
10% 11% 7% 9%
Source: FactSet and Quo Vadis Capital, Inc. estimates
Contact us for a deeper dive on structural differences between ASO and
these and other comparable retailers
8Academy Sports + Outdoors (ASO) John Zolidis
john.zolidis@quovadiscapital.com
Can ASO do 10% EBITDA? How does it get there?
➢ STEPS TO 10% EBITDA MARGIN BY FY23
1. Sales leverage: Our premise is that ASO will be operating in a favorable
demand environment as consumers continue to focus on health and
wellness and outdoor activities served by the stores’ assortments. We
believe this will be bigger and last longer than investors currently anticipate.
2. Gross margins: ASO’s 30% GMs appear low. We see opportunity from
better inventory management, optimization of promotional strategies,
efficiencies in logistics, increased/ upgraded private label penetration,
merchandise mix, and increased use of margin-accretive omni-channel
capabilities such as BOPIS.
3. S,G&A: ASO will have to overcome public company costs and Covid19
related expenses. However, we see opportunities for increased efficiency in
operations and store-level expenses.
Contact us for more detail and discussion
9Academy Sports + Outdoors (ASO) John Zolidis
john.zolidis@quovadiscapital.com
How is the Street modeling ASO?
10Academy Sports + Outdoors (ASO) John Zolidis
john.zolidis@quovadiscapital.com
Consensus Models Forecast EBITDA Margins in the
8.0%-8.5% Range Over FY21-FY23
➢ Consequently, the Street also sees EPS in FY23 near FY20 levels
Academy Sports and Outdoors, Inc.
Pro Forma Annual Earnings Model And Selected Financial Data - CONSENSUS IN YELLOW
($ in Millions, Except per Share Data)
Fiscal Year Ends January
Fiscal Fiscal Fiscal Fiscal Fiscal Fiscal
2018A 2019A 2020E 2021E 2022E 2023E
Total retail sales $ 4,783.9 $ 4,829.9 $ 5,595.5 $ 5,434.4 $ 5,585.9 $ 5,766.0
% change -1.1% 1.0% 15.9% -2.9% 2.8% 3.2%
Gross profit $ 1,368.0 $ 1,431.2 $ 1,641.7 $ 1,625.6 $ 1,678.2 $ 1,721.5
% change -2.2% 4.6% 14.7% -1.0% 3.2% 2.6%
Gross profit margin 28.6% 29.6% 29.3% 29.9% 30.0% 29.9%
EBITDA $ 261.7 $ 296.7 $ 492.6 $ 448.5 $ 480.8 $ 492.0
EBTIDA margin 5.5% 6.1% 8.8% 8.3% 8.6% 8.5%
Diluted EPS $0.24 $1.60 $2.79 $2.42 $2.75 $2.95
% change -63.3% 555.9% 74.8% -13.4% 13.7% 7.4%
Total stores 253 259 259 262 267 278
% Δ in same-store sales -2.5% -0.7% 14.0% -2.2% 1.8% 1.8%
Free cash flow per share $1.03 $2.67 $2.24 $2.58 $2.35 n/a
(1)
Source: Company data, FactSet, Quo Vadis Capital, Inc. ests period contains extra week
11Academy Sports + Outdoors (ASO) John Zolidis
john.zolidis@quovadiscapital.com
How is our Model Different?
12Academy Sports + Outdoors (ASO) John Zolidis
john.zolidis@quovadiscapital.com
Our Outlook Assumes Better Near-term Profitability
and Faster Sales Growth in FY22 & FY23
➢ We estimate EPS and FCF/ share reaching $4 by FY23
Academy Sports and Outdoors, Inc.
Pro Forma Annual Earnings Model And Selected Financial Data QUO VADIS ESTIMATES
($ in Millions, Except per Share Data)
Fiscal Year Ends January
Fiscal Fiscal Fiscal Fiscal Fiscal Fiscal
2018A 2019A 2020E 2021E 2022E 2023E
Total retail sales $ 4,783.9 $ 4,829.9 $ 5,739.3 $ 5,569.1 $ 5,822.8 $ 6,167.5
% change -1.1% 1.0% 18.8% -3.0% 4.6% 5.9%
Gross profit $ 1,368.0 $ 1,431.2 $ 1,704.4 $ 1,678.0 $ 1,772.1 $ 1,895.5
% change -2.2% 4.6% 19.1% -1.6% 5.6% 7.0%
Gross profit margin 28.6% 29.6% 29.7% 30.1% 30.4% 30.7%
EBITDA $ 261.7 $ 296.7 $ 540.1 $ 498.5 $ 545.7 $ 621.4
EBTIDA margin 5.5% 6.1% 9.4% 9.0% 9.4% 10.1%
Diluted EPS $0.24 $1.60 $3.58 $2.78 $3.26 $3.98
% change -63.3% 555.9% 124.3% -22.3% 17.0% 22.1%
Total stores 253 259 260 264 273 282
% Δ in same-store sales -2.5% -0.7% 17.8% -2.4% 3.1% 4.0%
Free cash flow per share $1.03 $2.67 $9.09 $1.78 $3.90 $4.53
(1)
Source: Company data, Quo Vadis Capital, Inc. ests period contains extra week
13Academy Sports + Outdoors (ASO) John Zolidis
john.zolidis@quovadiscapital.com
Valuation: ASO Shares are Cheap on Near-Term
Street Forecasts and VERY Cheap vs. our FY23
Estimates
14Academy Sports + Outdoors (ASO) John Zolidis
john.zolidis@quovadiscapital.com
ASO shares currently trade atAcademy Sports + Outdoors (ASO) John Zolidis
john.zolidis@quovadiscapital.com
Using our FY23 Forecasts, ASO’s P/E isAcademy Sports + Outdoors (ASO) John Zolidis
john.zolidis@quovadiscapital.com
Investment Recap LONG idea Academy Sports (ASO)
Academy Sports (ASO) is a mispriced equity with the potential to more than
double over the next two years, in our opinion.
➢ The company is benefiting from a favorable tailwind of increased demand
for its products that we believe is secular and long-lasting in nature.
➢ The business is under-followed by Wall Street and various technical issues
mean that some data is wrong on key financial information platforms
➢ We believe that ASO has the potential to expand EBITDA margins to apx.
10% over the next three years due to leverage from top-line growth,
strong execution, and operational improvements which should yield EPS
and FCF/ shares of $4 or potentially higher.
➢ The Street is modeling the business more cautiously, setting up upward
revisions.
➢ Shares are trading at P/Es of less than 10x on Street forecasts for FY21
and exceptionally cheap (Academy Sports + Outdoors (ASO) John Zolidis
john.zolidis@quovadiscapital.com
Risks and Other Considerations
Academy Sports (ASO) is a regional operator of big box, category-specific
merchandise produced mainly by others.
➢ The company is exposed to competition from online-only players with
different cost structures and objectives.
➢ Academy also faces competition from its vendors going direct to
consumers (disintermediation)
➢ We could be misreading the longevity of increased demand for sporting
goods and other merchandise sold by ASO which could render our
outlook too optimistic
➢ ASO could face increased competition in its core markets or fail to expand
successfully into new markets
➢ As a retailer of guns and ammunition ASO could face either legislative
restrictions or negative publicity related to firearms
18Academy Sports + Outdoors (ASO) John Zolidis
john.zolidis@quovadiscapital.com
Disclosures
General Disclosures:
Quo Vadis Capital, Inc. (“Quo Vadis”) is an independent research provider offering research and consulting services. The research
products are for institutional investors only.
The price target, if any, contained in this report represents the analyst’s application of a formula to certain metrics derived from actual
and estimated future performance of the company. Analysts may use various formulas tailored to the facts and circumstances
surrounding a specific company to arrive at the price target. Various risk factors may impede the company’s securities from achieving
the analyst’s price target, such as an unfavorable macroeconomic environment, a failure of the company to perform as expected, the
departure of key personnel or other events or circumstances that cannot be reasonably anticipated at the time the price target is
calculated. Quo Vadis may change the price target on this company without notice. Additional information on the securities mentioned
in this report is available upon request. This report is based on data obtained from sources Quo Vadis believes to be reliable; however,
Quo Vadis does not guarantee its accuracy and does not purport to be complete. Opinion is as of the date of the report unless labeled
otherwise and is subject to change without notice. Updates may be provided based on developments and events and as otherwise
appropriate. Updates may be restricted based on regulatory requirements or other considerations. Consequently, there should be no
assumption that updates will be made. Quo Vadis disclaims any warranty of any kind, whether express or implied, as to any matter
whatsoever relating to this research report and any analysis, discussion or trade ideas contained herein. This research report is
provided on an "as is" basis for use at your own risk, and neither Quo Vadis nor its affiliates are liable for any damages or injury
resulting from use of this information. This report should not be construed as advice designed to meet the particular investment needs
of any investor or as an offer or solicitation to buy or sell the securities or financial instruments mentioned herein. This report is
provided for information purposes only and does not represent an offer or solicitation in any jurisdiction where such offer would be
prohibited. Commentary regarding the future direction of financial markets is illustrative and is not intended to predict actual results,
which may differ substantially from the opinions expressed herein. Past performance is not a guide to future performance, future
returns are not guaranteed, and a loss of original capital may occur.
The analyst who is the author of this report does not have a position in shares of the companies that are the subjects of this report.
However, Quo Vadis prohibits analysts from trading in a way that is inconsistent with opinions expressed in reports [subject to
exceptions for unanticipated significant changes in the personal financial circumstances of the analyst].
This report may not be reproduced in part or in whole. Please do not redistribute this report.
Reg AC Certification:
All of the views expressed in this research report accurately reflect the research analyst's personal views about any and all of the
subject securities or issuers. No part of the research analyst's compensation was, is, or will be, directly or indirectly, related to the
specific recommendations or views expressed by the research analyst in the subject company of this research report.
19Academy Sports + Outdoors (ASO) John Zolidis
john.zolidis@quovadiscapital.com
Appendix: Quo Vadis Capital, Inc. : Our Process
➢ Our focus is on consumer sector, and we specialize in companies which can be
analyzed by estimating and segmenting unit economics
➢ We solve for ROIC and Return on Incremental Invested Capital (ROIIC) at the
unit and corporate level
➢ In LONGS we look for companies with upside to consensus estimates, a high
ROIC and/or a rising trend in ROIC, rising margins, or accelerating growth and
attractive valuations
➢ In SHORTS we look for companies with downside to consensus forecasts, weak
ROIC or deteriorating trend in ROIC, margin contraction, decelerating growth
and unattractive valuations
➢ OUR FAVORITE INVESTMENT THEME is finding a company where the next
dollar to be invested in the business has a significantly different return profile
than the base business. In other words, return on incremental investment is
materially greater or lower than return on overall investment (ROIIC is > or <
ROIC)
20You can also read