SOUTH EAST OFFICES - Colliers International
←
→
Page content transcription
If your browser does not render page correctly, please read the page content below

SOUTH EAST
UNITED KINGDOM

OFFICES
QUARTER 2 | 2018
2

                                                         Q2 18 TOTAL TAKE-UP
   Q2 2018 | South East Offices | United Kingdom
Research & Forecasting Report | Colliers International

                                                                       766,335                         SQ FT

                                                                       63.5%
                                                                       QUARTER-ON-QUARTER

                                                                       -5.2%
                                                                       5-YEAR QUARTERLY AVERAGE

                                                         MARKET HIGHLIGHTS
                                                                       • After a slow start to the year, take-up across     • The South East continues to see strong
                                                                         the South East has rebounded significantly in        demand from the serviced office/co-working
                                                                         the second quarter. Leasing activity is 63.5%        operators. Total take-up in the sector (since Q1
                                                                         up q-o-q and stands at 766,335 sq ft, which          2017) now stands at 495,852 sq ft (see Figure
                                                                         is only 5% below the 5 yr quarterly average          2). Q2 2018 has seen the greatest leasing
                                                                         (808,326 sq ft).                                     activity from this sector at 138,800 sq ft.
                                                                       • Take-up was buoyed by the largest deal this          Spaces has been the most prevalent operator
                                                                         quarter to Publicis who are consolidating from       acquiring new premises making up 48% of
                                                                         offices in Fitzrovia and Brick Lane. They took       leasing in this sector this quarter.
                                                                         212,000 sq ft at 2 Television Centre in White      • Since 2010, annual levels of available space
                                                                         City, which is home to The White Company and         have decreased by 42%, this is because of the
                                                                         Soho House who recently acquired space in            lack of supply across the region.
                                                                         this new building.                                 • Annual rental growth across the region can be
                                                                       • 28% of deals were for space between 20,000           found in key centres like Windsor (11%), Slough
                                                                         and 50,000 sq ft, comprising of six deals. (see      (9%) and St Albans (9%), where occupier
                                                                         Figure 1).                                           demand and lack of supply are pushing up rents
                                                                       • The two largest deals in this size band were in      (see Figure 3).
                                                                         excess of 40,000 ft. These included the letting    • Occupiers continue to seek best quality
                                                                         at Chineham Gate, Basingstoke (49,500 sq ft)         space which many landlords/developers have
                                                                         to Vyaire and the Office Group took 40,000 sq        embraced by delivering new or refurbished
                                                                         ft at 1 Lyric Square in Hammersmith. Lettings        buildings that provide unique and more
                                                                         between 5,000 and 10,000 sq ft accounted for         desirable space to differentiate from the market
                                                                         23% of total take-up, with the average deal size     norm. We anticipate further rental growth in key
                                                                         7,087 sq ft.                                         towns against a backdrop of diminishing supply.
3
% TAKE-UP BY MARKET % AVAILABILITY BY MARKET
35% 33% 21% 12% 45% 30% 12% 11%
Research & Forecasting Report | Colliers International
Q2 2018 | South East Offices | United Kingdom
2%
TV South M25 West London North M25 SW London NW London
VACANCY % AND TRENDS
TV 9.1% South M25 15.2% West London 12.7%
North M25 6.1% NW London 0.5% SW London 4.9%
FIGURE 1: 2018 PERCENTAGE FIGURE 2: SERVICED OFFICE
TAKE-UP BY SIZE BAND TAKE-UP Q1 2017-Q2 2018 (SQ FT)
5-10K 10K-20K 20k-50K 50k+ Deals 138,800
113,223
Q1 Q2
14 25 70,661
20% 23% 60,508 59,660
53,000
25%
9 12
21%
6
28%
55% 9 1
28% Q1 Q2 Q3 Q4 Q1 Q2
2017 2017 2017 2017 2018 2018
FIGURE 3: ANNUAL RENTAL GROWTH BY TOWN
Windsor 11% £36.00 psf
Slough 9% £35.00 psf
St Albans 9% £37.50 psf
Harrow 9% £30.00 psf
Woking 8% £32.50 psf
Reading OOT 7% £36.50 psf
Ealing 4% £39.00 psf
Bracknell 4% £25.50 psf4
Q2 2018 | South East Offices | United Kingdom
Research & Forecasting Report | Colliers International
TJX, Watford Intu Shopping Centre, Watford
AREAS IN FOCUS
ST ALBANS AND WATFORD
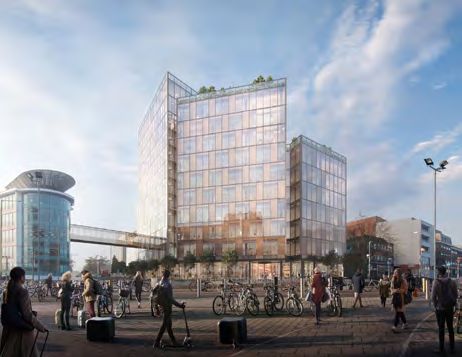
Watford and St Albans are two of the key towns Watford Borough Council has recently committed to
in the North M25. The total Watford office market a redevelopment programme for the town centre.
is 3.5 million sq ft whilst St Albans has 1.05 Over the next 10-15 years, more than £1.5bn will
million sq ft of stock. Both have seen substantial be invested in the town, including an extension of
rental growth since 2015 with rents in St Albans the Intu Watford shopping centre, extension of the
increasing by 56% and by 38% in Watford. Both Metropolitan Underground Line, and a major mixed
towns benefit from strong rail links into London, use redevelopment of the land surrounding Watford
and have a strong town centre office market, tightly Hospital.
focused around the station.
St Albans saw over 60,000 sq ft of take up in 2017,
Rents in the Northern M25 have historically trailed which is almost twice the long term average of
the core Thames Valley and South M25 markets, c.32,000 sq ft per annum, and exceeded the North
sitting between high teens to mid-£20’s psf. M25 Town average for 2017. Key transactions
Given the lower rental tone in comparison to the included lettings to Apple, AECOM and Sherrard’s
remainder of the South East, and subdued demand Solicitors.
recovery since 2007, new development has not
Given the strong market characteristics identified
been viable. The office pool has reduced further as
above, both Watford and St Albans continue
stock has been removed via Permitted Development
to prove popular with investors. To put this in
and not been replaced with new development.
to context, in the past 24 months, Watford has
Supply has become increasingly constrained,
witnessed 14 office investment transactions
resulting in strong levels of rental growth in both of
totalling £153 million whilst St Albans saw £39
these key towns.
million invested across three transactions. Prime
There have been no new developments in St net initial yields on Clarendon Road, Watford and in
Albans since 2007, and the only new build in St Alban’s town centre currently sit between 5.0%
Watford in the last decade was Clarendon Works, - 5.5%.
which was pre let during construction in 2017 to
Prime rents in St Albans and Watford achieved in
Salmon. The other key office development site
this cycle currently sit at £37.50 psf and £33.00
opposite Watford Junction Station was purchased
psf respectively.
in 2016 by the town’s major occupier, TJX to
develop 150,000 sq ft for their own occupation,
demonstrating their commitment to the town.5
ST ALBANS VS WATFORD TAKE-UP TRENDS
St Albans Watford NM25 Annual Average
Research & Forecasting Report | Colliers International
Q2 2018 | South East Offices | United Kingdom
200,000
150,000
sq ft
100,000
50,000
0
2010 2011 2012 2013 2014 2015 2016 2017 Q1 2018 Q2 2018
ST ALBANS VS WATFORD AVAILABILITY
St Albans Watford NM25 Annual Average
800,000
600,000
sq ft
400,000
200,000
0
2010 2011 2012 2013 2014 2015 2016 2017 Q1 2018 Q2 2018
ST ALBANS VS WATFORD RENTAL GROWTH
St Albans Watford
£40.00
£35.00
£30.00
£25.00
£20.00
£15.00
£10.00
£5.00
£0.00
2010 2011 2012 2013 2014 2015 2016 2017 Q1 2018 Q2 2018
ST ALBANS & WATFORD
POPULAR WITH INVESTORS
OVER LAST TWO YEARS
WATFORD BOROUGH COUNCIL COMMITED
£1.5BN
WATFORD
14 TRANSACTIONS
£153 MILLION
TO THE REDEVELOPMENT OF TOWN
CENTRE OVER 10-15 YEARS ST ALBANS
3 TRANSACTIONS
£39 MILLION6
Q2 2018 | South East Offices | United Kingdom
Research & Forecasting Report | Colliers International
INVESTMENT COMMENTARY
Q2 2018 witnessed 38 South East office • Runneymede Council’s acquisition of the
transactions totalling approximately £690 million. Volkswagen Financial Services UK HQ in Milton
This is a 15% decrease on Q1 volumes which saw Keynes for £50.15 million
37 transactions totalling £810 million.
Whilst investor demand for South East offices
Transaction volumes and the number of deals are remains strong, there are fewer sales being openly
similar to the levels achieved in Q2 2017 which marketed which in turn has led to suppressed
witnessed 40 deals and £700 million transacted. levels of transaction volumes. This trend has
developed over the past two years where overall
The key trends for the second Quarter were:
transaction volumes have been weighted to the
• Strong appetite remains for secure multi-let second half of each year as evidenced in the graph
town centre offices below. This was particularly evident in 2017 when
• Limited supply of openly marketed investment almost 70% of stock by value transacted in the
opportunities second half of the year.
• A significant weight of money is still pursuing Financial Institutions continue to be the dominant
office investment opportunities in the South East buyer of South East Offices, accounting for 29%
of all transactions in the Quarter. Other active
• Fewer Permitted Development opportunities
investors in Q2 included; Property Companies
being marketed although demand remains strong
(21%), Private Individuals (18%), Councils (13%),
• Varied buyer diversity with Financial Institutions, Owner Occupiers (11%), and Residential Developers
Property Companies, Private Investors and (5%). There was a notable absence of Overseas
Councils all actively targeting South East offices Investors and Private Equity acquiring in the
Quarter.
• Financial Institutions were busiest in the Quarter
and responsible for 29% of all acquisitions Another key trend for the Quarter has been the
improvement in investor sentiment towards
• Councils remain one of the key buyers of offices
South East Offices. With the industrial sector
in the market
undergoing significant yield compression, offices
• An absence of Private Equity and Overseas are increasingly looked at by investors as a
Investors acquiring in the Quarter sector where greater returns are achievable. With
• Prime net initial yields remain resilient at 5% CrossRail nearing completion and a continued
reduction of office stock through permitted
Five transactions accounted for £326 million, which
development rights, many South East office
is the equivalent of 47% of the total volume of all
markets continue to experience rental growth.
transaction in Q2. These included;
Councils have continued to show a strong appetite
• Runnymede Council’s acquisition of Pine Trees,
for long income single-let offices, most notably
Staines for £80.7 million
the £50.15 million acquisition of the Volkswagen
• Royal London’s £78 million acquisition of Financial Services UK HQ in Milton Keynes by
Cambridge Research Park Runneymede Borough Council.
• Lincoln MGT’s £67 million acquisition of The secondary out of town office market has
the 930,000 sq ft Station Hill, Reading struggled in Q2 as investors have reservations
redevelopment site regarding the possible effects of Brexit on the
occupier market.
• Aberdeen Standard’s £50.25 million acquisition
of The White Building in Reading7
TOTAL ANNUAL NUMBER OF TRANSACTIONS
TRANSACTION VOLUMES BY INVESTOR TYPE (%)
Research & Forecasting Report | Colliers International
Q2 2018 | South East Offices | United Kingdom
H1 H2
OTHER 3%
5% RESIDENTIAL
5,000
4,500
PROPERTY 21%
COMPANY
4,000
3,500 18% PRIVATE
Total Volumes (millions)
3,000
OWNER 11%
2,500 OCCUPIER
2,000
1,500
29% FUNDS
1,000
500
COUNCILS 13%
0
2014 2015 2016 2017 2018
Q2 2018 SE INVESTMENT HIGHLIGHTS
Size (sq ft) AWULT to Expiry (Break) Price Net Initial Yield Purchaser
PINE TREES, VOLKSWAGEN FINANCIAL SERVICES HQ,
STAINES MILTON KEYNES
170,000 101,237
N/A 21.6 years (16.6 years)
£80,700,000 £50,150,000
N/A 4.83%
Runnymede Council Runnymede Council
CAMBRIDGE RESEARCH PARK, SIGMA HOUSE,
CAMBRIDGE BASILDON
160,000 161,986
N/A 11 years
£78,000,000 £28,250,000
£488 psf 6.55%
Royal London Black Sand
3 ARLINGTON SQUARE, AXIS ONE,
BRACKNELL LANGLEY
67,376 56,697
7.2 years (3.4 years) 9.2 years
£22,645,000 £20,000,000
6.25% 4.80%
Orchard Street Runnymede Council
MOTT MACDONALD HOUSE,
CROYDON
64,560
6.8 years
£21,070,000
5.50%
RockspringMETHODOLOGY AND CHANGES TO STATISTICAL ANALYSIS
Colliers International South East Offices has changed our geographic boundaries to separate out NW London, West London and SW London.
The map below provides a detailedA43representation of the towns and cities included in these groupings.
A43
Milton Keynes
A43
Stevenage
M40
NORTH M25
Welwyn Garden City
St Albans Hatfield
Hemel Hempstead
Oxford
Harrow
NW LONDONM11
Wembley
Watford Borehamwood
High Wycombe Ealing
White City
WEST LONDON Hammersmith
Marlow South Ruislip Chiswick
Uxbridge
Richmond
Maidenhead Stockley Park
THAMES VALLEY Slough Hayes & Heathrow SW LONDON
Brentford Twickenham
Windsor Wimbledon
Reading Kingston upon Thames
A2
Staines New Malden
Bracknell
Newbury
Chertsey
Croydon M20
Weybridge
Camberley Epsom
Woking
M26
BLACKWATER VALLEY Farnborough
Leatherhead
Hook Fleet
SOUTH M25 Reigate
Redhill
Basingstoke
Guildford
M23
A3
Crawley
FOR MORE INFORMATION
NATIONAL OFFICES INVESTMENT RESEARCH & FORECASTING
Mark Taylor Rob Cregeen Lisa Dean
+44 20 7344 6575 +44 20 7344 6579 +44 20 7487 1961
mark.taylor@colliers.com rob.cregeen@colliers.com lisa.dean@colliers.com
Mark Emburey Alex Titheridge
+44 20 7344 6906 +44 20 7487 1617
mark.emburey@colliers.com alex.titheridge@colliers.com
Toby Lumsden Tom Farkas
+44 20 7344 6706 +44 20 7487 1609
toby.lumsden@colliers.com thomas.farkas@colliers.com
Alys Holland
+44 20 7344 6794
alys.holland@colliers.com
Colliers International Group Inc. (NASDAQ:CIGI) (TSX:CIGI) is a top tier global real estate services and investment management company operating
in 69 countries with a workforce of more than 12,000 professionals. Colliers is the fastest-growing publicly listed global real estate services and
Colliers International
investment management company, with 2017 corporate revenues of $2.3 billion ($2.7 billion including affiliates). With an enterprising culture and
significant employee ownership and control, Colliers professionals provide a full range of services to real estate occupiers, owners and investors
50 George Street
worldwide, and through its investment management services platform, has more than $20 billion of assets under management from the world’s
most respected institutional real estate investors.
London W1U 7GA
Colliers professionals think differently, share great ideas and offer thoughtful and innovative advice to accelerate the success of its clients. Colliers
has been ranked among the top 100 global outsourcing firms by the International Association of Outsourcing Professionals for 13 consecutive years,
more than any other real estate services firm. Colliers is ranked the number one property manager in the world by Commercial Property Executive
for two years in a row.
Colliers is led by an experienced leadership team with significant equity ownership and a proven record of delivering more than 20% annualized
returns for shareholders, over more than 20 years.
Research & Forecasting
For the latest news from Colliers, visit Colliers.com or follow us on Twitter: @Colliers and LinkedIn.You can also read