INVESTOR PRESENTATION - MARCH 2019 - AWS
←
→
Page content transcription
If your browser does not render page correctly, please read the page content below

INVESTOR
PRESENTATION
MARCH 2019
FORWARD-LOOKING STATEMENT

 Some information provided in this document will be forward-looking, and accordingly, is
 subject to the Safe Harbor provisions of the federal securities law. These statements
 include, but are not limited to, statements regarding future revenues, gross margin, selling,
 general and administrative expenses, operating income, depreciation and amortization,
 income tax expense, Adjusted EBITDA, EBIT margin, business prospects and product
 pipeline. We caution you that these statements are subject to a number of risks and
 uncertainties described in the Risk Factors section of the Company's Annual Report on
 Form 10-K, filed with the Securities and Exchange Commission (the “SEC”). Accordingly,
 all actual results could differ materially from those described in this presentation. Those
 viewing this presentation are advised to refer to Crocs' Annual Report on Form 10-K, as
 well as other documents filed with the SEC for the additional discussions of these risk
 factors. Crocs is not obligated to update these forward-looking statements to reflect the
 impact of future events.

                                                                                                 2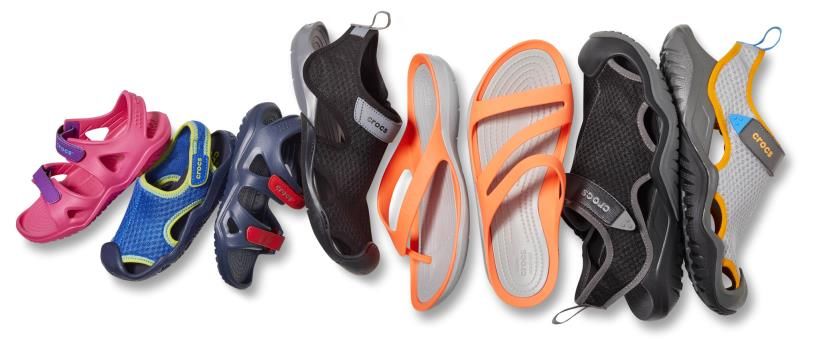
AGENDA

• Positioned for Growth………………………………………………………………4

• Financial Information………………………………………………………………15

• Key Investment Considerations…………………………………………....…….19

• Appendix……………………………………………………………………………21

                                                           3
POSITIONED FOR GROWTH

                        4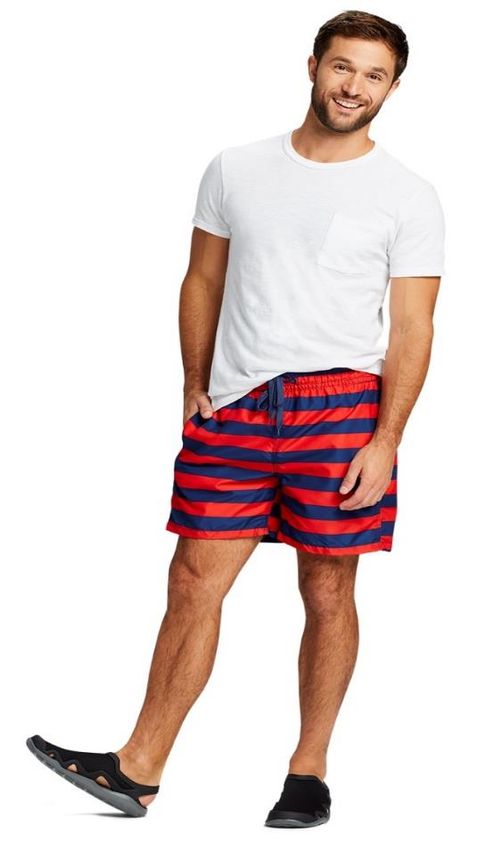
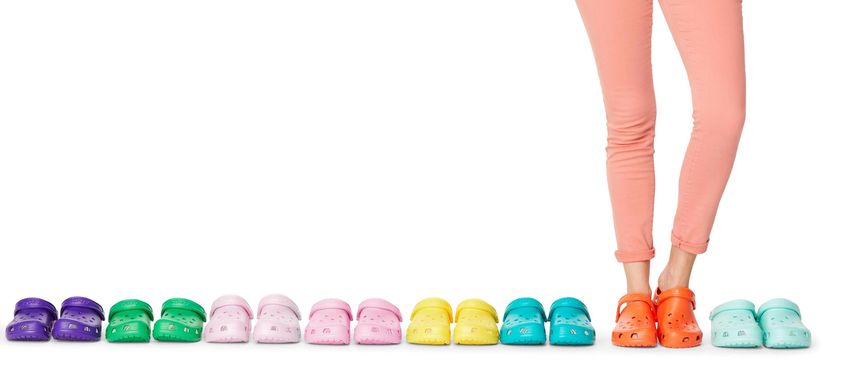
A POWERFUL BRAND POSITIONED FOR GLOBAL GROWTH

 Scale Brand:                     Iconic Product:                    Democratic Brand:

 Top 10                                                                                    For men,
 non-athletic                                  The Classic Clog                             women,
 global footwear brand                                                                     and kids

 Globally Recognized:             Global Reach:                      World Class Talent:

 ~65%           Global Aided
                Brand Awareness                     Distributed in
                                                                        Driving product
                                                                        and marketing
                                              over 90 countries
                                                                        innovation

                                                                                                      5
REPOSITIONED FOR LONG-TERM SUCCESS

             1                             2                           3

  Simplify the Business to       Improve the Quality of       Generate Sustainable,
      Reduce Costs                    Revenues              Profitable Revenue Growth

 Heavy Lifting Substantially   Revenue Base Substantially   Confident in Pathway to
         Complete                   More Profitable                Growth

     Confident in Pathway to
            Growth
                                                                                        6
SUSTAINABLE AND PROFITABLE GROWTH PLAN

               Product                        Channel                            Region

                     1                              2                                 3
     •   Clogs: Innovate & grow      •   E-commerce: double digit       •   Asia: largest long-term
         clog relevance                  growth continues                   growth potential
     •   Sandals: Significant long   •   Wholesale: greatest            •   Americas: strong growth
         term growth potential           growth opportunities within        momentum
                                         e-tail accounts and
     •   Visible Comfort                 distributors
         Technology
                                     •   Retail: prioritize outlets -
                                         the most profitable format                                   7
GROW CLOG RELEVANCE

• Market leader in $4B* growing global category

• Grew clog revenues by 13% in 2018 to ~55% of
  footwear sales

• Strategic goal: drive Clog Relevance by
      ‒ Impactful collaborations
      ‒ Trend right colors and graphics
      ‒ Relevant licenses
      ‒ Personalization with expanded Jibbitz charms

• Highest gross margin silhouette

* Internal Estimate

                                                       8
SANDALS: SIGNIFICANT LONG-TERM GROWTH
  OPPORTUNITY                     Essential, e.g. CrocBand Flip:

• $23B* fragmented global casual sandal** market with no clear
  market leader

• Grew sandal revenues by 19% in 2018 to ~23% of footwear
  sales                                                               Active, e.g. Swiftwater:
    ‒ On top of 26.4% growth in 2017

• A significant long-term growth opportunity
    ‒ Clear adoption by the core Crocs consumer
    ‒ Focus on women: 2/3 of the market - gateway for new
      consumers
    ‒ Play in multiple wearing occasions; essential, active & style   Style, e.g. Sloane:
    ‒ Leverage global distribution
    ‒ Boost marketing support to increase Sandal Awareness

           * Internal Estimate; ** includes flips and slides                                     9
OUR GROWTH WILL BE IGNITED BY POWERFUL
    GLOBAL SOCIAL & DIGITAL MARKETING
                                                                    BRAND AMBASSADORS
• Evolving Come As You Are campaign to incorporate impactful
  local brand ambassadors and influencer activations

• Focusing on driving clog relevance and sandal awareness

• Expanding digital reach and engagement in top five markets
  through increased investment

• Driving further brand heat and relevance through collaborations   LOCAL INFLUENCERS

• Improving social engagement thru locally relevant platforms

                                                                                        10
DOUBLE DIGIT E-COMMERCE GROWTH CONTINUES
Primary focus on company owned e-commerce and controlling E-COMMERCE REVENUE
brand presence on key marketplaces
• E-commerce: Crocs operated e-commerce sites
‒ Fast growing distribution channel driven by global consumer adoption
and more effective digital marketing 15% CAGR
‒ Investment in people and technologies to elevate consumer
experience
• Marketplaces: Expanding direct participation in leading global
marketplaces
‒ Controlling and elevating brand representation
‒ Winning digital channel
‒ Active on 8 marketplaces
o Launched 5 sites in 2018
2014 15 16 17 18
o Targeting 5+ additional sites in 2019
11E-TAIL AND DISTRIBUTORS DRIVE WHOLESALE
• E-tailers and distributors represent approximately 2018 DISTRIBUTOR FOOTPRINT
half of the global wholesale business
• Multibrand e-tailers are gaining share globally
‒ Crocs: achieving consistent double-digit e-tail
growth
‒ Elevating the brand representation
‒ Clear product segmentation
‒ Investing in on-site marketing
• Distributors represent Crocs in large but often
under penetrated markets Region # of distributors*
‒ Strong portfolio of leading distributors Americas 8
‒ Close alignment to Crocs product and marketing Asia 15
strategies EMEA 31
*Excludes partners operating stores in Company-operated
countries
12PRIORITIZE OUTLET GROWTH WITHIN RETAIL
• Retail fleet has been rightsized and majority is STORE COUNT
now focused on outlet stores
585 559 558
• Outlet merchandising strategy has been
repositioned to majority “Built for Outlet”
447
assortments
383
• In Americas, outlet fleet is well positioned and
focus will be on comp stores growth
Non-Outlet
• In EMEA, modest full price store closings will
continue; have growth opportunities in leading
outlet centers
Outlet
• In Asia, primary outlet growth will be in Japan
and China
2014 15 16 17 18
13ASIA IS LARGEST GROWTH OPPORTUNITY
Asia – Most opportunity for growth
• Increase brand recognition GLOBAL CLOG & SANDAL FOCUS
• Optimize China opportunity
• Strong e-commerce growth and rapid marketplace expansion
• Multichannel growth in direct markets: China, India, Japan and South
Korea
• Strong growth and incremental penetration in distributor markets
Americas – The largest region
• Maximize clog growth and expand sandal penetration at wholesale
• Leverage leading position with major e-tailers
• Continued strong e-commerce growth
EMEA – The most diverse region
• Maximize digital commerce with a focus on e-tail and marketplaces
• Drive wholesale growth through distributors
14FINANCIAL INFORMATION
152018 - A VERY SUCCESSFUL YEAR
• Robust revenue growth
‒ Growth of 6.3% despite store closures and business model changes reducing revenues by ~$60M
• Improved the quality of revenues
‒ Fewer and narrower promotions and less liquidation
• Simplified the business to reduce costs
‒ Right sized our brick and mortar store fleet and associated overhead
‒ Closed Crocs-owned manufacturing facilities and implemented cost-saving process improvements
• Strengthened our balance sheet
‒ Generated strong free cash flow
‒ Increased borrowing capacity
‒ Eliminated preferred shares; simplified capital structure
• Repurchased 3.6M common shares on the open market for ~$63M; average cost/share of $17.42
• 5.8% EBIT margin; up ~400 bps as progress continues towards a double digit EBIT margin
16FULL YEAR 2019 GUIDANCE (AS OF 2/28/19)
• Revenues: Increase 5-7% over $1,088.2M in 2018
‒ Expecting store closures to reduce revenues by ~$20M and a negative currency impact
of ~$20M
‒ Growth estimated at 7%-9% absent impact of store closures
• Gross margin ~49.5% vs. 51.5% in 2018; projected decline due to:
‒ Higher freight costs and negative currency impact
‒ Non-recurring charges related to the new DC, which are expected to reduce gross
margin by ~100 bps but are expected to be recouped in 2020
• SG&A: ~41% of revenues compared to 45.7% in 2018
‒ Includes $3-$5M of non-recurring charges compared to $21.1M in 2018
• EBIT margin: ~ 8.5% compared to 5.8% in 2018; excluding all non-recurring
charges, anticipate achieving our interim low DD margin target
• CAPEX: ~$65M compared to $12M in 2018; investing to drive operational
efficiencies, improve the customer experience and enable future growth
‒ Includes ~$35M for the new DC; balance for IT and infrastructure investments, some of
which were deferred from last year, and routine spend
171Q 2019 FINANCIAL GUIDANCE (AS OF 2/28/19)
• Revenues: $280 - $290M vs. $283.1M in 1Q18
‒ Expecting store closures to reduce revenues by ~$6M and a negative
currency impact of ~$10M
‒ Reflects the Easter shift, which results in DTC sales associated with the
holiday shifting into Q2, and the impact of strong demand last quarter,
which is constricting inventory available for certain at-once orders
• Gross margin: ~45.5% compared to 49.4% in 1Q18, with the decline
due to:
‒ Higher freight costs, including the use of air freight to replenish inventories,
a negative currency impact, and the Easter shift
‒ Non-recurring charges related to the new DC, which we expect to reduce
gross margin by ~50 bps
• SG&A: 37% to 38% of revenues compared to 40.2% in 1Q18
‒ Includes non-recurring charges of ~$1M compared to $2.5M in 1Q18
18KEY INVESTMENT
CONSIDERATIONS
19KEY INVESTMENT CONSIDERATIONS
Successful business transformation will
An unmistakable icon recognized A powerful global brand with a drive further increases in shareholder
around the world large, democratic consumer base value
• Growing revenues and gross margin
while reducing SG&A; a sustainable,
profitable business model
• Clear path to a double digit EBIT
Management team with deep
margin
industry experience and essential One of the world’s 10 largest • Strong balance sheet
skills non-athletic footwear brands
20APPENDIX
21HIGHLIGHTS OF BLACKSTONE DEAL
• Background: In 2014, Blackstone invested $200M in Crocs Preferred Shares
‒ Earned 6%/$12M dividend annually and a net income allocation in any quarter with positive earnings
‒ Convertible at $14.50/sh into ~13.8M shares of Common Stock. Crocs could only force conversion if the stock traded at $29 for 20
consecutive trading days.
• December 2018 Transaction: Four Key Elements
‒ 50% of the preferred was redeemed at a price equivalent to $26.64 per share ($183.7M)
‒ 50% of the preferred was converted into 6.9M shares of common; Blackstone agreed to a nine month lock-up
‒ Blackstone representatives remain on the Crocs Board, their right to nominate future directors fell from two to one
‒ Crocs made a one-time $15M payment to Blackstone; amount equals the preferred dividend that would have been payable between
10/1/18 and 12/31/19
• Benefits of the Transaction
‒ The $12M annual dividend and the preferred share allocation ended immediately.
‒ 6.9M shares of common were effectively repurchased in one transaction. Crocs acquired a large block of its common stock without the
price uncertainty and volume limitations associated with open market purchases.
‒ Blackstone signaled its ongoing confidence in Crocs’ future by agreeing to an extensive lock-up; Crocs benefits from Blackstone’s
continued Board participation and expertise.
• 4Q18 and 2018 Impact
‒ In the 4th quarter of 2018, the Company recorded $120M of preferred share dividend and dividend equivalents in connection with the
transaction along with other non-recurring charges. These amounts had a material negative impact on our GAAP net income (loss)
attributable to common stockholders and net income (loss) per common share for the quarter and full year. See the Company’s February
28, 2019 press release for further details and a reconciliation of GAAP to non-GAAP results.
22FRAMEWORK FOR A DOUBLE DIGIT EBIT MARGIN
Drive Double Digit E-commerce and Modest
1 Wholesale Revenue Growth
Sustainable Gross Margin in the
2 Low 50% Range
Core Molded Product generates high quality revenue
SG&A in the Low 40% Range
3 Leverage SG&A over growing revenue base
23You can also read