Staying at the Forefront of Climate Change - ESG Breakfast Sponsored by - Responsible Investment ...
←
→
Page content transcription
If your browser does not render page correctly, please read the page content below

ESG Breakfast
Staying at the Forefront
     of Climate Change
                   Sponsored by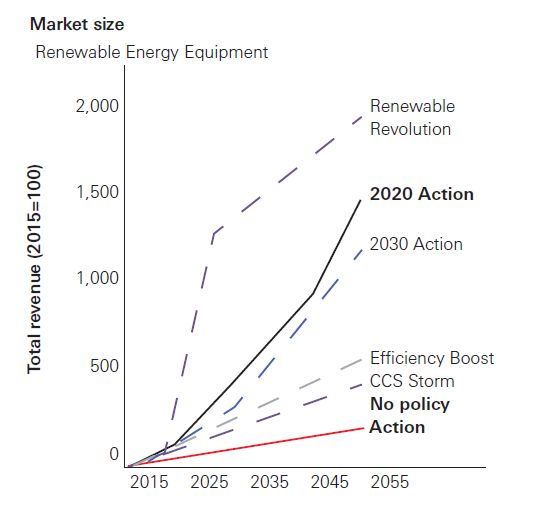
Low-carbon transition scenarios
Exploring scenario analysis for equity valuations

January 2019

Sandra Carlisle

                                                    For Institutional Investor and Financial Advisor Use Only
Contents
Climate change challenge 2
Low-carbon transition scenarios 3
Why use a scenario-based approach? 4
Investor insights 5
Outcomes 9
Important Information 10
1 For Institutional Investor and Financial Advisor Use OnlyClimate change
The scale of the challenge
Climate change is one of the greatest challenges of the 21 st century, and achieving a low-carbon transition poses
significant risk, but also potential reward, for investors
So how can investors navigate the uncertainties and identify the opportunities that a low
carbon transition introduces to their portfolios?
CO2 concentration on the rise Temperatures are rising
ppm 0.8 Temperature Anomaly (0C)
410
0.6
2016
405 0.4
2015
0.2
400 2014
2013 0.0
395
0.2
NASA Goddard Institute for Space Studies
390 0.4 Hadley Centre/Climatic Research Unit
NOAA National Centre for Environmental Information
0.6 Japanese Meteorological Agency
385
Jan Feb Mar Apr May Jun Jul Aug Sep Oct Nov Dec
188 0 190 0 192 0 194 0 196 0 198 0 200 0 202 0
Source: Earth System Research Laboratory (NOAA)
Source: NASA. Temperature data from four international science institutions show rapid warming in the past few decades and that the last decade has been the warmest on record.
2 For Institutional Investor and Financial Advisor Use OnlyLow-carbon transition scenarios
A powerful way to explore policy and technology uncertainties
We use a forward-looking scenario-based approach to explore how policy timing and future technology costs influence economic
outcomes and investment decisions, modelled using the MSCI All Countries World Index (MSCI ACWI) as a representative
portfolio
Produced using Imperial College London’s TIMES Integrated Assessment Model (TIAM) based on economic impacts from 2018-2050
Uses a simple DCF (discounted cash flow) model, to estimate the performance of companies in the MSCI All Country World Index in accordance with each of the
6 scenarios
Policy Timing Future Technology Costs
No Policy Action Renewable Revolution
No further policy changes Reduced costs for solar and wind energy
2020 Action CCS Storm
At least a 50% chance of limiting warming to 2°C Reduced costs for Carbon Capture and Storage
2030 Action Efficiency Boost
At least a 50% chance of limiting warming to 2° Increases in energy productivity
Note: All non-technology uncertainty scenarios are based on best available technology cost estimates.
Source: Scenario design method developed by Vivid Economics/HSBC Global Asset Management.
3 For Institutional Investor and Financial Advisor Use OnlyWhy use a scenario-based approach?
Advantages of the analysis
The resulting research makes a valuable contribution to our ongoing assessment of the implications
of climate change for investment strategies and portfolios
The resulting pathways give valuable insights into the nature and relative size of impacts within sectors and in comparison
with others in each scenario
This enables us to see which sectors and companies are likely to perform relatively well in which scenarios, outlining
potential opportunities for investors
Overall, the outcomes are mixed, demonstrating a wide variety of potential outcomes – some beneficial, others detrimental
4 For Institutional Investor and Financial Advisor Use OnlyInvestor insights
Across all scenarios - transition to limiting global warming to two degrees Celsius will have a considerable impact on net present value profits
at both sector and equity level ─ in comparison with a world where there is no new policy action
Although sector level impacts can be large, index-level impacts across the climate-action scenarios are modest, with a fall in the MSCI ACWI
in the 2020 Action scenario, of just around 2%
Note: Bars show the range between the 10th and 90th percentiles of company performance within each sector, and for the MSCI All Countries World Index as a whole; results are based on the 2°C 2020 Action scenario, and
data from Thomson Reuters, Trucost, Rystad Energy, Orbis Intellectual Property, and FTSE Russell Green Revenue. These sectors represent a subset of those analysed, which covered all sectors in which there are companies
listed on the MSCI ACWI.
Source: Vivid Economics/HSBC Global Asset Management.
5 For Institutional Investor and Financial Advisor Use OnlyInvestor insights
There are significant differences in exposure across sectors
Climate challenged
1 Coal sector Experiences extensive value loss. This emphasises the sector’s particular sensitivity to the timing of climate action.
2 Oil and gas sector Loses by around 25-40% across scenarios, although it performs somewhat better in the 2030 Action and CCS Storm scenarios.
Loses less than the coal and the oil and gas sectors. The analysis shows relatively smaller losses ranging from around 10% to
3 Cement sector
25%, with exposure more affected by timing than by technology.
Source: Vivid Economics/HSBC Global Asset Management “Low-carbon transition scenarios” report 6 For Institutional Investor and Financial Advisor Use OnlyInvestor insights
There are significant differences in exposure across sectors
Climate winners
Average value gains across the sector between 10-130%,
1 Renewable energy equipment
across the three technology scenarios
Technology, finance,
2 Largely sidestep the impact of the climate transition
communications and healthcare
Those with relatively low emissions intensity, producing
3 Emissions-intensive industries goods for which demand is price-insensitive and able to pass
costs through to consumers
Those with gas-focused portfolios, short production horizons
4 Fossil-fuel extraction sector
and relatively low production costs
Those in fast-growing markets with significant market shares
5 Cleantech Source: Vivid Economics/HSBC Global Asset Management.
and relatively more unrealised investment potential
Source: Vivid Economics/HSBC Global Asset Management “Low-carbon transition scenarios” report
7 For Institutional Investor and Financial Advisor Use OnlyInvestor insights
Even within a sector, impacts on individual equity values can vary considerably
The best performing 10% of companies are 54% better off in the two degrees Celsius 2030 Action scenario compared with the
Power-generation sector
No Policy Action version, while the worst-performing 10% are 48% worse off.
Energy-intensive industries or
Demonstrate within-sector variation many times greater than differences in average impacts across sectors.
oil and gas
This suggests there will be ‘climate winners’, even in emissions-intensive sectors that will otherwise suffer
Source: Vivid Economics/HSBC Global Asset Management “Low-carbon transition scenarios” report 8 For Institutional Investor and Financial Advisor Use OnlyOutcomes
How does this influence investor decisions?
Variation in outcomes across scenarios illustrates the potential risk associated with policy and technology uncertainty around the climate
transition and emphasises the importance of both scenario and asset-level analysis when making investment decisions.
The analysis allows for the identification of common characteristics of relative ‘climate winners’ and ‘climate winners’, across our illustrative
scenarios, suggesting to investors to position their portfolios now based on which future scenario they believe will most likely occur.
Large sector level impacts but modest index-level impacts across the climate-action scenarios indicates that a diversified portfolio could be
most resilient to climate-action risk.
Source: Vivid Economics/HSBC Global Asset Management “Low-carbon transition scenarios” report
9 For Institutional Investor and Financial Advisor Use OnlyImportant information
HSBC Global Asset Management is a group of companies in many countries and territories throughout the world that are engaged in investment advisory and fund management activities, which are
ultimately owned by HSBC Holdings plc. HSBC Global Asset Management is the brand name for the asset management business of HSBC Group. HSBC Global Asset Management (Canada) Limited is a
wholly owned subsidiary of, but separate entity from, HSBC Bank Canada and provides services in all provinces of Canada except Prince Edward Island.
This information is intended for institutional investors only.
This material has been prepared by HSBC Global Asset Management (UK) Ltd and has been approved for use in Canada, it is distributed for informational purposes only and is not a solicitation or an offer
to buy any security or instrument or to participate in any trading or investment strategy. All opinions and assumptions included in this presentation are based upon current market conditions as of the date of
this presentation and are subject to change. All investments involve risk including the loss of principal. This presentation contains data compiled from third party sources believed to be reliable, but the
accuracy of such data has not been verified. Any portfolio characteristics shown herein, including position sizes and sector allocations among others, are generally averages and are for illustrative purposes
only and do not reflect the investments of an actual portfolio unless otherwise noted. The investment guidelines of an actual portfolio may permit or restrict investments that are materially different in size,
nature and risk from those shown.
Any forecast, projection or target contained in this presentation is for information purposes only and is not guaranteed in any way. HSBC accepts no liability for any failure to meet such forecasts, projections
or targets.
This presentation outlines potential investment vehicles and makes certain assumptions about their structure, strategies and market environment, including projections about their underlying assets, none of
which have been purchased. All terms used herein are indicative and subject to change. Accordingly, there can be no assurance that the assumptions will prove to be correct, or that actual returns will be
consistent with those described herein.
Source: MSCI, the MSCI information may only be used for your internal use, may not be reproduced or redisseminated in any form and may not be used as a basis for or a component of any financial
instruments or products or indices. None of the MSCI information is intended to constitute investment advice or a recommendation to make (or refrain from making) any kind of investment decision and may
not be relied on as such. Historical data and analysis should not be taken as an indication or guarantee of any future performance analysis, forecast or prediction. The MSCI information is provided on an
“as is” basis and the user of this information assumes the entire risk of any use made of this information. MSCI, each of its affiliates and each other person involved in or related to compiling, computing or
creating any MSCI information (collectively, the “MSCI Parties”) expressly disclaims all warranties (including, without limitation, any warranties of originality, accuracy, completeness, timeliness, non-
infringement, merchantability and fitness for a particular purpose) with respect to this information. Without limiting any of the foregoing, in no event shall any MSCI Party have any liability for any direct,
indirect, special, incidental, punitive, consequential (including, without limitation, lost profits) or any other damages. (www.msci.com)
Copyright © HSBC Global Asset Management (Canada) Limited 2019. All rights reserved.
Expiry: March 13, 2019
DK1900062A
10 For Institutional Investor and Financial Advisor Use Only11
ESG Breakfast
Staying at the Forefront
     of Climate Change
                   Sponsored by
You can also read