Alpha Seeker Strategy Introduction - Risk-responsive investing for better portfolios - Thompson Capital Management ...
←
→
Page content transcription
If your browser does not render page correctly, please read the page content below
Alpha Seeker
 Strategy Introduction
Risk-responsive investing for better portfolios

                                                  1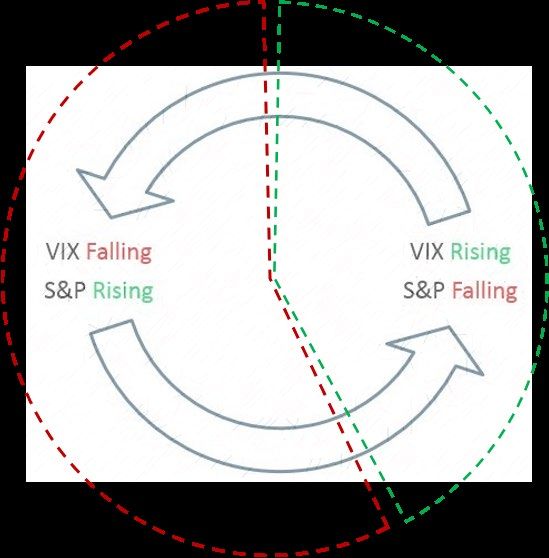
Risk-responsive investing for better portfolios
           Disclosures
Information presented does not involve the rendering of personalized investment advice, but is limited to the dissemination of
general information on products and services. This information should not be construed as an offer to buy or sell, or a solicitation of
any offer to buy or sell the securities mentioned herein.

This presentation should not be regarded as a complete analysis of the subjects discussed. All expressions of opinion reflect the
judgement of the advisor as of the date of the presentation and are subject to change.

Investments and/or investment strategies involve risk including the possible loss of principal. There is no assurance that any
investment strategy will achieve its objectives. For a complete description of investment risks, fees and services review the
Thompson Capital Management LLC firm brochure (ADV Part 2) which is available from your Investment Advisor Representative or
by contacting Thompson Capital.

Investment Advisory Services are offered through Thompson Capital Management, LLC, a Registered Investment Advisor. Additional
information about Thompson Capital Management, LLC is also available on the is also available on the SEC website at
www.adviserinfo.sec.gov. Please note that registration as an Investment Advisor or Investment Advisor Representative does not
imply any level of skill or training.

                                                                                                                                                          2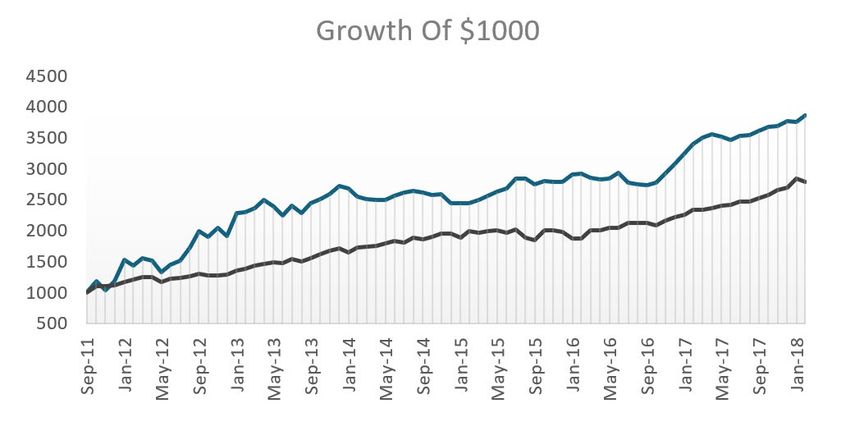
Risk-responsive investing for better portfolios
Thompson Capital in Focus

    Specialist Asset    Born from advisors’ need for strategies that help investors stay
  Management Firm       invested, regardless of market conditions

  View Investments
                        Utilizing proprietary Volatility Dashboard and Vol Loops thesis
  Through the Lens
                        to define market environments
        of Volatility

   Practice Dynamic     Seeking high correlation to equities during rising markets,
  Risk Management       low to negative correlation in bear markets

       Preserve the
                        Advisors use TCM strategies to construct more durable and efficient
          Power of      portfolios to help clients stay the course to achieve their goals
      Compounding

                                                                                                                                        3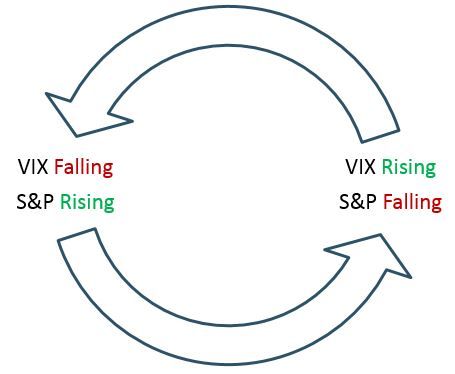
Risk-responsive investing for better portfolios
                     Portfolio Management Team
                    D. Matthew Thompson, CFA                                                            Michael A. Thompson, CFA
                    Principal                                                                           Principal
                    BS in Economics                                                                      BS in Economics
                    University of Illinois at                                                            University of Illinois at
                    Urbana/Champaign                                                                     Urbana/Champaign
As Director of Research, Matt oversees TCM’s Volatility Dashboard and acts as co-      Leading the investment function and overseeing all strategies as CIO and
portfolio manager on TCM’s strategies. Matt has over 20 years of capital markets       portfolio manager, Mike has over 23 years of experience constructing and
and investing experience, focusing on futures trading with an emphasis on VIX-
                                                                                       managing portfolios with a focus on volatility and risk management strategies.
related exchange-traded products. Matt’s perspective and insights on risk, the VIX
                                                                                       Early in his career, his work included portfolio management roles at The
and the broader volatility ecosystem are sought after by peers and members of the
financial press alike, with frequent contributions to articles in Barron’s, the Wall   Northern Trust, William Blair and Premier Asset Management LLC, a $500M
Street Journal and Reuters. After his foundational experience at Northern Trust,       investment advisor spun out of Northern Trust. Mike later provided derivatives
Matt served in an analyst role at Envestnet before joining forces with his brother     modeling expertise to a start-up derivatives exchange in Chicago before being
Mike as the head of operations at Premier Asset Management LLC, a $500M RIA in         recruited by a family office where he co-developed a VIX trading strategy that
Chicago IL. Subsequently, Matt served in business development and financial            began trading on a proprietary basis using VIX ETPs in October 2011. In 2013,
modeling roles for a Chicago-based start-up derivatives exchange before being          Mike began trading the strategy directly in the futures market for the
recruited to a family office in 2008 where he co-developed TCM’s Volatility            proprietary trading desk of ED&F Man Ltd and as a Commodity Trading Advisor,
Dashboard during the Financial Crisis. In 2013, Matt began trading the strategy
                                                                                       first as a principal of Advocate Asset Management LLC and subsequently for
directly in the futures market for the proprietary trading desk of ED&F Man Ltd and
                                                                                       Typhon Capital Management LLC. Mike finally reconnected with his RIA roots in
as a Commodity Trading Advisor, first as a principal of Advocate Asset
Management LLC and subsequently for Typhon Capital Management LLC. In 2015,            2015 in his role as Chief Investment Officer at Kaizen Advisory LLC, where he
Matt reconnected with his RIA roots in his role as Chief Investment Officer at         helped to launch the securities products currently managed by TCM. Mike is a
Kaizen Advisory LLC, where he helped to launch the securities products currently       member of the CFA Society of Chicago.
managed by TCM. Matt is a member of the CFA Society of Chicago.

                                                                                                                                                                                  4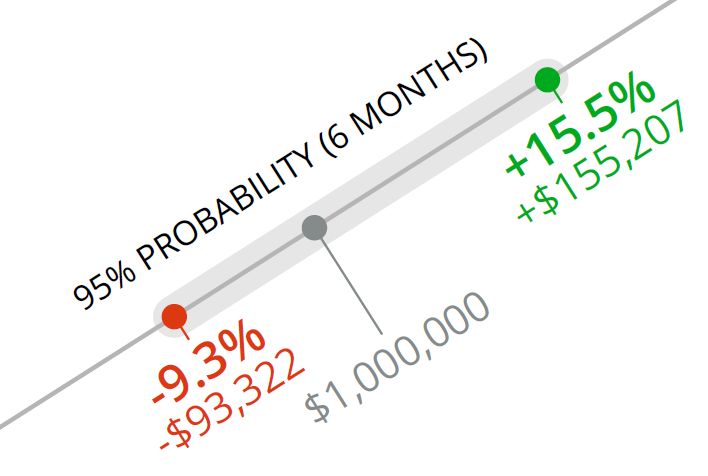
Risk-responsive investing for better portfolios
              Overview: Alpha Seeker Strategy

                                                          How does Alpha Seeker fit in a portfolio?
                  What is Alpha Seeker?
                                                            Compliments a range of portfolios- equities, traditional
                                                            balanced or multi-asset as a source of true diversification
                                           Model-driven
                                              trading
Absolute return        Invests in VIX-
                                           patterned on
  long/short               linked
                                             Volatility
   volatility        exchange-traded                      Why should I allocate to the strategy?
                                          Dashboard and
   approach           products (ETPs)
                                            Vol Loops
                                               thesis
                                                            •   Ability to profit from falling or rising volatility environments
                                                            •   Limited risk exposure: no leverage, no options
                                                            •   Low cost relative to other absolute return strategies
                                                            •   Uncorrelated returns can improve risk-adjusted returns of a
                                                                diversified portfolio

                                                                                                                                            5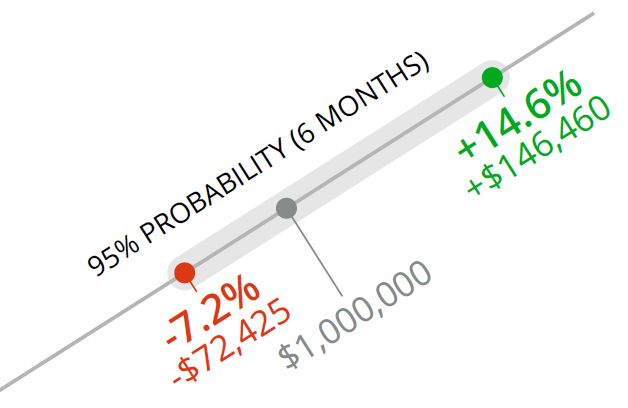
Risk-responsive investing for better portfolios
                              Uncorrelated return from the VIX
     Using a proprietary process based on our Volatility Dashboard, the Alpha Seeker strategy uses VIX ETPs seeking to produce
     absolute returns in multiple market environments. The unique characteristics of the VIX market give the strategy a consistently
     repeating opportunity for returns that we call “loops”.

                                                                                                       Growth of $1000

                                                                                                                       Alpha Seeker
                                          Portfolio Value

                                                                                                                  S&P 500 Total Return
                                                                                                             Source: TCM, Bloomberg. Alpha Seeker net of 1% annual fee

The CBOE Volatility Index® (VIX®) is a key measure of market expectations of near-term volatility conveyed by S&P 500 stock index option prices and has been considered by many to be a premier barometer of investor sentiment
and market volatility. Kaizen trading inception date is 06/01/2016. Performance results prior to the Kaizen inception date includes accounts managed at another entity. The persons managing the account at Kaizen were primarily
responsible for achieving the performance results at the prior firm and the strategy is currently being managed in a similar manner. The S&P 500 Index is designed to be a leading indicator of U.S. equities and is meant to reflect
the risk/return characteristics of the large cap universe. It is not available for direct investment. Total Return includes the reinvestment of dividends and capital gains, if any.

                                                                                                                                                                                                                                        6
Risk-responsive investing for better portfolios
The VIX is a Closed Loop
Since it tracks expectations for 30-day variability in the S&P 500, the VIX Index is a closed loop - it simply oscillates over and
under its long-term average level of about 20. The pace and size of loops may vary, but this is all the VIX ever does.* If mapped
correctly, each loop can be a potential profit opportunity using VIX ETPs**.
Vol Loops are independent of:
High: 40+
• Level of S&P (bull/bear markets)
• Interest rates
• Earnings / economic conditions
The Vol Loop
Avg = 20
Low: 10 - 12
*Source: TCM, Bloomberg
** Exchange-Traded Products
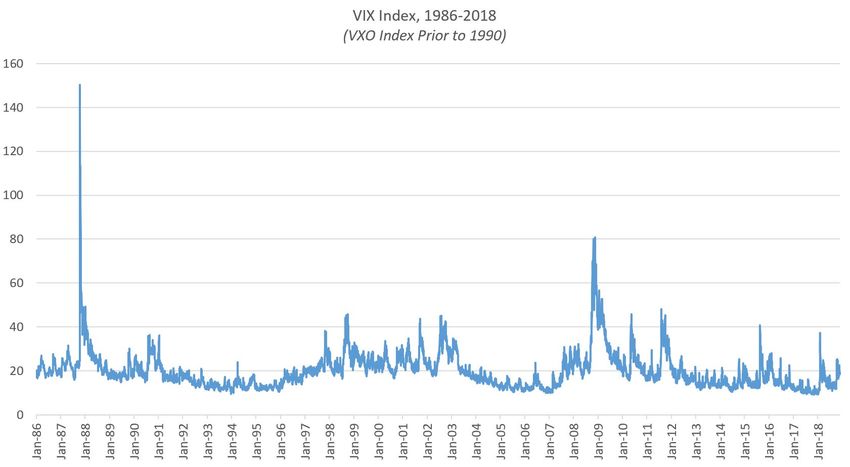
7Risk-responsive investing for better portfolios
Vol Loops: Long-Term
Large Vol Loops happen over the course of years.
VIX Level
Source: Bloomberg
Past performance is no guarantee of future results. This chart is for illustrative purposes only and does not represent actual or future performance of any investment option. Please note that indexes are
unmanaged and are not illustrative of any particular investment. It is not possible to invest directly in an index.
8Risk-responsive investing for better portfolios
Vol Loops: Short-Term
Smaller Vol Loops happen over the course of months.
VIX Level
Source: Bloomberg
Past performance is no guarantee of future results. This chart is for illustrative purposes only and does not represent actual or future performance of any investment option. Please note that indexes are
unmanaged and are not illustrative of any particular investment. It is not possible to invest directly in an index.
9Risk-responsive investing for better portfolios
Alpha Seeker Trades VIX Based on Loops
Alpha Seeker uses VIX and VIX-related ETPs to seek profit from Vol Loops.
ETPs That Benefit From Falling VIX ETPs That Benefit From Rising VIX
SVXY: ProShares Inverse VIX Short Term VXX: iPath S&P 500 VIX Short Term
ZIV: VelocityShares Inverse VIX Med Term TVIX: VelocityShares 2x VIX Short Term
UPRO: ProShares UltraPro S&P 500 UVXY: ProShares Ultra VIX Short Term
SPXL: Direxion Daily S&P 500 Bull 3X Shares SH: ProShares Short S&P 500
SDS: ProShares UltraShort S&P 500
Exchange Traded Funds involve risk including possible loss of principal. An investor should consider the Fund’s investment objective, risks, charges, and expenses carefully before
investing. This and other information is contained in each Fund’s prospectus. Please review the prospectus before investing.
10Risk-responsive investing for better portfolios
Investment Process: Mapping Vol Loops
Our VIX Dashboard helps us select the most appropriate position for the current VIX environment.
30%
SVXY 20%
20% VXX
SVXY
30%
VXX
For illustrative purposes only- actual positions will vary.
11Risk-responsive investing for better portfolios
“Red Portfolio”: Most Common
Most often, a rising stock market results in a falling or steady VIX, benefitting inverse VIX ETFs.
SVXY
(ProShares Inverse VIX) “Red Portfolio”
Attributes
• Semi-active trading (2-3 per week)
S&P 500
• Market-like volatility
• Positive correlation with S&P
VIX Index
The “Red Portfolio”
Source: TCM, Bloomberg
looks to profit from a
falling or stable VIX with
positions like SVXY
Exchange Traded Funds involve risk including possible loss of principal. An investor should consider the Fund’s investment objective, risks, charges, and expenses carefully before investing. This and other
information is contained in each Fund’s prospectus. Please review the prospectus before investing.
12Risk-responsive investing for better portfolios
“Green Portfolio”: Less Common
Occasionally, a falling S&P 500 pushes the VIX index higher, benefitting long VIX ETFs.
“Green Portfolio”
VIX Index Attributes
• Very active trading (10+ per week)
VXX
(iPath VIX Short Term) • High volatility
VXZ • Negative correlation with S&P
The “Green Portfolio” (iPath VIX Med Term)
looks to profit from
rising VIX with positions
S&P 500
like VXX or VXZ
Source: TCM, Bloomberg
Exchange Traded Funds involve risk including possible loss of principal. An investor should consider the Fund’s investment objective, risks, charges, and expenses carefully before investing. This and other
information is contained in each Fund’s prospectus. Please review the prospectus before investing.
13Risk-responsive investing for better portfolios
Main Risk: Transition Points
At the noisy transition points around the “loop”, Alpha Seeker returns typically become more volatile. At the same time, transitions
also create opportunity for the next profitable trade. This cycle is what produces the low correlation that makes Alpha Seeker an
attractive portfolio diversifier.
Vol Loop Transition Period Examples
Transition Points Transition Periods
Past performance is no guarantee of future results. Performance results prior to the Kaizen inception date includes accounts managed at another entity. The persons
managing the account at Kaizen were primarily responsible for achieving the performance results at the prior firm and the strategy is currently being managed in a
similar manner.
14Risk-responsive investing for better portfolios
What Can Alpha Seeker do for a Portfolio?
50% S&P 500 (SPY)
60% S&P 500 (SPY)
40% Aggregate Bonds (AGG)
40% Aggregate Bonds (AGG)
10% Alpha Seeker
Return
Risk
IMPORTANT: The projections or other information generated by Riskalyze regarding the likelihood of various investment outcomes are hypothetical in nature, do not reflect actual investment
results and are not guarantees of future results
15Risk-responsive investing for better portfolios
Notes and Glossary
Note on Leveraged and Inverse ETFs - The shares of an ETF commonly represent an interest in a portfolio of securities that track an underlying
benchmark or index. A leveraged ETF generally seeks to deliver multiples of the daily performance of the index or benchmark that it tracks. An
inverse ETF generally seeks to deliver the opposite of the daily performance of the index or benchmark that it tracks. Inverse ETFs often are
marketed as a way for investors to profit from, or at least hedge their exposure to, downward-moving markets. Some ETFs are both inverse and
leveraged, meaning that they seek a return that is a multiple of the inverse performance of the underlying index. To accomplish their objectives,
leveraged and inverse ETFs use a range of investment strategies, including swaps, futures contracts and other derivative instruments. Leveraged
and inverse ETFs reset each day and their performance can quickly diverge from the performance of the underlying index or benchmark. In other
words, it is possible that you could suffer significant losses even if the long-term performance of the index showed a gain.
Standard Deviation is a statistical measure of the historical volatility of a portfolio, usually computed using 36 monthly returns.
Sharpe Ratio is calculated by subtracting the risk-free rate from the rate of return for a portfolio and dividing the result by the standard deviation
of the portfolio returns. The greater a portfolio’s Sharpe ratio, the better its risk-adjusted performance has been.
16You can also read