A PORTFOLIO GROWTH STORY - 2018 New Hire Orientation

Page created by Paula Fields
 
CONTINUE READING
A PORTFOLIO GROWTH STORY - 2018 New Hire Orientation
August 2018

    New Hire Orientation
 A PORTFOLIO
           2018GROWTH STORY
            Maximizing Shareholder Value Through Strong Core Businesses
                         + Incremental Capital Deployment

All figures are on a before charges/gains basis for continuing operations unless otherwise indicated. Refer to Investor Center section of FBHS.com website
                                                           for reconciliations of non-GAAP figures.
A PORTFOLIO GROWTH STORY - 2018 New Hire Orientation
DISCLAIMER

This presentation contains certain “forward-looking statements” regarding business strategies, market potential,
future financial performance and other matters, including all statements with respect to “Continued
Performance,“ “Expected Growth,” “Outlook,” “Future”, “Potential” and "guidance" and statements with words
such as "will," “capability,” "should," "could," "expects," "potential,“ “estimates” or "projected" or the letter “E”.
Where, in any forward-looking statement, we express an expectation or belief as to future results or events,
such expectation or belief is based on the current plans and expectations at the time of this presentation.
Although we believe that these statements are based on reasonable assumptions, they are subject to
numerous factors, risks and uncertainties that could cause actual outcomes and results to be materially
different from those indicated in such statements, including the risks described in our Annual Report on Form
10-K as filed with the Securities and Exchange Commission. Except as required by law, we undertake no
obligation to update or revise any forward-looking statements to reflect changed assumptions, the occurrence
of anticipated or unanticipated events, new information or changes to future results over time or otherwise.

This presentation includes financial measures, including Net Debt to EBITDA, operating income before
charges/gains, operating margin before charges/gains, and diluted EPS before charges/gains, that are derived
on the basis of methodologies other than in accordance with U.S. generally accepted accounting principles
(GAAP). We offer these measures to assist investors in assessing our financial performance and liquidity under
GAAP, but investors should not rely on these measures as a substitute for any GAAP measure, including net
income or operating income. In addition, these measures may be inconsistent with similarly titled measures
presented by other companies. All financial information presented herein is unaudited. For more information,
including reconciliations of these non-GAAP financial measures to the most comparable GAAP measures,
please visit the “Investor Center” section of the Company’s website at www.FBHS.com.

                                                                                                                         2
A PORTFOLIO GROWTH STORY - 2018 New Hire Orientation
OUR PORTFOLIO
    PLUMBING          CABINETS            DOORS                                 SECURITY

FY17 Sales:   $1.7B    $2.5B                   $0.5B                                  $0.6B
FY17 OI*:     $366M    $272M                   $75M                                   $89M

                                 *Represents
                                           operating income before charges/gains and reflects adoption of   3
                                 ASU 2017-07 accounting change during first quarter of 2018.
A PORTFOLIO GROWTH STORY - 2018 New Hire Orientation
ATTRACTIVE CATEGORIES & PARTS OF MARKET
1
      Consumer Involved Categories
    • Products consumers can see and touch result in higher
      levels of excitement & engagement
    • Get paid for faster pace of innovation
    • Strong brands + leveraging of consumer insights and
      marketing creates higher sales and margin potential

2
           Robust Housing Markets
    • Strong share positions in the most
      attractive housing markets in the
      world: United States, Canada and
      China                                                   Canada

                                                China           USA

                                                                       4
A PORTFOLIO GROWTH STORY - 2018 New Hire Orientation
PORTFOLIO GROWTH: The Early Years (2012 – 2016)
  • In first 5 years post-spin, sales and profit grew significantly within each segment
  • As volumes grew, cabinets was the major engine of overall company growth
                                                                                   % of Total FBHS
                                  Operating Income(1) ($M)
            Net Sales ($B)            & Margin(1) (%)                       2012-2016                      2012-2016
                                                                           Sales Growth                    Op. Income
                                                 10.8%
                                                                                                            Growth(1)

                       $2.4                      $260
Cabinets    $1.3                      3.0%

            2012       2016
                                       $40
                                                                               58%                           49%
                                      2012       2016
                                                 20.9%

                                      15.4%
                       $1.5                      $321
Plumbing    $1.1                      $169                                     23%                           34%
            2012       2016           2012       2016
                                                 13.2%

   Doors    $0.3
                       $0.5           1.9%        $62                           8%                           12%
                                       $6
            2012       2016           2012       2016
                                                 13.7%
                                      14.1%

 Security   $0.4
                       $0.6
                                       $55
                                                  $80                          11%                             5%
            2012       2016           2012       2016                 1)   Represents Operating Income & Margin before
                                                                           charges/gains and reflects adoption of ASU 2017-07     5
                                                                           Accounting Change during first quarter of 2018. Growth
                                                                           rates exclude Corporate G&A expense.
A PORTFOLIO GROWTH STORY - 2018 New Hire Orientation
PORTFOLIO GROWTH: The Next Chapter (2017 – 2021E)
• We expect to drive similar or higher levels of overall sales and profit growth in next 5 yr. period
• Now, Plumbing will be the engine for growth as we accelerate our highest margin business
                                                                           Expected % of Total FBHS
                                       Operating Income(1,2) ($M)
            Net Sales(2) ($B)              & Margin(1,2) (%)
                                                                            2017-2021E                   2017-2021E Op.
                                                       ~14%                Sales Growth(2)             Income Growth(1,2)
                                           11.0%

Cabinets      $2.5        ~$3B                        ~$400+
                                           $272

             2017A    2021 Potential       2017A   2021 Potential
                                                                            ~25%                            ~25%
                                                       ~21%
                                           21.3%
Plumbing      $1.7
                         ~$3B+
                                           $366
                                                      ~$650+
                                                                            ~60%                            ~60%
             2017A    2021 Potential       2017A   2021 Potential

                                                       ~17%
                                           14.8%
   Doors      $0.5
                         ~$0.7B
                                            $75
                                                      ~$125+                ~10%                            ~10%
             2017A    2021 Potential       2017A   2021 Potential

                                                       ~18%

                         ~$0.7B
                                           14.9%
                                                      ~$130+
                                                                             ~5%                              ~5%
 Security     $0.6                          $89
                                                                      1)    2017 Operating Income & Margin before charges/gains
             2017A    2021 Potential       2017A   2021 Potential           revised to reflect adoption of ASU 2017-07 Accounting   6
                                                                            Change during first quarter of 2018.
                                                                      2)    Includes growth from potential acquisitions.
A PORTFOLIO GROWTH STORY - 2018 New Hire Orientation
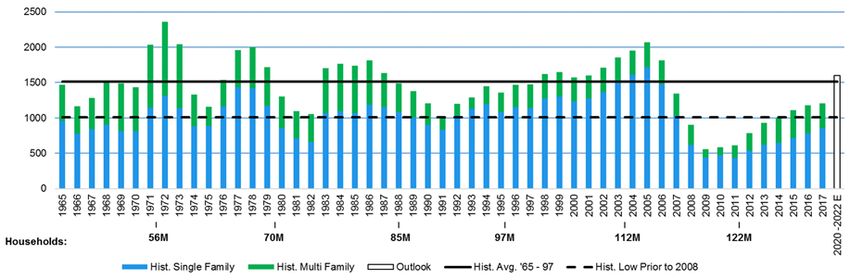
PORTFOLIO EPS POTENTIAL: Led by Plumbing &
 Value-Creating Capital Deployment

 Earnings Per Share1
                                                                    • Stable core businesses;
                                                                     housing continues elongated
                                                                     recovery
                                                                    • Plumbing sales acceleration
                                      • Strong sales & margin
                                        growth across segments      • ~$4B Capital Deployment
                                      • Led by Cabinets
                                      • $3.5B+ Capital Deployment

                                                                          $~6.00
                                                     $3.08

                            $0.57

                            2011                     2017                   2021E
1Before   Charges/Gains on a Continuing Operations Basis.
                                                                                                    7
A PORTFOLIO GROWTH STORY - 2018 New Hire Orientation
INCREMENTAL GROWTH: Significant EPS Tailwind
Based on solid growth in our core businesses, strong market share positions and continued
housing market recovery, we believe we have potential to deploy additional ~$4B over the next
4 years on acquisitions, share repurchases and dividends with reasonable leverage
($ in millions)

              CAPITAL DEPLOYMENT                                                             DEPLOYMENT POTENTIAL
                2012 – 2018 YTD(1)                                                          REMAINDER OF 2018 – 2021(2)
                            Cash Deployed                                               Cash Available to Drive Incremental Value
   Source:                                                                               Source:
        Cash                                                               2,055           Cash                                   2,700
        Added Debt                                                         1,733           Debt                           1,300 – 2,200
        Total                                                              3,788           Total                           4,000 - 4,900
                         Capital Allocation                                                        Potential Capital Allocation
   Acquisitions                                                            1,510         Acquisitions & Share
                                                                                                                         ~3,500 – 4,400
                                                                                         Repurchases
   Share Repurchases                                                       1,794
   Dividend                                                                   484
                                                                                         Dividend                                  ~500
   Total                                                                   3,788
                                                                                         Total                             4,000 - 4,900

   Net Debt to EBITDA1                                                       2.1x        Net Debt to EBITDA                 2.0x to 2.5x
 1)   Before Charges/Gains on a Continuing Operations Basis. Data period 12/31/11
      through 6/30/18.                                                                                                                     8
 2)   Assumes housing market recovers to 1.5 million new construction starts in 2021.
HOUSING: A FAVORABLE MARKET
         BACKDROP
A STRONG FOUNDATION: U.S. Housing Market
We expect an elongated recovery in the housing market to an estimated steady state
of ∼1.5M new construction starts by 2020-21 based on supply meeting demand trends

                          DEMAND                                 SUPPLY

         Favorable Demographics for Home Ownership         Labor & Land Constraints
          Baby Boomers – Retaining, increasing             Governing pace
          Millennials – 5 year delays in marriage/child      but gradually improving
            placing upward pressure on future formations                                10
A STRONG FOUNDATION: Repair & Remodel (R&R)
We expect R&R to stabilize at about 5% in all of our categories

                  ANNUAL R&R GROWTH TO STEADY STATE SCENARIO

                     5%                                                            ~5%+
                                                5%            5%         5%
        4.5%
                                 4%

        2012        2013         2014          2015          2016       2017       2020-
                                                                                  2022 E

Pent-up demand                          Consumers more              Well-positioned to
build in 2007-11:                       willing to invest           capture growth
growth was below                        in their homes               Two thirds of our home
historical averages                      Employment                  segments’ sales are
 Early in the recovery big-             Home prices                 driven by R&R
   ticket projects lagged even           Access to credit           Growth of GPG and
   further                                                            large embedded base of
                                                                      Moen products
 Increased median age of
   homes has increased; now                                          Leading share of the
   around 50 years                                                    cabinet dealer channel
                                                                                               11
GROWTH ACROSS OUR CORE
 PORTFOLIO OF COMPANIES
GLOBAL PLUMBING GROUP
    The Highlights:                                             2017 Sales Mix:                                     Leading Brands:
•    Potential to accelerate sales
     growth to ~$3.0B by 2021
•    Maintain already-high (~21%)                                   26%
     portfolio operating margin(1)
                                                                                          45%
•    Stronger management team
                                                                                                    Wholesale
     with broader market experience
                                                                                                    Retail
•    Enhanced capabilities                                            29%                           International

     Performance: Past & Future Potential

                    Net Sales ($B)                                       Operating Income(1) ($M)               Operating Margin(1) (%)

                                              ~$3.0+                                            ~$650+                    21%     ~21%
                               $1.7                                                     $366                        15%
               $1.1                                                        $169
              2012A           2017A           2021E                      2012A          2017A   2021E           2012A     2017A   2021E

    1)   2012 and 2017 Operating Income & Margin before charges/gains, and revised to                                                     13
         reflect impact of ASU 2017-07 Accounting Change during first quarter of 2018
GLOBAL PLUMBING GROUP
Competitive Advantages that Drive Value

             Leading
                             Enhanced                             Leverage
             Brands                              Leverage
                             Innovation                           Our Scale
                                                 Consumer
  Dedicated                                      Insights
  Sales Channels
                Platform to Acquire
                Adjacent Brands &
                Categories                                         Flexible Global
                                   Enter New      Own Critical
     Sell More                                                     Supply Chains
                                   Geographies    Parts of
     Through Current                                               (U.S., Mexico,
     Customers                                    Manufacturing    China, & S.E. Asia)
                                                  Process
                   Digital Marketing &
                   Analytics

        How we grow sales and                      …and create pricing
          margin over time…                       power to offset inflation              14
PLUMBING EVOLUTION DRIVING FASTER GROWTH
                             Strong Brand
 Who We Were - 2015          High Margins
                             Exclusive Builder Contracts
                             Large Installed Base
                             Global Supply Chain

 Who We Are Today
                      Grow Multiple Brands Simultaneously

                      Added Products, Price Points, & Geographies

                      Leverage Supply Chain & Distribution Over
                      Expanded Product and Brand Set

                      Supports New Acquisitions & JVs

                      New Go-to-Market Concept: House of ROHL

                      New Capabilities: E-Commerce, Marketing &
                      Data Analytics
                                                                    15
CABINETS
    The Highlights:                             2017 Sales Mix:                                Leading Brands:
•    Multi-brand strategy across price                                 Dealer
     points, styles and channels with                                  Retail: In-Stock
                                                       7%
     flexibility to pivot in alignment            8%                   Retail: Special Order
     with market demands                                               Builder
•    Sales growth in the most                   14%                    Canada
                                                              49%
     attractive areas of the market
     today: value and in-stock
                                                  22%
•    Dealer channel leader

     Performance: Past & Future Potential

                   Net Sales ($B)                     Operating Income(1) ($M)            Operating Margin(1) (%)

                                 $2.5   ~$3.0                          ~$400+                               ~14%
                                                               $272                                 11%
               $1.3
                                                       $40                                 3%
              2012A          2017A      2021E         2012A    2017A    2021E             2012A     2017A   2021E

    1)   Before Charges/Gains.                                                                                      16
CABINETS
Competitive Advantages that Drive Value

                         Multi-brand
                         strategy           Regional supply
                                            chain for semi-
                                                                Flexibility to shift
   5000+ dealers                            custom products
                                                                focus when
                                                                consumer and market
                     Positioned across                          dynamics change
                     price, products,
                     channels and               Dedicated in-
        Consumer     categories to manage       stock vanity
        innovation   growth in most
                                                supply chain
                     attractive areas

       How we grow sales and                    …and create pricing
         margin over time…                     power to offset inflation               17
CABINETS PIVOT: To Consumer Demand & Our Strengths
• Consumer & Builder demand strong for Value Cabinetry and In-Stock Cabinets & Vanities
• Rationalizing select capacity, expanding capacity and product range in best-selling segments

                                                                         Target Operating Margin: + another ~300 bps
                                                                         as we pivot toward lower volatility/scale
             Operating Margin +300 bps       Operating Margin +300 bps   parts of business with predictable volumes

           17%
                                                                                   Cabinet Product Mix
           33%          Grew                         Investing                                In-Stock
                                                                                              Value
                                                                                              Mid-Tier
           40%        Pared Back                                                              Premium
                                                  Rationalizing

           10%        Maintained                   Maintaining

          2014A                          2017A                      2021E

                                                                                   Cabinet Channel Mix
           37%
                        Growth                                                                Dealer
                                                     Growth
                        Focus                        Focus                                    HC In-Stock
           17%
                                                                                              Builder Direct
           15%
                                                                                              HC Special Order
                                                  Selective
           23%          Margin                    Partnerships                                Canada
                        Focus                     & Segments
           8%
                                                                                                                   18
          2014A                          2017A                      2021E
DOORS
    The Highlights:                                               2017 Sales Mix:                       Leading Brands:
•    Above market sales growth in
     fiberglass entry doors                                               3%
•    Continued operating margin                                    23%
     expansion
•    Enhanced R&D and innovation
     capabilities and cadence                                                              Wholesale
•    Trailing 12 month sales and margin                                        74%         Retail
     growth well above peers                                                               Other

     Performance: Past & Future Potential
                    Net Sales ($B)                                   Operating Income(1) ($M)          Operating Margin(1) (%)

                                              ~$0.7                                    ~$125+                    15%     ~17%
                               $0.5                                             $75
               $0.3
                                                                         $6                             2%
              2012A           2017A           2021E                                                    2012A    2017A    2021E
                                                                      2012A    2017A   2021E

    1)   Before Charges/Gains on a Continuing Operations Basis.                                                                  19
DOORS
Competitive Advantages that Drive Value

     Leading Fiberglass Door Brand in
     Fastest Growing Segment of the                        Full System
                                          Large-scale      with Wide
     Market                               Manufacturing    Range of
                                                           Choices

                         Increased Pace
        Best Fabrication                    Engineered
                         of innovation                    Owned,
        Network in                          Material
                                                          Dedicated
        N. America                          Capability
                                                          Supply Chain

       How we grow sales and                …and create pricing
         margin over time…                 power to offset inflation     20
SECURITY
    The Highlights:                                               2017 Sales Mix:                                      Leading Brands:
•    Sales growth above GDP driven
     by innovation, pricing and
     international expansion                                           25%
•    Continued operating margin
     expansion                                                                               48%
•    Lower cost global supply chain                                                                    Retail
                                                                                                       International
                                                                       27%
                                                                                                       Commercial

     Performance: Past & Future Potential

                    Net Sales ($B)                                          Operating Income(1) ($M)               Operating Margin(1) (%)

                                $0.6            ~$0.7                                              ~$130+                    15%     ~18%
                                                                                            $89                        14%
               $0.4                                                           $54

              2012A            2017A           2021E                        2012A          2017A   2021E           2012A     2017A   2021E

    1)   2012 and 2017 Operating Income & Margin before charges/gains, and revised to                                                        21
         reflect adoption of ASU 2017-07 Accounting Change during first quarter of 2018.
SECURITY
Competitive Advantages that Drive Value

      Leading Brands
                                          Strong Share Position
                                          Across Channels &
                         Stable Growth    Customers             Strategic Sourced
                         Based on GDP                           Components

        Increased Pace
                                                 Flexible, Global
        of innovation
                                                 Supply Chain

       How we grow sales and                   …and create pricing
         margin over time…                    power to offset inflation             22
MANAGING THE PORTFOLIO FOR
     VALUE CREATION
A STRONG FOUNDATION: Our Business Model
 We have a strong foundation that enables us to deliver profitable growth including
 experienced leaders, channel leadership, operational excellence, innovation and leading
 brands.

 Performance-Driven                   Differentiated                 Consumer
       Culture                     Approach & Attributes              Focused

 Drive: People who want to          Competitive               Attractive Categories
  win and deliver results in our      Advantages: Unique         & Brands: Consumer-
  performance-driven, team-           aspect of each             involved purchases in
  based culture                       company; drives            markets with long-term
 Operational Excellence:             growth, share gains &      growth
  Accountability, transparency        margin                    Innovation: Fresh, on-
  and autonomy in a                  Strong Capital             trend product lines;
  decentralized structure             Structure: Low debt        excites consumers
 Team & Talent from diverse          leverage & strong cash
  backgrounds, experiences            flow to support growth
  and industries
                                                                                           24
CONSISTENT PORTFOLIO GROWTH
Since October of 2011, we have consistently grown sales, margins and EPS through
active management of our business segments, as well as aggressive management of
capital and resources against our best internal and external opportunities.

                          Total Net Sales                                                                   Operating Margin
                               (in billions)                                                                        (OM %)

                                               $5.0    $5.3    ~$5.6                                                  12.9% 13.6% ~13.9%
             $3.7       $4.0      $4.6                                                           9.0%     10.1% 11.4%
   $3.1                                                                                6.7%

   2012      2013      2014      2015          2016    2017 2018E                      2012      2013      2014      2015      2016       2017     2018E

                                                                Earnings Per Share
                                                                         ($/share)

                                                                                                        ~$3.67
                                                                                     $2.75 $3.08
                                                                   $2.07
                                                       $1.37 $1.74
                                               $0.83
                                               2012    2013     2014      2015       2016      2017 2018E

  All chart data is before charges/gains on a continuing operations basis. Operating margin reflects impact of ASU 2017-07 accounting change during first
  quarter of 2018. 2018 estimates represent guidance, and midpoint of company guidance for Net Sales and EPS as of 7/26/18. Operating Margin
  estimate represents 25 to 50 basis points increase vs. FY 2017 result of 13.6%. The company undertakes no duty to update this information.                25
You can also read