RESEARCH - MARKET OVERVIEW MARCH 2020 OUTLOOK FOR MORE DEVELOPMENT COMPLETIONS IN 2020
←
→
Page content transcription
If your browser does not render page correctly, please read the page content below

RESEARCH

MARKET OVERVIEW MARCH 2020
OUTLOOK FOR MORE DEVELOPMENT
COMPLETIONS IN 2020
Population Growth
             AUS: 1.5%       VIC: 2.1%
             YoYΔ: Jun‘19
                                         Victoria the engine behind                               in 2019 CY. With online penetration in the
             Economic Growth             the nation’s economy                                     UK currently sitting at 19%, it would
                                                                                                  seem inevitable that online shopping in
             AUS: 1.9%       VIC: 3.0%   Despite a broader slowdown in growth                     Australia will continue to grow in the
             YoYΔ: Jun ‘19               and uncertainty over the economic                        coming years.
                                         outlook, Victoria is still driving the
                                         national economy. According to the latest                Improvements in return policies, faster
             Unemployment Rate
                                         Australian Bureau of Statistics data,                    delivery times, the rise of online
             AUS: 5.2%       VIC:5.5%    Victoria is the nation’s top performing                  marketplaces, the rise of shopping by
             As at: Jan’20
                                         economy, recording the highest annual                    phone, a broader range of delivery
                                         growth rate of any state.                                options, and improved tracking systems
                                                                                                  are all factors felt to be behind the rise of
             Online Retail Trade         Over the 2018-2019 FY the state’s                        E-Commerce.
                                         economy grew by 3.0%, against the
             AUS:+19.2% (at $2,306.0m)   national rate of 1.9%. Health Care and                   The rapid proliferation of online retail has
                                         Social Assistance (11.3%), Construction                  boosted demand for industrial property.
             YoYΔ: Dec‘19
                                         (4.7%) and Financial and Insurance                       Much of Melbourne’s new industrial
                                         Services (3.3%) contributed to over half                 development and tenant demand is
             Investment in               of economic growth in Victoria.                          stemming from the E-Commerce sector,
             Infrastructure                                                                       and prime take up in CY 2019 (570,740
                                         Growth in online retailing                               sq m) was up on what was recorded in
             VIC: $14.2bn
                                         drives industrial sector                                 CY 2018 (391,286 sq m).
             FY ’19-20
                                         Online retail penetration continues to
                                                                                                  With industrial property in strong
                                         increase in Australia, and this is having a
                                                                                                  demand, major institutional players such
                                         profound effect on the industrial sector.
                                                                                                  as GPT have responded by shifting the
                                                                                                  balance of their portfolios away from
                                         According to the ABS, online retail
                                                                                                  underperforming bricks and mortar retail
                                         turnover as a proportion of all retail
                                                                                                  to logistics real estate.
                                         turnover has risen markedly in recent
                                         years, more than doubling from 3.0% in
                                         Dec 2015 to 6.6% in Dec 2019. And
                                         online retail turnover increased by 19.2%

                                         Online Retail Turnover
                                         Total online retail trade ($bn) and online trade (%) as a percentage of total retail trade

    Associate Director

2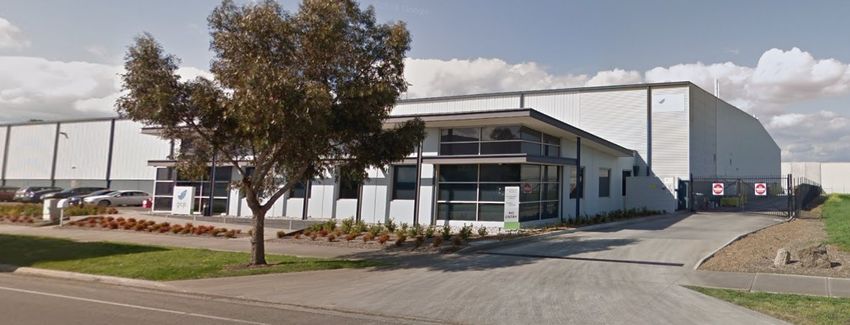
MELBOURNE INDUSTRIAL MARCH 2020                                     RESEARCH

                                                                                                         Rents, Incentives & Outlook*

Low prime vacancy due to                     Market adjusts to rent rises                          (per sq m)            Prime           Secondary
increase in prime take up                                                                             Rents              $88                 $71
                                             A substantial increase in land values over
                                                                                                   YoY Δ Jan’20:         +4.1%               +5.2%
Melbourne’s industrial vacant space          the last CY resulted in an increase in
(5,000 sq m+) sits at 746,173 sq m.          rents. Across the Melbourne industrial                Incentives                16.0%         14.6%
Vacancy increased by 15.2% over CY           market, rents increased by 7.3% for
                                                                                                     Rents
2019 off the back of a 28.1% increase in     prime assets over CY 2019. However,
                                                                                                    Outlook
existing secondary stock levels, with this   rental growth has stalled across the
                                                                                                * excl. City Fringe
increase driven by the South East where      board since mid-2019. This is due to the
secondary vacancy has increased by           market coming to terms with the recent             for industrial property has risen and road
102.1% since January 2019.                   rise in rents (prime rents have risen              and rail infrastructure is being improved.
                                             13.1% over the last 2 years).                      A record $50 billion is currently being
While vacancy overall has risen, the                                                            spent on key infrastructure projects in
amount of prime grade vacant space has       Moving forwards, rents are expected to             Victoria with many of these in
largely remained stable, increasing from     increase in response to the recent rise in         Melbourne’s West (Western Roads
365,442 sq m at the end of 2018 CY to        land values. Rents should also increase in         Upgrade, West Gate Tunnel, Level
384,412 sq m at the end of 2019 CY.          areas such as the West where demand                Crossing Removal).

Melbourne Industrial Vacancy                 Melbourne Industrial New Supply                    Melbourne Industrial Rents
Available Space by Grade (‘000 sq m)         New Developments by Precincts (‘000 sq m)          Net Face Rents by Grade excl. Fringe ($/ sq m)

And prime vacancy levels over the last 2
years (average 371,134 sq m) are notably
lower than what was recorded between         Recent Leasing Activity Melbourne
2014 to 2017 (average 478,000 sq m).
                                                                                     Net Rent        Area
                                             Address                     Region                                       Type             Tenant
                                                                                     ($/sq m)       (sq m)
In the East there has been no prime
vacant space for over 12 months, and the     445-469 Grieve Pde,
North is recording prime vacancy levels                                   West           75        18,815         Existing           Dutton Cars
                                             Altona North
not seen since 2013.                         56 Toll Dr,
                                                                          West           80        17,907         Existing           Asaleo Care
                                             Altona
As signposted earlier, the relatively low
                                             Spec 3C & 3D, Beyer
prime vacancy is attributable to a notable                             South East        90*       14,552             Spec             Puma
                                             Rd, Braeside
increase in prime take up. The majority
                                             1/16 Vulcan Dr,
(71%) of this prime take up came from                                     West           75         8,383             Spec       E-store Logistics
                                             Truganina
the West where 409,379 sq m was taken
up.                                          B-8, 481 Cooper St,
                                                                          North          U/D        7,597             Spec             Intralox
                                             Epping

                                                                                                                                                     3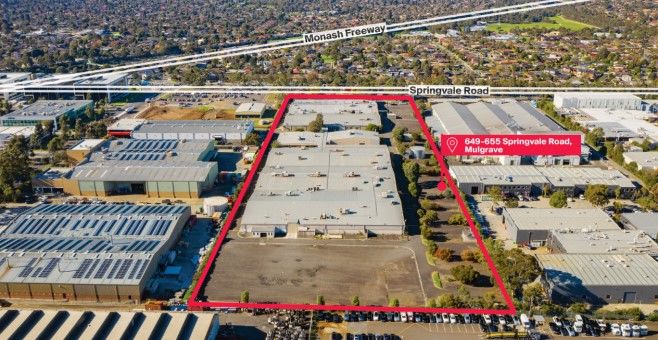
Completed 2019 5,000—10,000 sq m
Under construction 10,000—20,000 sq m
Proposed 2019 & 2020 20,000 sq m+
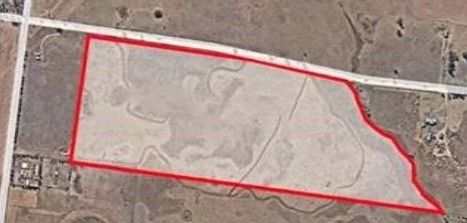
Land values rise pre-committed stock and speculative areas such as Derrimut and Truganina.
development. In Truganina, CEVA As evidence of this, ASX-listed
Industrial land values increased over Logistics have pre-committed to 37,307 developer Stockland in conjunction with
the last year, driven by increases in sq m due to land in Q4 this year, and a Mount Atkinson Holdings will develop a
prices recorded in the South East and 15,100 sq m Mapletree spec 260 hectare, $2 billion business park in
West. Most notably, over the last CY development is due to reach Mount Atkinson in Melbourne’s West.
the value of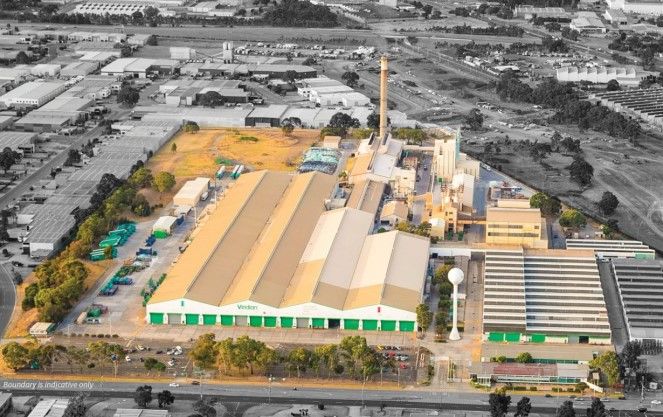
MELBOURNE INDUSTRIAL MARCH 2020                                         RESEARCH

                                                  years breaking the $2 billion mark for the
       Current Yields & Outlook
                                                  first time.                                    Melbourne Industrial Yields
  (in %)         Prime        Secondary                                                          Yields by Grade plus Risk Spread
                                                  Capital raising comes easy
  Yields       5.55 - 6.25    6.25 - 7.15
YoYΔ Jan’20:     -50bps          -50bps           Major institutional funds are benefitting
                                                  from the surge in demand for industrial
 Outlook                                          property, with many being over-
                                                  subscribed by investors when they
Transaction volumes                               embark on capital raising to fund
remain at high level                              industrial property acquisitions. In
                                                  October 2019, the unlisted Charter Hall
Industrial sales volume ($10 million+)            Prime Industrial Fund’s $725M equity
totaled $2.11 billion across 76                   fundraising was heavily over-subscribed,
transactions over CY 2019. Transaction            such was the strength of demand for
volumes are in line with what was                 industrial property. And in May 2019
recorded in CY 2018 ($2.29 billion).              Investec Australia Property Fund (IAPF)
Since 2008 sales volumes have risen               closed its $102M capital raising offer
consistently, with sales over the last 2          earlier than planned, again due to strong
                                                  demand from investors.

                                                  Offshore investment on the
                                                                                                     Property Link (Hong Kong) and
Melbourne Industrial Sales ($10 mil+)             rise                                               Emergent Cold (USA) purchased two
Purchaser Profile—CY2019
                                                  2019 CY saw the return of offshore                 large national industrial portfolios.
                                                  investment within the Melbourne
                                                  industrial market. Offshore investors              Yields continue to
                                                  accounted for a third (33%) of all                 compress
                                                  Melbourne industrial sales volume
                                                                                                     2019 CY saw a relative lack of new
                                                  ($10M+) in 2019, which is double what
                                                                                                     supply hit the market and in
                                                  was recorded in 2018 (17%). In March,
                                                                                                     conjunction with strong demand this
                                                  Cache Logistics Trust (Singapore)
                                                                                                     resulted in yields continuing to
                                                  acquired 198 Maidstone Street, Altona in
                                                                                                     compress over the last CY. With E-
                                                  Melbourne’s West for $41.2M from
                                                                                                     commerce and in turn the logistics and
                                                  Abacus Property Group, and in
                                                                                                     warehousing sectors expected to
                                                  December The Straits Trading Company
                                                                                                     continue to grow, industrial property’s
                                                  Limited (Singapore) transacted on 677
                                                                                                     status as a capital growth asset is
                                                  Springvale Road, Mulgrave in
                                                                                                     assured and off the back of this yields
                                                  Melbourne’s East for $24M. More
                                                                                                     are expected to continue to compress.
                                                  broadly, two large offshore groups, ESR

Recent Sales Activity Melbourne
                                          Price   Bldg Area    Core Mkt     WALE                                                      Sale
Address                       Region                                                       Vendor                   Purchaser
                                          $ mil     (sq m)     Yield (%)    (yrs)                                                     Date
51-95 Green Rd,                South                                                   Crescent Capital
                                          100.0     77,124        5.75       8.0                                Charter Hall REIT     Q4-19
Dandenong South                 East                                                      Partners
                                                                                       Frasers Property            Growthpoint
3 Maker Pl, Truganina          West       40.0      31,092        5.78       3.0                                                      Q3-19
                                                                                           Australia                Properties
677 Springvale Rd,                                                                                              The Straits Trading
                               East       24.0      12,157        7.10       3.1               ESR                                    Q4-19
Mulgrave                                                                                                               Co.
11 & 17 Business Park Dr,
                               West       17.0      13,014        5.83       3.3          Pellicano                   Private         Q3-19
Ravenhall
7-29 Gladstone Rd,             South
                                          14.8      11,458       5.59*       6.5         Up Property              Ousson Group        Q3-19
Dandenong                       East

                                                                                                                                               5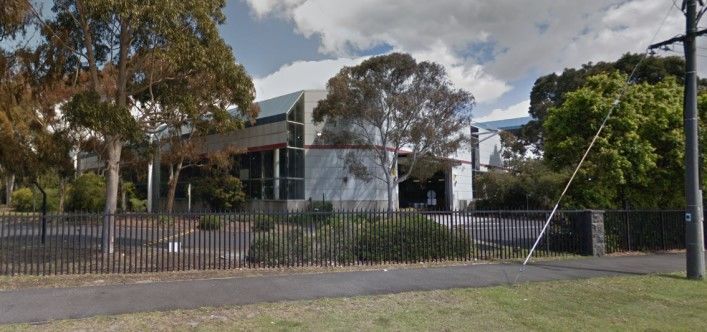
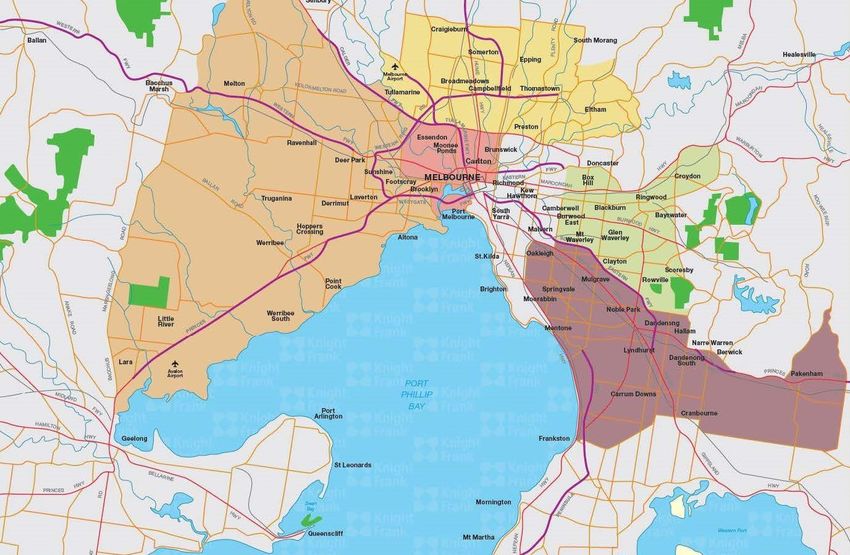
City Fringe                                    North                                    East
         Vacancy                                        Vacancy                                  Vacancy
    Prime:          7,000 sq m                  Prime:              83,029 sq m          Prime:              N/A*
    Secondary:      38,309 sq m                 Secondary:          76,316 sq m          Secondary:          109,143 sq m
         Land                                           Land                                     Land
MELBOURNE INDUSTRIAL MARCH 2020                     RESEARCH

South East                            West
     Vacancy                                   Vacancy
Prime:          107,583 sq m           Prime:              186,800 sq m
Secondary:      106,523 sq m           Secondary:          31,470 sq m
     Land                                      Land
RESEARCH
                                                                                                            Finn Trembath
                                                                                                            Associate Director, Victoria
                                                                                                            +61 3 9604 4608
                                                                                                            Finn.Trembath@au.knightfrank.com

                                                                                                            Kanwal Singh
                                                                                                            Research Analyst, Victoria
                                                                                                            +61 3 9604 4627
                                                                                                            Kanwal.singh@au.knightfrank.com
                                                                                                            Ben Burston
                                                                                                            Partner, Chief Economist
                                                                                                            +61 2 9036 6756
                                                                                                            Ben.Burston@au.knightfrank.com

                                                                                                            INDUSTRIAL
                                                                                                            Gab Pascuzzi
                                                                                                            Partner, Head of Division
                                                                                                            +61 3 9604 4649
                                                                                                            Gab.Pascuzzi@au.knightfrank.com

Definitions:                                                                                                Adrian Garvey
Core Market Yield: The percentage return/yield analysed when the assessed fully leased net market           Director
income is divided by the adopted value/price which has been adjusted to account for property                +61 3 8545 8616
specific issues (i.e. rental reversions, rental downtime for imminent expiries, capital expenditure,        Adrian.Garvey@au.knightfrank.com
current vacancies, incentives, etc).
Prime Grade: Asset with modern design, good condition & utility with an office component 10-30%.            Joel Davy
Located in an established industrial precinct with good access.                                             Partner, Industrial Logistics
Secondary Grade: Asset with an older design, in reasonable/poor condition, inferior to prime stock,         +61 3 9604 4674
with an office component between 10-20%.                                                                    Joel.Davy@au.knightfrank.com
WALE: Weighted Average Lease Expiry.
Methodology:
                                                                                                            Marco Sandrin
This analysis collects and tabulates data detailing vacancies, net face rents and yields (5,000 sq m+,
                                                                                                            Director
sales of $3mil+) within industrial properties across all of the Melbourne Industrial Property Market.
The buildings are categorised into 1) Existing Buildings – existing buildings for lease. 2) Speculative     +61 3 9604 4731
Buildings – buildings for lease which have been speculatively constructed and although have                 Marco.Sandrin@au.knightfrank.com
reached practical completion, still remain vacant. 3) Spec. Under Construction – buildings for lease
which are being speculatively constructed and will be available for occupation within 12 months.            Brent Glassford
                                                                                                            Director
                                                                                                            +61 3 9604 4683
                                                                                                            Brent.Glassford@au.knightfrank.com

                                                                                                            NATIONAL
Knight Frank Research provides strategic advice, consultancy services and forecasting                       James Templeton
                                                                                                            Partner, Managing Director
to a wide range of clients worldwide including developers, investors, funding
                                                                                                            +61 3 9604 4724
organisations, corporate institutions and the public sector. All our clients recognise the                  James.Templeton@au.knightfrank.com
need for expert independent advice customised to their specific needs.
                                                                                                            VALUATIONS & ADVISORY
                                                                                                            Michael Schuh
                                                                                                            Partner, Joint Managing Director
                                                                                                            +61 3 9604 4726
                                                                                                            Mschuh@vic.knightfrankval.com.au

                                                                                                            VICTORIA
                                                                                                            James Templeton
                                                                                                            Partner, Managing Director
                                                                                                            +61 3 9604 4724
                                                                                                            James.Templeton@au.knightfrank.com

Melbourne’s Fringe         Melbourne CBD               Brisbane CBD Office         North Shore Office
Office Market Report       Office Market               Market Overview Sep         Market Overview
Sep 2019                   Overview Sep 2019           2019                        Sep 2019

Knight Frank Research Reports are available at KnightFrank.com.au/Research

Important Notice
© Knight Frank Australia Pty Ltd 2020 – This report is published for general information only and not to
be relied upon in any way. Although high standards have been used in the preparation of the
information, analysis, views and projections presented in this report, no responsibility or liability
whatsoever can be accepted by Knight Frank Australia Pty Ltd for any loss or damage resultant from
any use of, reliance on or reference to the contents of this document. As a general report, this material
does not necessarily represent the view of Knight Frank Australia Pty Ltd in relation to particular
properties or projects. Reproduction of this report in whole or in part is not allowed without prior
written approval of Knight Frank Australia Pty Ltd to the form and content within which it appears.
You can also read