Investor Presentation
   November 2019
Symbol OTCQX: CXDO
←
→
Page content transcription
If your browser does not render page correctly, please read the page content below

Investor Presentation November 2019 Symbol OTCQX: CXDO

Safe Harbor

This presentation includes forward-looking statements within the meaning of the federal securities
laws. These statements relate to, among other things, our history, our business lines, business
strategy, goals , plans and expectations concerning our business, our market position and the growth
of our business, business lines and future business plans in which we compete and the benefits that
our customers will realize from our services. We use the words "anticipate", "believe", "could",
"estimate", "expect", "intend", "may", "plan", "predict", "project", "will" and similar terms and phrases to
identify forward-looking statements in this presentation.

Although we believe the assumptions upon which these forward-looking statements are based are
reasonable, any of these assumptions could prove to be inaccurate or plans could change based
upon circumstances and the forward-looking statements based on these assumptions could be
incorrect. Our operations involve risks and uncertainties, many of which are outside our control, and
any one of which, or a combination of which, could materially affect our results of operations and
whether the forward-looking statements ultimately prove to be correct. Actual results and trends in the
future may differ materially from those suggested or implied by the forward- looking statements
depending on a variety of factors including risks to the business. These risk factors are explained in
detail in the company’s filings with the Securities and Exchange Commission including the Form 10-K
for fiscal year ended December 31, 2018. In addition risk information is contained and supplemented
under the heading “Management’s Discussion and Analysis of Financial Condition and Results of
Operations” and elsewhere in our Annual Report on Form 10-K and Quarterly Reports on Form10-Q.
All future written and oral forward-looking statements attributable to us or persons acting on our behalf
are expressly qualified in their entirety by the previous statements. We undertake no obligation to
update any forward-looking statements that may be made to reflect events or circumstances that
occur, or that we become aware of, after the date of this presentation.

This presentation contains certain information that has not been derived in accordance with generally
accepted accounting principles (“GAAP"). Reconciliations of such information to the most directly
comparable information derived in accordance with GAAP are contained in this presentation. This
information should not be considered a substitute for any measures derived in accordance with GAAP.
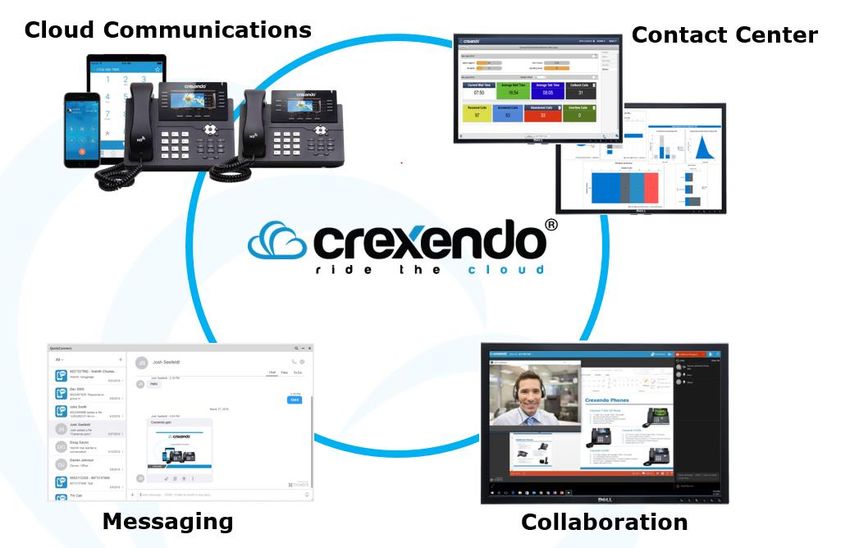
Crexendo, The Best Kept Secret in UCaaS
 •   A Fast Growing Technology Leader in the Cloud Communications and UCaaS
     (Unified Communications as a Service) space

 •   Tremendous Industry Experienced Company – Exec Mgmt. Team With Over
     150 Years Combined Experience

 •   Designers of a world class, patented cloud based telecom system with in-
     house engineering staff that appeals to businesses with 5 to 5000 handsets

 •   Award Winning Platform – 2019 Unified Communications Product of the
     Year, 2019 Communications Solutions Product of the Year, 2018 Internet
     Telephony Product of the Year, 2017 Internet Telephony Excellence Award
Communications Today
Any Device, Any Time, Any Form!
The Telecom Industry 2019

     It’s A Land Grab!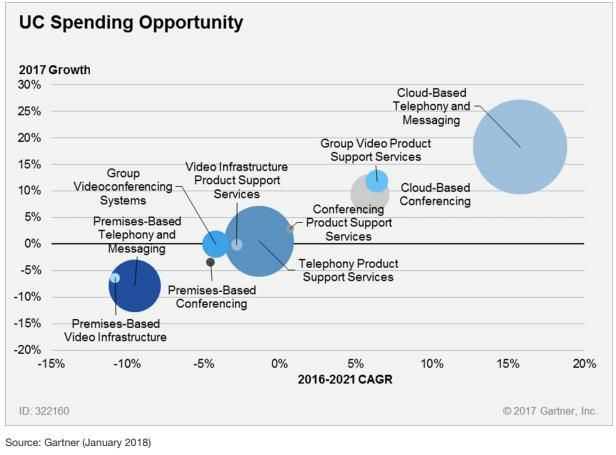
The UCaaS Market Is HOT!

In 2017, Gartner reported that the rate organizations deploy Cloud Telephony
                  will more than DOUBLE from 2017 to 2021
And Getting HOTTER!

•   Gartner Reports that Small and mid-sized businesses will adopt cloud voice and
    conferencing faster than large enterprise customers, driven by capital budget
    constraints, compelling cloud solutions, and limited internal IT resources

•   Research and Markets 2019 UCaaS Market Report shows the Global UCaaS market
    growing at a 25% CAGR between 2019 and 2024

•   IDC’s May, 2018 Worldwide UC and Collaboration Forecast Report has the Total
    Available Market at $54 Billion by 2022
The Crexendo Difference!

•   Crexendo VoIP phones & platform designed, engineered and supported in-
    house (Higher Margins!)

•   CLEC vetted & approved everywhere available in U.S.

•   Hardware maintenance and software upgrades for the life of the Customer

•   Most high end features included as standard offering (call center,
    collaboration, mobility, etc.)

•   In-House, U.S. based service and support 24x7x365

•   Custom Engineering available for custom designs and applications

•   Can provide service to customers who wish to switch carriers, but retain
    their Polycom, Yealink or Cisco branded phones
Why Invest in Crexendo Now?
•   25% increase in telecom revenues for the 9 months ended September 30,
    2019 over 9 month period ended September 30, 2018. 21% increase from
    2017 to 2018

•   Nearly 100% of customers on long term contracts

•   Inflection Point – Net Income of $911,000 or $0.06 per diluted share for the
    9 months ended September 30, 2019

•   Positive cash flow provided by operating activities of $1.2 million for 9
    months ended September 30, 2019

•   High growth + Recurring revenue + Strong cash flow = Higher multiples!

•   Stable cost structure + Experienced, cost conscious management team +
    Positive operating margin = Strong Future!
Improving Financial Profile

                                      Year Ended      Year Ended      Year Ended      YTD Period
                                     December 31,    December 31,    December 31,       Ended
          Ticker: CXDO                   2016            2017            2018        Sept 30, 2019

Market Capitalization                $19.7 million   $30.0 million   $36.0 million   $44.9 million

Outstanding Common Stock              13.7 million    14.3 million    14.4 million   14.6 million

Consolidated Revenue increases
(over prior period)
                                         17%             22%             17%             25%

Backlog                              $15.9 million   $19.9 million    $23 million    $25.3 million

Net (Loss)/Income   (In thousands)     $(2,792)        $(1,020)         $(223)           $911

GAAP (loss)/income per share            $(0.21)         $(0.07)         $(0.02)         $0.06

Non-GAAP net (loss)/income per
share (Diluted)
                                        $(0.12)         $(0.01)          $0.02          $0.08
Telecommunications Segment Revenue
Consistent Revenue Growth
2016 2017 2018 YTD Q3 2019
$12,500,000
$10,500,000
NRR
$8,500,000
MRR
$6,500,000
$4,500,000
$2,500,000
$500,000Telecommunications Segment Backlog
Consistent Growth in Backlog
Q3 16 Q3 17 Q3 18 Q3 19
$25,500,000
$20,500,000
$15,500,000
$10,500,000
$5,500,000
$500,000Telecommunications Segment Backlog
Expected Backlog Revenue Recognition
Remaining
2019 2020 2021 2022 2023 2024
$8,500,000
$7,500,000 Product Revenue
Service Revenue
$6,500,000
$5,500,000
$4,500,000
$3,500,000
$2,500,000
$1,500,000
$500,000Net Income (Loss) & Non-GAAP Income (Loss)
Consistent Bottom Line Improvement
2016 2017 2018 YTD Q3 2019
$1,500,000
$1,000,000
$500,000
$- Net Income $911,000
Non-GAAP $1,200,000
$(500,000)
$(1,000,000)
$(1,500,000)
$(2,000,000)
$(2,500,000)
$(3,000,000)Sales Sources
Partner Channel Driving Sales Growth
2016 2017 2018
59% 68%
66%
Partner Channel Direct Sales Partner Channel Direct Sales Partner Channel Direct SalesCrexendo’s Growth Strategy
Partner Sales
• Currently more than 240 Partners with growth plans to add 5% per Quarter
• Focused on Reseller Partners in 4 Key areas:
– Traditional Telecom VAR’s
– Data and B2B VAR’s
– Managed Service Providers (MSPs)
– Master Agents
• Tenured staff with a wealth of experience in Channel Partnerships
Direct Sales
• Sell directly to larger sized customers and National Accounts
• Tenured and experienced Direct Sales Team with additional hires planned
Acquisitions
• Always looking for accretive acquisition targetsExperienced Leadership Team
Steve Mihaylo Doug Gaylor Ron Vincent
CEO President & COO CFO
Nishith Chudasama Darren Johnson Brian Spitler
VP ENG VP Sales VP OPSRide The Cloud With Crexendo • Great technology that we own and design • Great software what we develop with and for our Customers • Great team that has had great success in the industry • Great industry that has tremendous future growth • Great recurring revenue model • Great cost management strategy • Great Future!
Questions & Answers
Appendix
Appendix – Crexendo Cloud Telecom Features

Crexendo Cloud VoIP Features Highlights                      User Features - Continued
•   Business-Class Voicemail with E-Mail Delivery            •   Call forward/Call transfer/Call waiting
•   Extensive Auto Attendant Options                         •   Paging – Internal and External
•   Free Unlimited Local & Domestic Long Distance Calling    •   Consultative Transfer
                                                             •   Blind Transfer
•   ACD Hunt Groups with Advanced Routing and Reporting
                                                             •   Local 3-way conference
•   Conference Bridge - 20 party audio bridge/pin number     •   Web Portal/User Mgmt.
•   Customized Music/Message on Hold with Multiple Options   •   HD Speakerphone
•   DID service and Programmable Caller ID                   •   System Admin Portal
•   Keep Existing Business Numbers                           •   Simultaneous Ring Groups
                                                             •   ACD Call Center Apps
•   Call Park, Call Retrieve
                                                                    •    Monitor
•   Record A Call, Auto Call Record                                 •    Barge
•   Unified Communications                                          •    Whisper
•   Cloud Fax Electronic E-Mail                                     •    Auto Call Record
•   Disaster Recovery/ Business Continuity                          •    Skills Based Routing
                                                                    •    Enhanced Reporting
•   Crexendo Mobile App for Cell Users
                                                             •   Enhanced 9-1-1 (E911)
                                                             •   Callers log, Blacklist
User Features                                                •   Do Not Disturb (DND)
•   Extension Dialing                                        •   Toll-Free Numbers
•   Follow Me/Find Me                                        •   Virtual Numbers
                                                             •   Many, Many More
•   Intercom, Hands-free Answer
Appendix - Reconciliation of GAAP to Non-GAAP
Third Quarter - 2019
Reconciliation of U.S. GAAP Net Income/(Loss) to Non-GAAP Net Income/(Loss)
(Unaudited)
Three Months Ended September 30, Nine Months Ended September 30,
2019 2018 2019 2018
(In thousands) (In thousands)
U.S. GAAP net income/(loss) $ 334 $ (199) $ 911 $ (215)
Share-based compensation 107 169 293 344
Amortization of intangible assets 13 18 40 54
Non-GAAP net income/(loss) $ 454 $ (12) $ 1,244 $ 183
Non-GAAP earnings/(loss) per common share:
Basic $ 0.03 $ (0.00) $ 0.09 $ 0.01
Diluted $ 0.03 $ (0.00) $ 0.08 $ 0.01
Weighted-average common shares outstanding:
Basic 14,663,151 14,346,092 14,507,696 14,311,190
Diluted 15,629,647 14,346,092 15,444,063 15,130,602
Reconciliation of U.S. GAAP Net Income/(Loss) to EBITDA to Adjusted EBITDA
(Unaudited)
Three Months Ended September 30, Nine Months Ended September 30,
2019 2018 2019 2018
(In thousands) (In thousands)
U.S. GAAP net income/(loss) $ 334 $ (199) $ 911 $ (215)
Depreciation and amortization 25 26 69 66
Interest expense 1 5 9 8
Interest and other expense/(income) 1 (7) (10) (14)
Income tax provision - 8 7 15
EBITDA 361 (167) 986 (140)
Share-based compensation 107 169 293 344
Adjusted EBITDA $ 468 $ 2 $ 1,279 $ 204APPENDIX - CREXENDO, INC. AND SUBSIDIARIES
Condensed Consolidated Balance Sheets
(Unaudited in thousands, except par value and share data)
S e pte m be r 30, 2019 De ce m be r 31, 2018
As s e ts
Current asset s:
Cash and cash equivalent s $ 3,308 $ 1,849
Rest rict ed cash 100 100
T rade receivables, net of allowance for doubt ful account s of $28
as of Sept ember 30, 2019 and $14 as of December 31, 2018 434 419
Cont ract asset s 14 12
Invent ories 162 270
Equipment financing receivables 126 67
Cont ract cost s 367 371
P repaid expenses 401 244
Income t ax receivable 3 1
T ot al current asset s 4,915 3,333
Long-t erm t rade receivables, net of allowance for doubt ful account s
of $0 as of Sept ember 30, 2019 and December 31, 2018 6 10
Long-t erm equipment financing receivables, net 467 184
P ropert y and equipment , net 167 124
Operat ing lease right -of-use asset s 915 -
Int angible asset s, net 127 167
Goodwill 272 272
Cont ract cost s, net of current port ion 414 342
Ot her long-t erm asset s 103 117
T ot al Asset s $ 7,386 $ 4,549
Li abi l i ti e s an d S tock h ol de rs ' Equ i ty
Current liabilit ies:
Account s payable $ 92 $ 155
Accrued expenses 1,418 1,131
Finance leases 29 28
Not es payable 4 56
Operat ing lease liabilit ies 247 -
Cont ract liabilit ies 764 641
T ot al current liabilit ies 2,554 2,011
Cont ract liabilit ies, net of current port ion 419 422
Finance leases, net of current port ion 94 116
Operat ing lease liabilit ies, net of current port ion 668 -
T ot al liabilit ies 3,735 2,549
St ockholders' equit y:
P referred st ock, par value $0.001 per share - aut horized 5,000,000 shares; none issued — —
Common st ock, par value $0.001 per share - aut horized 25,000,000 shares, 14,711,474
shares issued and out st anding as of Sept ember 30, 2019 and 14,394,113 shares issued
and out st anding as of December 31, 2018 15 14
Addit ional paid-in capit al 61,892 61,153
Accumulat ed deficit (58,256) (59,167)
T ot al st ockholders' equit y 3,651 2,000
T ot al Liabilit ies and St ockholders' Equit y $ 7,386 $ 4,549Thank You! Symbol OTCQX: CXDO
You can also read