4.0 Agricultural Trends - City of Fond Du Lac
←
→
Page content transcription
If your browser does not render page correctly, please read the page content below
FOND DU LAC COUNTY FARMLAND PRESERVATION PLAN

 4.0 Agricultural Trends
4.1    Agricultural Land Use
Acres of agricultural land are computed on an annual basis by the Wisconsin Department of
Revenue. These acres are based on assessment records. This is valuable information when
tracking the amount of agricultural land in use each year. It also shows the trend in conversion
of agricultural land to other uses. Table 4-1 shows the amount of existing agricultural acreage
in each community within the County in 2014 and 2019.

According to 2019 statement assessments, Fond du Lac County had 280,698 acres of agricul-
tural land. This is a -0.48% decrease from the amount of agricultural land available in 2014 with
1,363 acres having been converted to other uses within the County over the 5-year time span.
Towns within the County have primarily followed the same trend of a decrease in agricultural
land from 2014 to 2019. The greatest percentage losses within unincorporated areas were ex-
perienced by the Towns of Eldorado (-2.48%), Fond du Lac (-2.45%), and Auburn (-2.39%).
The Town of Eldorado also experienced the greatest acreage loss of -362 acres, which was
over 25% of all acreage lost within Fond du Lac County.

Due to annexations and development, it varied as to whether the villages and cities gained or
lost agricultural land over the 5-year period. Villages within the County had a net loss of 40
acres, whereas the cities within the County had a net gain of 10 acres which can be attributed to
annexations from surrounding townships. It should not be expected that the additional agricul-
tural acreage within cities remain in agricultural use.

The loss in farmland does not appear to be excessive. However, once lost, the acreage cannot
be replaced. In some cases, land can be converted from an idle state back to production, but
typically those acreages are marginal land for farming.

The best approach to maintaining farmland continues to be minimizing the conversion to other
uses. Although land use planning and zoning play major roles, commodity prices play a huge
factor in maintaining farmland. If markets are strong, farmers will stay in farming which creates
a demand for farmland. The result is a reduced desire to convert farmland to other uses.

FINAL DATCP SUBMITTAL, MARCH/APRIL ??, 2021,
DATCP CERTIFICATION AND FOND DU LAC COUNTY BOARD ADOPTION, MAY/JUNE ??, 2021                  44
FOND DU LAC COUNTY FARMLAND PRESERVATION PLAN
                                       Table 4-1
                 Acres of Agricultural Land by Community, 2014-2019
                                             Acres                         6 Year Change
       Community                       2014           2019            Number         Percent
         T. Alto                      16,233       16,250                17           0.10%
         T. Ashford                   14,662       14,613                -49         -0.33%
         T. Auburn                     7,854        7,666               -188         -2.39%
         T. Byron                     18,476       18,214               -262         -1.42%
         T. Calumet                   13,557       13,502                -55         -0.41%
         T. Eden                      14,615       14,597                -18         -0.12%
         T. Eldorado                  14,583       14,221               -362         -2.48%
         T. Empire                    12,028       11,861               -167         -1.39%
         T. Fond du Lac                6,246        6,093               -153         -2.45%
         T. Forest                    13,064       13,023                -41         -0.31%
Towns

         T. Friendship                 7,247        7,273                26           0.36%
         T. Lamartine                 12,830       12,880                50           0.39%
         T. Marshfield                13,413       13,369                -44         -0.33%
         T. Metomen                   16,943       17,011                68           0.40%
         T. Oakfield                  14,542       14,392               -150         -1.03%
         T. Osceola                    9,067        9,047                -20         -0.22%
         T. Ripon                     15,328       15,218               -110         -0.72%
         T. Rosendale                 16,567       16,540                -27         -0.16%
         T. Springvale                16,620       16,596                -24         -0.14%
         T. Taycheedah                13,060       13,013                -47         -0.36%
         T. Waupun                    12,212       12,435               223           1.83%
Subtotal                              279,147     277,814              -1,333        -0.48%

           V. Brandon                   157             157               0          0.00%
           V. Cambellsport              143             109              -34        -23.78%
           V. Eden                      32              31                -1         -3.13%
           V. Fairwater                 192             186               -6         -3.13%
Villages

           V. Kewaskum                   0               0                0          0.00%
           V. Mount Calvary             269             266               -3         -1.12%
           V. North Fond du             57              61                4          7.02%
           Lac
           V. Oakfield                  202            196                -6         -2.97%
           V. Rosendale                 292            295                3          1.03%
           V. Saint Cloud               296            299                3          1.01%
Subtotal                               1,640          1,600              -40         -2.44%
           C. Fond du Lac               659            667                8          1.21%
Cities

           C. Ripon                     510            513                3          0.59%
           C. Waupun                    105            104                -1         -0.95%
Subtotal                               1274           1,284              10          0.78%
Fond du Lac County Total              282,061        280,698           -1,363        -0.48%
Source: Wisconsin Department of Revenue, Statement of Assessments, 2014 & 2019

FINAL DATCP SUBMITTAL, MARCH/APRIL ??, 2021,
DATCP CERTIFICATION AND FOND DU LAC COUNTY BOARD ADOPTION, MAY/JUNE ??, 2021
                                                                                               45
FOND DU LAC COUNTY FARMLAND PRESERVATION PLAN
4.2 Agricultural Production and Enterprises
Fond du Lac County is a major player in the state’s agricultural economy. Dairy is the key Coun-
ty agricultural industry. In fact, the County ranks 3rd in the state and 20th in the nation for dairy-
producing counties. This high ranking is due to the dominance of dairy farms throughout rural
Fond du Lac County. Other agriculture production highlights for Fond du Lac County include
the following:
• Total number of farms: 1,244
• Total acres of land in farms: 317,371 (69% of County total)
• Average size of farm: 255 acres
• Total number of jobs: 7,262
• Average net cash farm income per farm: $61,967
• Cows: 58,855 on 220 dairy farms (With Rosendale Dairy approx. 8,400 cows)
• Annual milk production: Over 1.5 billion pounds (26,400 pounds per cow)
• Market value of products sold: $396.7 million (5th in State)
o Livestock, poultry, and their products: $301.5 million
o Crops: $95.2 million
• Top 5 Products:
o Milk: $256.7 million
o Grain: $78.3 million
o Cattle & Calves: $40.9 million
o Vegetables: $9.5 million
o Hay & Other Crops: $4.4 million
Data Sources: 2017 Census of Agriculture, United States Department of Agriculture (USDA) National Agricultural Statistics Service
(NASS); 2019 Wisconsin Agricultural Statistics, United States Department of Agriculture (USDA) National Agricultural Statistics
Service (NASS)
Additional information regarding Fond du Lac County agriculture production and growing enter-
prises can be found in Appendix B, “2017 Census of Agriculture, County Profile, Fond du Lac
County, Wisconsin, United States Department of Agriculture (USDA) National Agricultural Sta-
tistics Service (NASS)”
4.3 Conversion of Agricultural Lands to Other Uses
Outside the City of Fond du Lac, Fond du Lac County is largely a rural agricultural area. Histor-
ically, there has always been pressure to convert agricultural land to other nonagricultural uses,
especially nonfarm residential development. However, development pressure has not been uni-
form throughout the County as some towns receive more pressure than others. For example,
the eastern third of the County has a greater mixture of rolling topography, lake views, and for-
ested areas which often attract rural residential home buyers and recreational land seekers. The
land use pattern in eastern Fond du Lac County is evidence to this fact. Likewise, farmland ad-
jacent to incorporated cities and villages also receive more development interest. Often, these
lands are annexed, developed and farmland is lost. However, the County must accommodate
population growth in order to maintain a viable work force and economy. As long as growth is
planned and controlled to ensure an efficient development pattern, the impacts of farmland con-
version can be lessened significantly. Commodity prices play a huge roll as well. Strong farm
markets will keep farmers working the land and lessen the desire to convert land to other uses.
All communities (cities, villages, and towns) have done an excellent job creating and maintain-
ing comprehensive plans to manage growth and change within their respective borders. Some,
like the City of Fond du Lac, have even executed intergovernmental agreements with adjacent
towns to manage change. Since all towns in Fond du Lac County have planned for and zoned
land for farmland preservation, the conversion of farmland to other non-farm uses has been
minimized in most towns. The development, adoption, and certification of the 2021 Fond du Lac
FINAL DATCP SUBMITTAL, MARCH/APRIL ??, 2021,
DATCP CERTIFICATION AND FOND DU LAC COUNTY BOARD ADOPTION, MAY/JUNE ??, 2021 46FOND DU LAC COUNTY FARMLAND PRESERVATION PLAN
County Farmland Preservation Plan will allow farmland preservation efforts to continue for at
least the next ten years.
There are various methods that can be used to show development pressure. One method is to
track the number of land divisions. Since most land divisions require County approval, the num-
ber of land divisions by town is a good indicator of the growth pressure within the County. For
this plan, only land divisions creating lots five acres or less in area were used for analysis. The
five acres threshold was used in this plan due to the likeliness that lots of this size have been or
will be entirely converted to a land use other than agriculture.
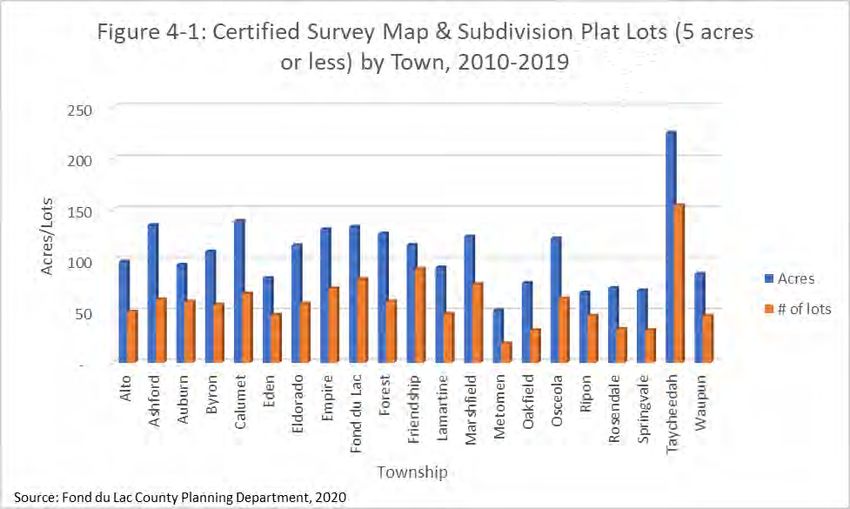
Table 4-2 summarizes the land division activity creating lots five acres or less by town from
2010 through 2019. This data set incorporates the years immediately after the 2008 economic
recession and recovery since. Although Fond du Lac County contains a strong agricultural land
use presence, the County is not immune to the transition of farmland to other uses. During this
period of time, 1,259 lots, five acres or less in area, were created consuming 2,275 acres of
land. The average annual loss of land to the creation of lots five acres or less in area was 227
acres. On average, each lot five acres or less in area created in Fond du Lac County consumed
1.8 acres. This data for the 10 year period from 2010 from 2019 very closely aligns with the
Wisconsin Department of Revenue’s data for the 6 year period from 2014 through 2019, as
shown in Table 4-1.
Please note that the lots used in this analysis Table 4-2:
include lots for residential, commercial, industri- Certified Survey Map & Subdivision Plat
al, and institutional type uses. Lots created for Lots (5 acres or less) by Town, 2010-2019
commercial, industrial, and institutional type us- Township Acres % of Total # of lots
es often require larger parcel acreage and may Alto 99 4.4% 50
not be entirely represented in this analysis. Fur- Ashford 135 5.9% 62
thermore, larger lots converted to residential Auburn 96 4.2% 60
uses may also not be entirely represented in Byron 109 4.8% 57
this analysis. In addition, not all land utilized for Calumet 139 6.1% 68
lot creation may have been farmland. Also, one Eden 83 3.6% 47
cannot assume all the acreage utilized to create Eldorado 115 5.1% 58
lots has been lost entirely to the practice of Empire 131 5.7% 73
farming, although the fragmentation of land is Fond du Lac 133 5.9% 82
never conducive to the long range benefit of Forest 127 5.6% 60
agricultural activity. One reason for only using Friendship 115 5.1% 92
lots five acres or less in area for this analysis is Lamartine 93 4.1% 48
to avoid including those lots which may have Marshfield 124 5.4% 77
only partially been lost to the practice of farming Metomen 51 2.3% 19
or converted to a small-scale agricultural opera- Oakfield 78 3.4% 32
tion. Tracking land division activity is a useful Osceola 122 5.3% 63
barometer in gauging non-farm development Ripon 69 3.0% 46
activity. Rosendale 73 3.2% 33
Springvale 71 3.1% 32
Taycheedah 225 9.9% 154
Waupun 87 3.8% 46
Total 2,275 1,259
Source: Fond du Lac County Planning Department, 2020
FINAL DATCP SUBMITTAL, MARCH/APRIL ??, 2021,
DATCP CERTIFICATION AND FOND DU LAC COUNTY BOARD ADOPTION, MAY/JUNE ??, 2021
47FOND DU LAC COUNTY FARMLAND PRESERVATION PLAN
From a general perspective, the towns located in the western portion of the County (where agri-
culture is more predominant), lost fewer acres to lot creation than the central and eastern towns.
Since the demand for agricultural land appears strongest in the western portion of the County, it
is expected that the conversion of farmland to other uses will continue to be less there than oth-
er portions of the County.
Table 4-3 shows the chronological activity of lot creation during the same 10 year period. As
one would expect, lot creation fol-
Table 4-3: Certified Survey Map & Subdivision Plat
lowed the economic condition of the
Lots (5 acres or less) by Year, 2010-2019
country. Lot creation in the years im-
mediately following the 2008 reces- Year Acres # of Lots
sion was modest with an increase in 2010 141 76
lot creation starting in 2014 through 2011 195 104
2019. It is expected that lot creation 2012 238 118
and overall economic development 2013 166 99
will remain strong in the upcoming 2014 332 170
years due to the current robust econ- 2015 208 119
omy, but the long term effects of the 2016 208 121
COVID-19 pandemic remain to be 2017 255 139
seen. Throughout this 10 year period, 2018 287 177
the agricultural economy stayed 2019 245 136
steady to strong, creating more de- Total 2,275 1,259
mand for farmland to satisfy crop and Average 227 126
Source: Fond du Lac County Planning Department, 2020
dairy markets.
Another source of information to track farmland loss is through the 2017 Census of Agriculture.
This report indicates that Fond du lac County lost 1,818 acres of farmland in the five year
period between 2012 and 2017. According to the 2017 Census of Agriculture, farmland loss
averaged 364 acres per year. Putting farmland loss into another perspective, 1,818 acres
accounts for almost 3 sections of land throughout the County.
FINAL DATCP SUBMITTAL, MARCH/APRIL ??, 2021,
DATCP CERTIFICATION AND FOND DU LAC COUNTY BOARD ADOPTION, MAY/JUNE ??, 2021 48FOND DU LAC COUNTY FARMLAND PRESERVATION PLAN
4.4 Anticipated Changes in Agricultural Production, Processing, Supply,
and Distribution
The anticipated changes for agriculture production, processing, supply, and distribution look
very favorable for growth throughout the County and the region. According to agriculture pro-
fessionals within the County, Fond du Lac County is home to high quality farms which produce
high quality milk that is in demand. This milk is processed and packaged locally. Fond du Lac
County provides a well-built transportation network and support infrastructure that allows for
product to move in and out of the County easily and efficiently. Finally, due to agricultural
roots, workers in Fond du Lac County are known for their strong work ethic, making them at-
tractive to local business and industry.
As indicated in Section 2.7, Business Development, the growing agricultural base of Fond du
Lac County has created ten (10) specific opportunities for additional economic activity. Cur-
rently agriculture within the County generates over $396 million in products sold and $1.3 bil-
lion in economic activity. Every dollar of sales from agricultural products generates an addi-
tional $.40 of business sales in other parts of the County’s economy.
The direct effect of agriculture equals $1.65 billion and includes the sale of farm products, pro-
cessed and other value-added products.
Purchases of agricultural and food-processing inputs, services and equipment add another
$543.6 million in business sales. For example, this includes business-to-business purchases
of fuel, seed, fertilizer, feed, and farm machinery, as well as veterinary services, crop and live-
stock consultants and financial services. This business-to-business activity then generates
another $115 million in business sales when people who work in agriculture-related business
spend their earnings in the local economy.
ORGANIC FARMING and ECONOMIC IMPACTS:
Wisconsin has seen dramatic growth as the number of certified organic farms has grown from
1,180 in 2014 to 1,537 in 2017, an increase of 30.25%. Fond du Lac County grew substantially
in the number of organic farms over the same timeframe, with over double the amount by 2017.
The number of organic farms in Fond du Lac County increased from 13 to 28, a 115% increase.
Here are some key facts on organic farming as of 2017:
• Wisconsin is second only to California in the number of organic farms with organic sales
in the amount of $200.8 million. This was a 51.2 percent increase from 2008 to 2014.
• Wisconsin ranks first in the U.S. in regard to the number of farms producing organic
eggs, beef, hogs, sheep, goats, broilers, and row crops and second in farms producing
organic vegetables and melons. Sales in organic milk have increased nearly 30 percent
from 2008 to 2014.
• Wisconsin ranks third in the total number of organic acres with an increase of nearly 17
percent from 2008 to 2014.
• In 2014, Wisconsin was the top state regarding organic dairy with 429 farms. Milk sales
increased nearly 30 percent from 2008 to 2014, raising to 110.5 million.
FINAL DATCP SUBMITTAL, MARCH/APRIL ??, 2021,
DATCP CERTIFICATION AND FOND DU LAC COUNTY BOARD ADOPTION, MAY/JUNE ??, 2021
49FOND DU LAC COUNTY FARMLAND PRESERVATION PLAN
• Even with these impressive numbers for production, organic processing still causes a
bottleneck for growth in the industry due to organic produce processing not keeping
pace with production.
• In 2017, Fond du Lac County contained approximately 29 organic farms, which more
than doubled since 2012.
For more information and to download the “Organic Agriculture in Wisconsin: 2017 Status Re-
port”, please visit:
http://www.cias.wisc.edu/wp-content/uploads/2017/02/organicreport2017web2final.pdf
Continued growth in organic agriculture production, processing, supply, and distribution can be
expected county-wide and regionally.
FINAL DATCP SUBMITTAL, MARCH/APRIL ??, 2021,
DATCP CERTIFICATION AND FOND DU LAC COUNTY BOARD ADOPTION, MAY/JUNE ??, 2021 50You can also read