1.4 Viet Nam - Economic Research Institute for ...
←
→
Page content transcription
If your browser does not render page correctly, please read the page content below
1.4 Viet Nam
Viet Nam is a country with a population of 92.7 million (2016). The United Nations (UN) estimates
that by July 2018 the country’s population will be 96.49 million (World Population Review, 2018).
The actual gross domestic product (GDP) growth rate in 2017 was 6.81%, which is more than the
expected rate of 6.3% projected by the Asian Development Bank (ADB), as shown in Figure 2.1.4-
1. It is the highest growth rate in the past 6 years. With this growth rate, the GDP per capita is
US$2,385, an increase of US$170 compared to 2016.
           Figure 2.1.4-1 Gross Domestic Product Growth of Viet Nam, 2012–2018

           Note: 2018 figure is projected.
           Source: ADB (2017).

As a growing country, the government has released many policies that relate to energy saving
and energy efficiency, power development planning, CO2 reduction strategies, intended
nationally determined contributions, and so on. The following are some important ones:
- Decree No. 153/2004/QĐ-TTg: Strategic direction for sustainable development in Viet Nam
- Decree No. 1427/QD-TTg, 02/10/2012: Approval on the National Target Program on Energy
  Efficiency and Conservation for the Period 2012–2015
- Decree No. 177/2007/QĐ-TTg: Project of Biofuels Development to 2015 and the Vision to
  2025
- Decree No. 1993/QD-TTg: Approving the National Green Growth Strategy: Period 2011–2020
- Nationally Determined Contribution in 2015 specifying the national contribution (target) for
  the period 2021–2030 covering the entire economy
- Decree No. 428/QD-TTg, approved the adjustment of the National Power Development Plan
  VII (PDP 7 rev) for the period of 2016–2020, vision to 2030.

                                               51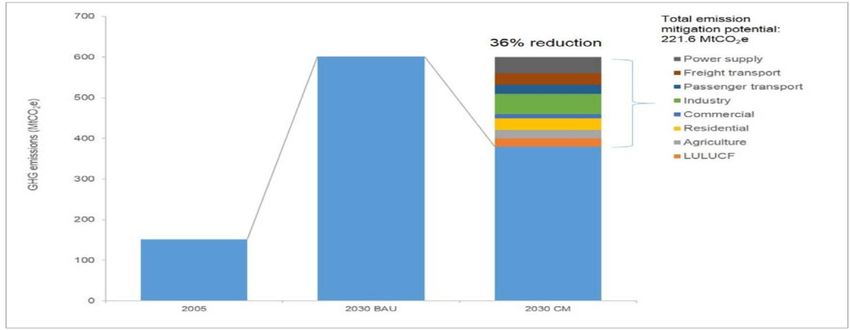
1.4.1. Current Status of Energy Supply
Viet Nam’s total primary energy supply in 2013 was 58.8 million tonnes of oil equivalent (Mtoe),
which is a slight increase of 1.3% from the 2012 level and 44% higher compared to the 2005 level
according to government’s energy statistics source. Energy sources in 2013 were diversified: 29%
of the supply came from coal, 25% from oil, 15% from natural gas, 8% from hydropower and
electricity import, and 23% from biomass (Figure 2.1.4-2). Viet Nam has been a net energy
exporter; however, the trade surplus has significantly decreased over the last decade with
implementation of the government’s export restriction policy for natural resources, together
with the promotion of domestic capacity development in the transformation and manufacturing
sectors. Viet Nam’s energy consumption has been driven by energy infrastructure extensions,
encouraging economic growths rates (6.1% per year on average during 2005–2013 for GDP)
along with structural change towards larger contributions from industry and services sectors,
and improvement of household income over the past 2 decades. Per capita primary energy
consumption and supply steadily increased until 2010, then levelled off. It reached 0.65 tonnes
of oil equivalent per person in 2013, equal roughly to 25% of the Asia-Pacific Economic
Cooperation (APEC) region’s average (APERC, 2016).
             Figure 2.1.4-2 Total Primary Energy Supply of Viet Nam, 2005 vs 2013

MTOE = million tonnes of oil equivalent.
Source: APERC (2016).

Transportation has witnessed rapid growth, with road transport accounting for the highest share
of passenger and cargo transportation, followed by waterborne transport.
Viet Nam’s total final energy consumption increased from 43,202 kilotonnes of oil equivalent
(ktoe) in 2008 to 47,873 ktoe in 2012. The changes in final energy consumption per energy type
from 2008 to 2012 are shown in Table 2.1.4-1.

                                              52
Table 2.1.4-1 Energy Consumption in Viet Nam by Type
Fuel type 2008 2009 2010 2011 2012
Coal 8,289 8,966 9,893 9,647 8,390
Oil 13,819 15,851 17,080 15,297 14,896
Gas 540 639 493 894 1,438
Electricity 5,844 6,615 7,461 8,140 9,063
Non-commercial energy 14,710 14,704 13,875 13,938 14,086
Total 43,202 46,775 48,802 47,916 47,873
Source: MoNRE (2015).
In 2014, Viet Nam’s total electricity supply was 145.5 terawatt-hours, increasing over 11% from
its 2013 level (Table 2.1.4-2). Of this total electricity output, over 41% came from hydropower
plants and other renewables, 57% from thermal power plants, and less than 2% from import
(MOIT, 2016).
Viet Nam’s power system is the third largest in the Association of Southeast Asian Nations
(ASEAN), with a total installed power capacity of over 34.5 gigawatts in 2014. During 2005–2014,
over 22.4 gigawatts were newly built, which corresponded to an average growth of nearly 13%
per year. Development of renewable power sources recorded the highest growth at 15.1% per
year on average.
Table 2.1.4-2 Installed Power Capacity and Generation in Viet Nam, 2013
Capacity Share Generation Share
Power Type
(MW) (%) (GWh) (%)
Large Hydro (>30 MW) 13,260 43.2 51,945 40.8
Coal thermal 7,116 23.2 26,863 21.1
Gas turbine 7,446 24.3 42,745 33.6
Oil thermal 912 3.0 249 0.2
Diesel 70 0.2 7 0.0
Other Renewables 1,884 6.1 5,511 4.3
Small-hydro 1,670 5.4 4,989 3.9
Wind 56 0.2 62 0.05
Biomass 150 0.5
Biogas/MSW 4 0.01 460 0.36
Solar power 4 0.01
Total 30,688 100 127,320 100
GWh = gigawatt-hour, MSW = municipal solid waste, MW = megawatt.
Source: MOIT (2016).
53Viet Nam’s total final energy consumption (TFEC) in 2013 was 50.6 Mtoe, up 2.6% from 2012 and
36% higher than the 2005 level (VNEEP, 2015). The demand structure by fuel has changed
significantly, with a reduction in the share of biomass (non-commercial energy) and a rise in
modern fuels, including oil, coal, gas, and especially electricity. During 2005–2013, electricity
demand grew over 13% per year on average, reflecting progress in industrialisation and
modernisation of the economy.
1.4.2. Energy Demand
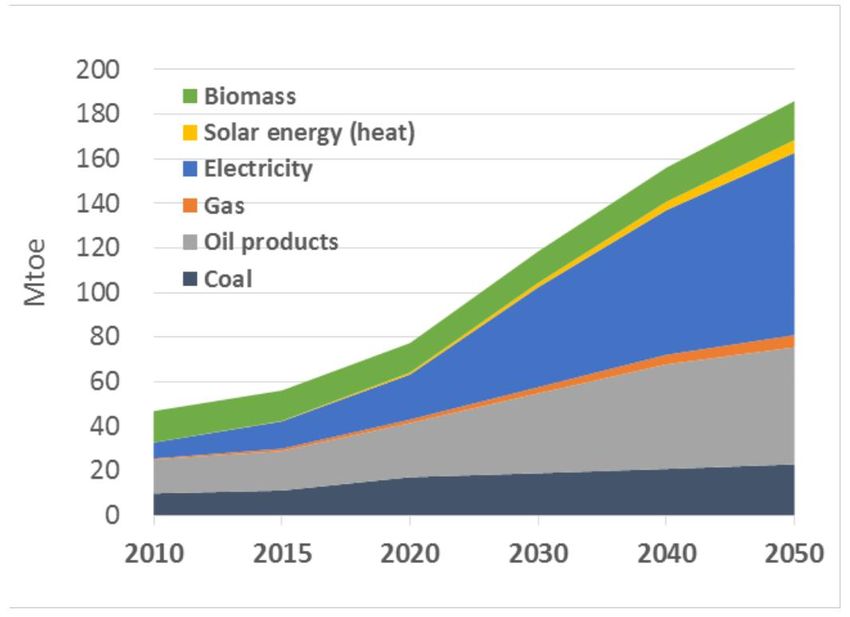
Viet Nam is forecasting economic growth (GDP) between 6.5% and 7.6% per year over the period
to 2030 (MOIT, 2015). Under the Energy Efficiency Scenario, Viet Nam’s final energy demand is
projected to double to 119 Mtoe in 2030 and 186 Mtoe in 2050 (Government of Viet Nam, 2015).
This corresponds to an average growth rate of 5% per year during 2013–2030, then lower at 2%
per year during 2030–2050. Industry remains the highest-consuming sector throughout the
forecast period, with a share increase to 46% in 2030 and 48% in 2050. Transport demand
continues to grow quickly and surpasses residential demand, with a share of 23% in 2030–2050.
The share of residential demand drops significantly to 22% in 2030 and 21% in 2050.
Contributions from the commercial and agriculture sectors rise slightly from 4% in 2013 to about
8% in 2030 and 9% in 2050 (Figure 2.1.4-3).
Figure 2.1.4-3. Final Energy Demand in Viet Nam by Sector, 2005–2050
Mtoe = million tonnes of oil equivalent.
Source: Government of Viet Nam (2015).
Final demand for electricity is forecasted to continue to increase strongly at over 10% per year
to 2020 and then grow between 6% and 9% per year over the period 2020–2030. Meeting this
demand will require an investment of around US$42 billion to 2030, with 58% required for
generation and 42% for transmission and distribution (MOIT, 2015). Oil demand will increase
faster than the past growth rate: 6.5% per year to 2020 and 4% per year over the period 2020–
2030, compared to a rate of 3.5% per year during 2010–2015 (Figure 2.1.4-4).
54Figure 2.1.4-4. Final Energy Demand in Viet Nam by Fuel, 2010–2050
Mtoe = million tonnes of oil equivalent.
Source: Government of Viet Nam (2015).
Other assumptions on power generation according to a business-as-usual (BAU) scenario given
in the Intended Nationally Determined Contributions (MoNRE, 2015) is presented in Table
2.1.4-3.
Table 2.1.4-3 Assumptions on Power Generation in Viet Nam According to the Business-as-
Usual Scenario
Unit: billion kWh
2010 2020 2030
Large-scale hydropower 27.8 64.6 64.6
Coal-fired thermal power 17.9 163.5 422.4
Gas-fired thermal power 45.3 81.5 107.8
Renewable energy 3.3 3.3 3.3
Nuclear power 0 6.9 70.1
Imported energy 0 9.9 26.4
Total 94.3 329.7 694.6
kWh = kilowatt-hour.
Source: MoNRE (2015).
551.4.3. Revised Power Development Plan 2011–2020, Vision 2030
On 18 March 2016, by Decision No. 428/QD-TTg, the Prime Minister approved the adjustment
of the National Power Development Master Plan for the Period 2011–2020 with the Vision to
2030 (PDP 7 rev). Compared to PDP 7 of July 2011, the most obvious change of PDP 7 rev is a
stronger emphasis on renewable energy development and on power market liberalisation.
The specific objectives of PDP 7 rev are as follows:
▪ Provide adequate electricity for the domestic demand, satisfy socioeconomic
development objectives with average GDP growth rates of 7% during 2016–2030:
o Commercial electricity: 235 billion–245 billion kilowatt-hours (kWh) in 2020, 352
billion–379 billion kWh in 2025, and 506 billion–559 billion kWh in 2030
o Electricity production and import: 265 billion–278 billion kWh in 2020, 400 billion–431
billion kWh in 2025, and 572 billion–632 billion kWh in 2030
▪ Prioritise the development of renewable energy sources for electricity production;
increase the proportion of electricity generated from renewable energy sources (excluding
large-scale, medium-scale, and pumped storage hydropower) up to around 7% in 2020
and above 10% in 2030.
▪ Construct the power transmission grid with flexible operation and high automation
capabilities from electricity transmission to distribution; develop unmanned substations
and substations with 50% human participation to increase the capacity of the electricity
industry.
▪ Accelerate the programme of electrification in rural and mountainous areas to ensure that
in 2020 most of the rural households have access to electricity.
Table 2.1.4-4 compares the proportion of power sources as outlined in both PDP 7 as of July 2011
and PDP 7 rev as of March 2016 over the decade from 2020 to 2030. As per the PDP 7 rev
structure, the data are presented on the basis of % age share of total electricity production. As
indicated in Table 2.1.4-4, coal is projected to be the main source for electricity production, while
renewable energy shows an upward trend.
56Table 2.1.4-4. Structure of Power Sources in Total Electricity Production in Viet Nam (%)
2020 2025 2030
Power Sources 2015
PDP7 PDP7 rev PDP7 PDP7 rev PDP7 PDP7 rev
Renewable Energy 3.7% 4.5% 6.5% - 6.9% 6.0% 10.7%
Coal 34.4% 46.8% 49.3% - 55.0% 56.4% 53.2%
Gas Turbine 30.0% 24.0% 16.6% - 19.1% 14.4% 16.8%
Hydro 30.4% 19.6% 25.2% - 17.4% 9.3% 12.4%
Import 1.5% 3.0% 2.4% - 1.6% 3.8% 1.2%
Nuclear - 2.1% - - - 10.1% 5.7%
Source: Data extracted from (VN PDP, 2016).
1.4.4. Current Status of Transportation Fuel Supply and Mitigation Scenario in the Transportation
Sector
The on-road vehicle population consists of about 3 million cars and 46 million motorcycles. In
2010, the transportation sector ranked third after the industry and residential sectors in terms
of share of total energy consumption, constituting of 22% of the overall energy consumption
(Figure 2.1.4-5). The share of the transportation sector in the total energy consumption has
increased from 14.7% in 2000 to 22% in 2010. Figure 2.1.4-6 illustrates the trend in gasoline and
diesel fuel consumption in the road transportation sector from 1980 to 2010. It shows that the
road transportation sector consumed slightly more diesel fuel compared to gasoline fuel in the
past 2 decades. In a BAU scenario, the proportion of diesel consumption is projected to rise from
48% in 2010 to 71% in 2040 (World Bank, 2013).
Besides diesel and gasoline fuels, the use of ethanol E5 has been mandated since 1 January 2018
and E10 is intended to be sold to the market soon, expected to be available in the market in 2019
and nationwide in 2020. With E5 fuel mandated, gasoline RON92 was banned and replaced by
RON92 E5. RON95 gasoline serves as a premium fuel for luxury vehicles. Euro 5 diesel fuel was
also introduced to the market by Petrolimex in January 2018. Compressed natural gas (CNG) is a
potential fuel for the transportation sector. This fuel is now used for buses in Ho Chi Minh City
and is being considered for use for freights in southern Viet Nam. In the north, expecting the
CNG source from Thai Binh province to be exploited, CNG will be introduced for the
transportation sector.
57Figure 2.1.4-5 Share of Final Consumption in Viet Nam by Economic Sector, 2010
Source: World Bank (2013).
Figure 2.1.4-6 Road Transport Diesel and Gasoline Consumption in Viet Nam, 1980–2010
ktoe = kilotonne of oil equivalent.
Source: World Bank (2013).
Diversification of the transport fuel modes is also being considered to pursue greenhouse gas
(GHG) emissions reduction targets. Nguyen et al. (2012) projects a 23 million tonnes of carbon
dioxide equivalent (tCO2e) and 29 million tCO2e emissions reduction in 2030 from passenger
transport and freight transport, respectively, by adopting a selection of low-carbon measures. In
2005, freight transport relied on roads, carrying 71% of the total weight volume, while the rest
was transported by maritime (27%) and rail (2%). Considering a growth in emissions from freight
transport due to rapid development in the industry sector, the proposed countermeasures
include a modal shift from trucks to rail (increase from 2% to 5%) and maritime transport
(increase from 27% to 30%), which reflects an emissions reduction of 4.0 metric tonnes of carbon
dioxide equivalent (MtCO2e), as well as improvement of the efficiency of vehicles being used.
58The switch to biofuel from oil reflects emissions reductions of 23.9 MtCO2e and 1.1 MtCO2e,
respectively.
Figure 2.1.4-7 Greenhouse Gas Emissions and Mitigation Potential
in Viet Nam
Source: Nguyen et al. (2012).
In another study in 2011, the World Bank outlined several mitigation opportunities in Viet Nam
and their theoretical emissions reductions. Since motorcycles are responsible for a large fraction
of vehicular emissions in Viet Nam and passenger car ownership is projected to increase as
income levels increase, the improvement in fuel efficiency must remain a priority for Viet Nam,
including a modal shift from road freight to inland waterways, coastal shipping, and railways
(World Bank, 2011). The study indicated that such mitigation opportunities in the transportation
sector can theoretically lead to a reduction of 18.37 MtCO2e annually, while its feasible medium-
term (2015) goals could reduce 5.49 MtCO2e annually.
1.4.5. Current National Plans for Reduction of Energy Consumption and Greenhouse Gas
Assumptions based on power generation according to BAU in the Intended Nationally
Determined Contributions in 2015 (MoNRE, 2015) project that the share of GHG emissions from
the transportation sector will be 22.5%, 22.5%, and 13% for the years 2010, 2020, and 2030,
respectively.
59Table 2.1.4-5 Greenhouse Gas Inventory in 2010 and Projections for 2020 and 2030 for the
Energy Sector in Viet Nam
2010 2020 2030
GHG source categories
(MtCO2e) (MtCO2e) (MtCO2e)
1 Total 139.9 389.2 675.4
1A Fuel combustion 123.0 355.7 620.3
1A1 Energy industries 41.1 171.3 404.4
1A2 Manufacturing industries and combustion 38.1 69.3 92.5
1A3 Transport 31.8 87.9 87.9
1A4a Commercial/institutional 3.3 8.4 12.1
1A4b Residential 7.1 16.5 20.5
1A4c Agriculture/forestry/fishing 1.6 2.3 2.9
1B Fugitive emissions 16.9 33.5 55.1
1B1 Solid fuels 2.2 16.0 18.5
1B2 Natural oil and gas 14.7 17.5 36.6
GHG = greenhouse gas, MtCO2e = metric tonne of carbon dioxide equivalent.
Source: MoNRE (2015).
For GHG mitigation scenarios, the Intended Nationally Determined Contributions in 2015 specify
the national contribution (target) for 2021–2030, covering Viet Nam’s entire economy as follows:
▪ Unconditional contribution: With domestic resources, by 2030, Viet Nam will reduce GHG
emissions by 8% compared to BAU.1
o Emission intensity per unit of GDP will be reduced by 20% compared to the 2010
levels.
o The level of forest cover will increase to 45%.
▪ Conditional contribution: With international support and the implementation of new
mechanisms under the Global Climate Agreement, by 2030, Viet Nam will reduce GHG
emissions by 25% compared to BAU as follows:
o Energy (including transport and communications), agriculture (including land use
and forestry), and waste can make the greatest contributions.
o The cost of adaptation is estimated in excess of 3–5% of GDP by 2030.
o Investments from the private sector and international support are required.
1
Viet Nam’s BAU scenario for GHG emissions was developed based on the assumption of economic
growth in the absence of climate change policies. The BAU starts from 2010 (the latest year of the national
GHG inventory) and includes the energy, agriculture, waste, and land use, land-use change, and forestry
(LULUCF) sectors.
− GHG emissions in 2010: 246.8 million tCO2e
− Projections for 2020 and 2030 (not including industrial processes):
o 2020: 474.1 million tCO2e o 2030: 787.4 million tCO2e
60References
Asian Development Bank (ADB) (2017), Asian Development Outlook 2017 Update. Manila: ADB.
https://www.adb.org/countries/viet-nam/economy.
Asia Pacific Energy Research Centre (APERC) (2016), APEC Peer Review on Low Carbon Energy
Policies (PRLCE) Phase 3. Tokyo: APERC.
Government of Viet Nam (2015), Summary Study Report on Viet Nam Renewable Energy
Strategy to 2030 with Vision to 2050. Hanoi: Government of Viet Nam.
Government of Viet Nam (2016), the National Power Development Plan VII (called PDP 7
revised), 2016-2020, vision to 2030 (VN PDP, 2016).
Ministry of Industry and Trade (MOIT) (2015), Viet Nam’s Power and Energy Review. MOIT’s
reference materials for PRLCE phase 3’s experts. Hanoi: MOIT.
Ministry of Industry and Trade (MOIT) (2016), Viet Nam Renewable Energy Overview.
Presentation of GDE-MOIT. Workshop on Peer Review on Low Carbon Energy Policy in
Viet Nam, January 2016, Ha Noi.
Ministry of Natural Resources and Environment (MoNRE) (2015), Technical Report: Vietnam's
Intended Nationally Determined Contribution. Ha Noi.
Nguyen, et al. (2012). A Low Carbon Society Development towards 2030 in Vietnam. Retrieved
November 2013, from National Institute for Environmental Studies:
http://2050.nies.go.jp/report/file/lcs_asia/Vietnam_2012.pdf.
VNEEP (National Energy Efficiency Program, Ministry of Industry and Trade) (2015), Viet Nam
Energy Statistics 2013. Ha Noi.
World Bank (2011), Vietnam Urbanization Review: Technical Assistance Report. Washington,
DC: World Bank. http://www.urbanknowledge.org/ur/docs/Vietnam_Report.pdf
(retrieved 2014).
World Bank (2013), Low-Carbon Development Assessment in Transport Sector: Second Report.
Washington, DC: World Bank.
World Population Review (2018), Vietnam Population 2018.
http://worldpopulationreview.com/countries/vietnam-population/
61You can also read