Provision of Affordable Social Housing to address the right to shelter, in the context of BRICS - A case study and model of 3 South African ...
←
→
Page content transcription
If your browser does not render page correctly, please read the page content below
Provision of Affordable Social Housing to address
   the right to shelter, in the context of BRICS

 A case study and model of 3 South African Metropolitan cities
           Jaya Josie, Nozibele Gcora, Krish Chetty
             BRICS Seminar Series– 4 July 2017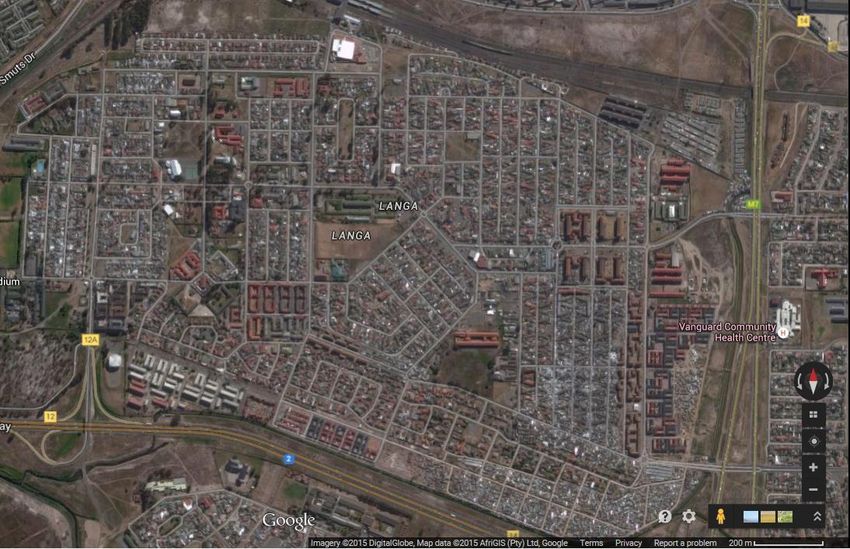
South Africa - Informal Slum Settlement in Cape Town

   • Households from this Joe Slovo informal
     settlement near the City of Cape Town
     were resettled in Delft further away from
     the City and work.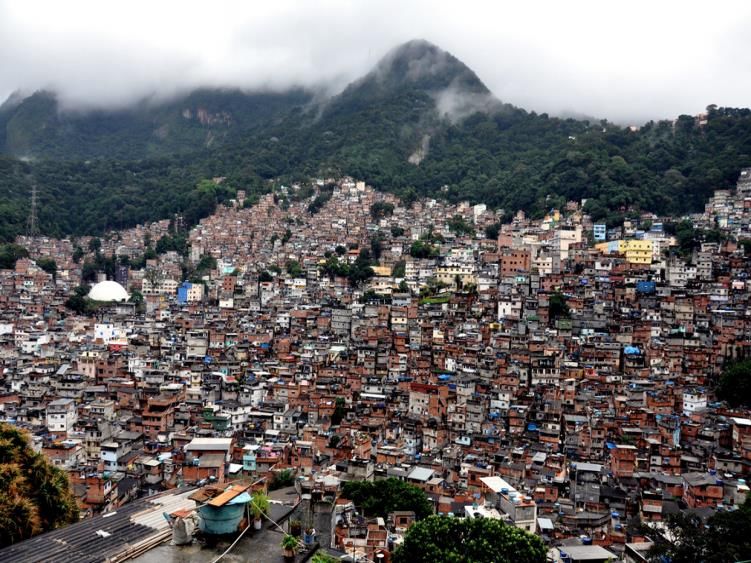
Aim
1.   Review and assess efforts to provide sustainable shelter to meet the
     increased demand in urban slums in Metros

2.   Review public housing provision for disadvantaged and vulnerable
     communities

3.   Review the provision of sustainable housing in South Africa for those
     caught between inaccessibility to mortgages because they don't earn
     enough, and inaccessibility to subsidized housing because they earn too
     much.

4.   Discuss the housing challenges in BRICS

5.   Provide modeling options identifying the opportunities to invest in
     Affordable Housing initiatives.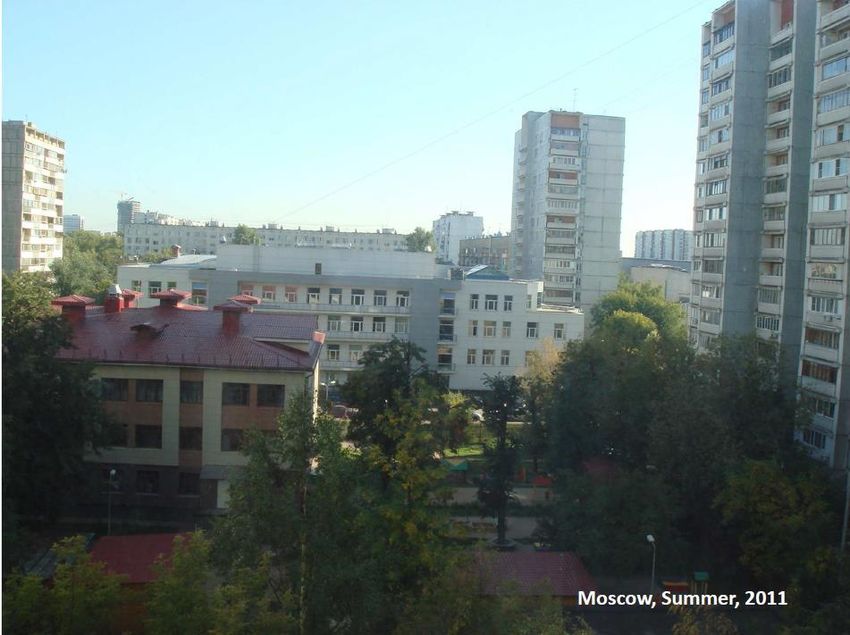
Human Settlement Project Perspective on Development
• Access to Drinking Water                          • Chapter 8 – Transforming Human
                                                      Settlements
• Improved Sanitation
                                                    • Chapter 5 – Environmental
• Living in Slums                                     Sustainability and Resilience
                                                    • Chapter 6 - Inclusive rural
                                                      economy
                                                    • Chapter 9 – Improving Education,
                                                      Training and Innovation
                                                    • Chapter 10 – Health Care for All

                                        National
                             MDGs      Developmen
                                          t Plan

                             Bill of
                             Rights    SDGs

• S 26: Right to Adequate                           • Make cities and human
  Housing and shelter                                 settlements inclusive, safe,
• S 27: Right to Health                               resilient and sustainable
  Care, food, water and                             • Availability and Management
  Social Security                                     of Water and Sanitation
• S 29: Right to Education                          • Access to Energy
South Africa’s Constitutional Guidelines for Financing Housing &
Related Basic Services
The Bill of rights
Constitutionally mandated basic services (CMBS)
Access to basic services is a fundamental right to which
everyone is entitled
The right to housing (S 26) must be subject to progressive
realization, as governments must operate within available
resource
Have the right to shelter, not a house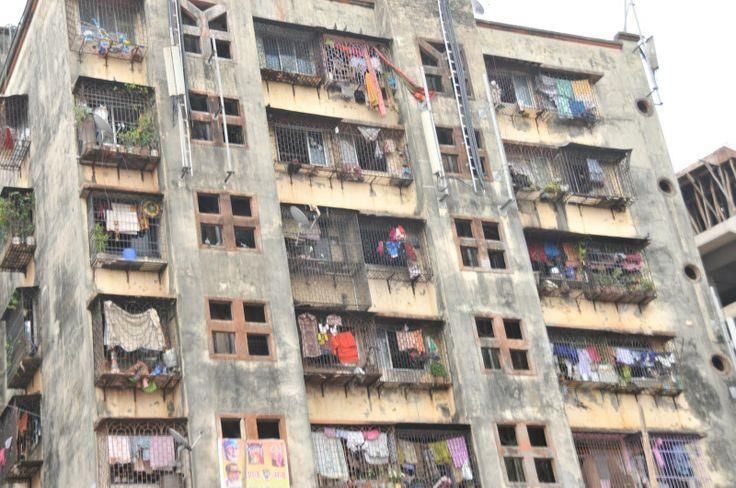
The current state of housing provision
                        20 Years Later
•   Segment demand for housing
    finance includes:
      • Households that are served
        and able to access mortgage
        finance
      • Households supported by the
        subsidy market (RDP
        Subsidies)
      • By comparison households
        falling in the income segment
        of R3,200 to R15000 per
        month have note been
        served – limited government
        or private financing available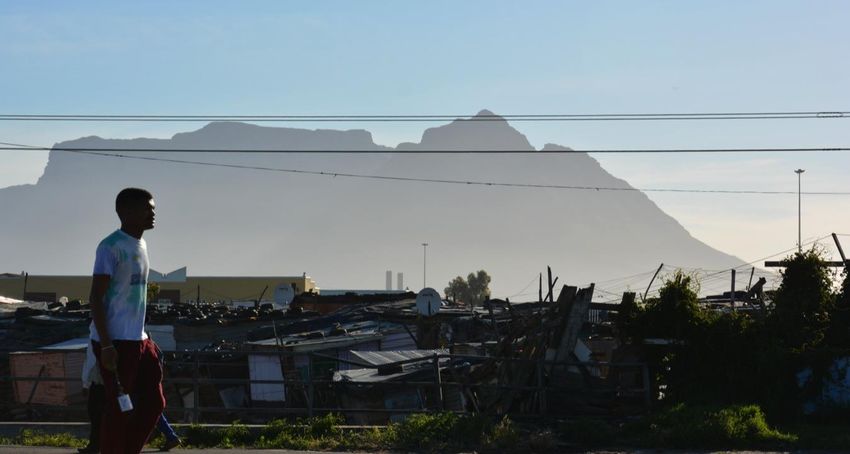
Mind the Gap Market
                                                                       Households per Monthly Income
•  In the Census (2011) the income band that came
                                                                                                    0%
   closest to the gap market were households earning           Below R3 200              15%
   between R3200 to R12800 pm.
                                                               Housing Gap (R3
     • 22% of all households in the gap market.                200 - R12 800)
                                                                                          22%
     • 25% of all households are rented not owned              Above R12800                              63%

     • 13% nationally live in an informal dwelling.            Unspecificied

Housing Backlog                                                  % Household Per Type of Dwelling
•  The housing backlog has remained constant at around      Formal Brick/Concrete                   1%
                                                                                              13%
   2.1million for a number of years                         Structure
                                                            Traditional Dwelling         8%

Housing Delivery                                            Informal Dwelling
                                                                                                         78%
•  On average, the housing department provides 200,000      Caravan/ Tent or
   housing units each year. Little Impact.                  Other

•   For social housing, the Housing Development Agency
    (HDA) has provided 10,251 public sector housing units               % Household per Tenure Status
    for rental over 5 years from 2007/08 to 2011/12                 Rented                            3%

                                                                    Owned but not yet                      25%
•   The Social Housing Regulatory Authority (SHRA)                  paid off                    41%
    provided 7400 housing units in 2012/13 and 2013/14              Occupied rent-free                           12%

                                                                    Owned and fully                      19%
•   Not addressing the needs of the Gap Market                      paid off
Falling in the edges of home ownership and housing provision
                          (Rust 2014)
•   Public & private provision supply of affordable housing to the gap
    market is inadequate
     • households earning between R3500 to R10 000 pm
         • support only 28.8%
         • No new housing construction, limited rental stock, limited resale
           value
         • The FLISP grant for subsidizing the private supply of new
           homes has failed
     • Households earning less than R3500 pm – support only 49.6%
         • Virtually no resale value

•   At current prices there is no market-based affordable housing available
    in South Africa
•   Current public housing policy focuses on financing of ownership of
    housing assets above the provision of housing and shelter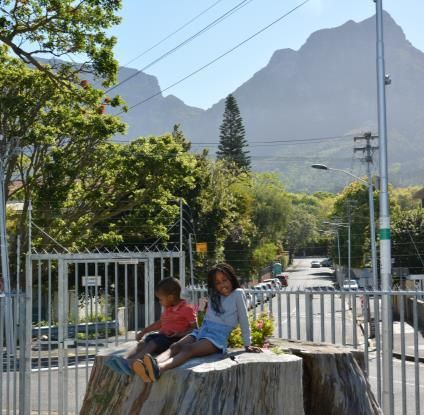
CASE STUDY
From backyard Private rental to Subsidized
Rental
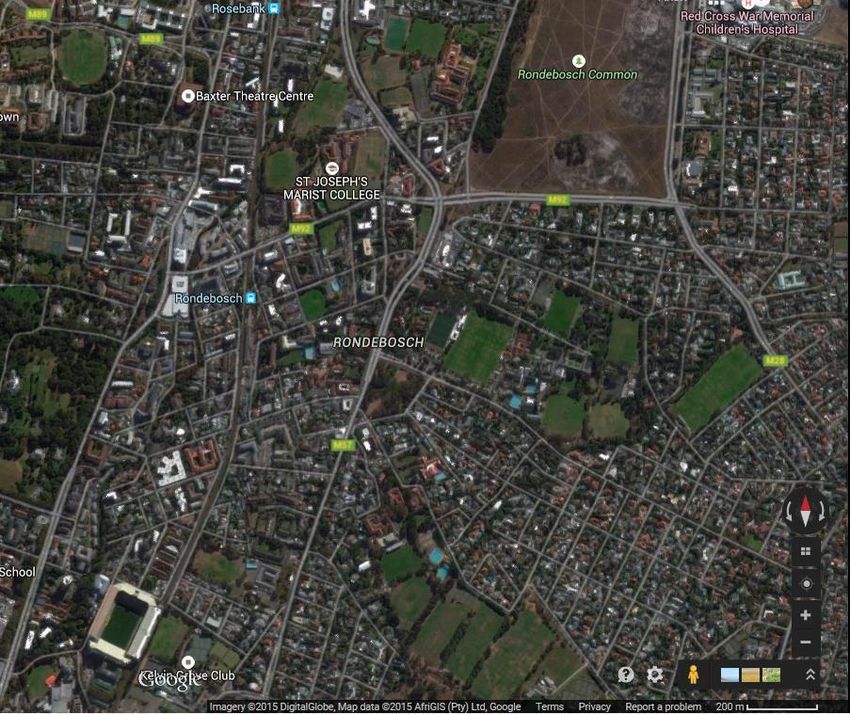
From here in Langa… …to here in RondeboschTransport Options Langa
• Train
• Taxi’s
• Bus Schools
10KM Community
Health Centre
25KM
Population = 52 401
Households = 17400 Closest Employment
40% Completed School Opportunities
40% Unemployed • Epping Industrial
42% Live in Informal Settlements • CBD
33% No Piped Water
28% No Flushing ToiletsPopulation = 19554
Households = 6990
Rondebosch
92% Completed School
5% Unemployed Schools
1% Live in Informal Housing
1% No Piped Water
1% No Flushing Toilets
Closest
Employment
Opportunities
Clinics • Mall
Transport Options • Shops
• Train • Stadium
• Bus • CBD
• Various
• CarsFrom outside to Inside Toilets In Langa… …to Rondebosch
Two views of Table Mountain

                        To Social rental in
From Langa..            Rondebosch
Dilapidated
Brazil’s Favelas: apartments in Russia
HOUSING SITUATION AMONGST OUR
BRICS PARTNERS
Social housing in China
INDIA’S
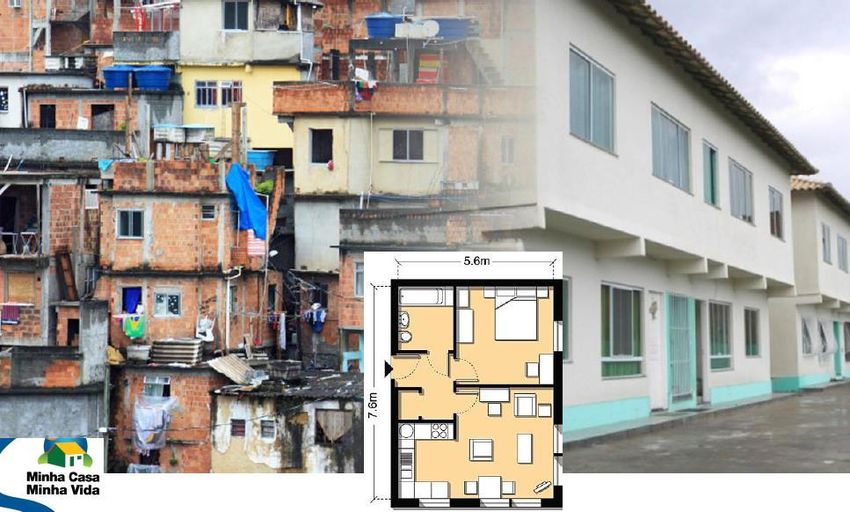
HOUSELESSBrazil’s Housing Shortage
Housing Characteristics
• 74% of Brazil’s households are Owner Occupied, 17% Renter
Occupied, 7% Occupied Rent Free
Backlog
• Varied estimates of Brazil’s Housing Shortage, due to inconsistencies in
Favela data collection
• In 2009 - Joao Pinheiro Foundation
• estimated a deficit of 7.2million units if the favela’s are excluded.
• Estimated a deficit of 30 million units if favela’s are included
• In 2009 – Caixa Econonimca Federal Study
• Estimated a deficit of 9 million units
• In 2011, Sao Paulo State Construction Industry Union using IGBE data
• Estimated a deficit of 5.46million units
• It is estimated 90% of the Housing Deficit (Excluding Favelas) lie in the
low income space
• IGBE Study indicates that 50% of Households in Favela’s lie in Middle
Class, 4.5% live in Upper Class
• 85% of the Deficit are in Urban Areas
• 42% of the Deficit live in congested households, 35% experience
excessive expenditure + rent, 18% live in precarious housingBrazil’s Housing Policy
• 2009 -Minha Casa, Minha Vida 2009 (My Home, My Life)
• Stimulate Production and acquisition of new housing units for low
income population
• Mobilizes the private sector to contribute
• Allocates subsidy finance
• Guided by data on the housing deficit when building new housing units
• Aims to promote economic growth in low-income households – creating
jobs in the construction sector
• Supports wide range of incomes
• Prioritises low income households – receive a substantial increase in the subsidy
amount
• Also offers housing alternatives to Middle Income Households
• Program includes Social Oriented Housing options
• Offers a special credit line for organisations involved in social housing (i.e. Housing
cooperatives & community based organisations)
• Are lessons to be learnt for SA in BrazilMinha Casa, Minha Vida – The Vision
Russian Housing Shortage
• From 2000 – 2012
   • Private ownership increased from 65% to 87% of all dwellings
• Housing provision and backlog is measured in square
  meterage per person
   • In 2006
       • 93 million square meters (3% of total housing) were in dilapidated houses
       • 11.2million sq m below safety standards
       • Challenge of maintenance

• Residential Mortgage market now worth USD1.8 billion+
  (1% of GDP)
Russian Housing Policy
• Soviet Era
• The State owned up to 90% of the Housing Stock in Urban Areas
• Rent and housing costs were nominal and heavily subsidised
• Housing was allocated according to “sanitary norms” that regulated the living space per
person
• No concept of mortgages
• Post Soviet Era
• State owned properties were transferred to the residents of the property
• Privatisation lead to development of large condominiums
• Introduced mortgage financing, mortgage agencies, securitisation
• Launched the ‘Affordable Housing’ Project devolved to the municipalities
• 2006 Housing Code - Government no longer managed maintenance and repairs of Social
Housing Projects
• Faced with burden of 40-50 years worth of repairs
• Question of who is responsible for maintenance
• Side Effects
• 50% of homes require maintenance – population living in aging homes
• Only 10 – 15 % of Russians can afford the mortgages
• Experiencing low level of debt securitisation
• New households are struggling to find accommodationRussian Goal – Well maintained, adequate
housingIndian Housing Shortage
• 69% of Urban Housing is owned, 94% of Rural Housing is Owned in 2011
• Indian Standards of Acceptable Housing differ to rest of BRICS
• 91% of Urban Households live in an Acceptable building
• Urban Housing shortage (2001) – calculated at 10.5 mill households
• 1.9mill Houseless People in 2001
• 1.1 mill in Urban areas
• 0.8 mill in Rural areasHousing Shortage in China
• Deficit of 40 million units out of 361 million households
• Rural percentage have decreased consistently from 1990
• 1990 – 74%
• 2001 – 64%
• 2008 – 46
• In 2010 - Out of 700 million urban residents, 260 million are
rural immigrants
• Internal Migration is a driver of the housing backlog
• 8 million new families enter the market each year
• 28 million people in shanty towns
• 2010 – 17% of urban households lived with ‘housing difficulty’
• Have less than 13square metres living space per person
• General lack of data for housing estimation needs
• Is a need for low rent housing programmes. MODELLING
Cost Benefit Analysis(CBA) methodology This research employs a CBA called Internal Rate of Return (IRR) model which provides an economic decision making tool to assess whether affordable rental housing contribute to the increased and improved return on investments or not Adopted from the Australian Housing and Urban research model Three big cities of South Africa such as Johannesburg, Cape Town and Durban are used as focus cases of cost benefit analysis of the research Internal Rate of Return: Internal Rate of Return Taxation:
Estimating the Housing Backlog Per
                  Metro
• Identify the target population
   • Income Gap (R3200 – R12800)
   • Informal Housing (as per the Stats SA)
• Define the cost of Affordable Social Housing to meet the
  need
• Housing Backlog = Cost X Target Population
Target Population Per Metro
Population of Housing Gap Market
• Income Categories
50,000.00 14.0%
• Annual HH Income ÷ 12 40,000.00
12.0%
10.0%
• R 38 201 - R 153800 ~ 30,000.00 8.0%
R3183 – R12816 per 20,000.00 6.0%
4.0%
month 10,000.00
2.0%
- 0.0%
Gap Gap Gap
• Type of Dwelling Cape Town eThekwini Johannesburg
• Informal dwelling (shack; Amount Percent
in backyard)
Progression and Growth of the Housing Gap Market
• Informal dwelling (shack;
60000
not in backyard; e.g. in an
50000
informal/squatter
40000
settlement or on a farm)
30000
• Caravan/tent
20000
10000
0
2011 2012 2013 2014 2015 2016 2017 2018 2019 2020 2021
Johannesburg Cape Town DurbanSize of the Backlog
Value of the Backlog over time
• Backlog based on Population 12,000,000,000
figures from Census + Mid Year 10,000,000,000
Estimates to calculate the gaps 8,000,000,000
• Backlog = Cost X Target 6,000,000,000
Population 4,000,000,000
• Costs of Housing based on SHRA 2,000,000,000
Budget and number of units 0
2011 2012 2013 2014 2015 2016 2017 2018 2019 2020 2021
delivered
Johannesburg Cape Town Durban
• Value of Backlog at 2011 Costs per Unit
• DBN = R2 204 594 409 250000
200000
150000
• CPT = R 4 868 405 160 100000
• JHB = R5 752 853 160 50000
0
2011 2012 2013 2014 2015 2016 2017 2018 2019 2020 2021
Johannesburg Cape Town DurbanCalculate the Rate of Return Per Metro • Given the size of the Target Population and Housing Backlog • Calculate the time frame for Affordable Social Housing Project to generate profitable returns given a particular size of investment • IRR Model’s Relevant Variables are: • R1, R2…Rn = Future stream of rent Income • C1, C2…Cn = operating costs • r = Discount rate • Y=The marginal income tax rate • Inflation (factored into pricing of rent and Cost)
Model Scenarios 1: Rate of Return
Input Values N
( Rt Ct )
•
•
Rent CPT= (R3 250*12)= R39 000
Cost CPT= 12 175
t 1 (1 r )
t
Vo 0
• Discount Rate=0.001
• Inflation Rate=0.05
• 5 Years to Produce Profits
Cape Town - Rate of Return - Scenario 1
14,000,000,000
12,000,000,000
10,000,000,000
8,000,000,000
6,000,000,000
4,000,000,000
2,000,000,000
-
2011 2012 2013 2014 2015 2016 2017 2018 2019 2020 2021 2022 2023 2024 2025
(2,000,000,000)
Gross Return Return - Investment Net ProfitInternal Rate of Return: Johannesburg
( Rt Ct )
N
•
•
Rent JHB= (R2 500*12)= R30 000
Cost JHB= 12 175
t 1 (1 r )
t
Vo 0
• Discount Rate=0.001
• Inflation Rate=0.05
• 6 Years to Produce Profits
Johannesburg Rate of Return - Scenario 1
14,000,000,000
12,000,000,000
10,000,000,000
8,000,000,000
6,000,000,000
4,000,000,000
2,000,000,000
-
2011 2012 2013 2014 2015 2016 2017 2018 2019 2020 2021 2022 2023 2024 2025
(2,000,000,000)
Gross Return Return - Investment Net ProfitScenario 1: Internal Rate of Return:
Durban N
( Rt Ct )
•
•
Rent DBN= (R=1 900*12)=R22 800
Cost DBN=12 175
t 1 (1 r )
t
Vo 0
• Discount Rate=0.001
• Inflation Rate=0.05
• 3 Years to Produce Profits
Durban Rate of Return (Scenario 1)
6,000,000,000
5,000,000,000
4,000,000,000
3,000,000,000
2,000,000,000
1,000,000,000
-
2011 2012 2013 2014 2015 2016 2017 2018 2019 2020 2021 2022 2023 2024 2025
(1,000,000,000)
Gross Return Return - Investment Net ProfitModel Scenarios 2: Internal Rate of Return
Scenario 1 including marginal Taxation
N
t 1
( Rt Ct )(1 )
(1 r ) t
V0 0
rate of taxation (Y= 0.28), then:
Johannesburg Rate of Return (Including
Cape Town - Rate of Return (Including Marginal Marginal Tax) - Scenario 2
Tax) - Scenario 2 10,000,000,000
10,000,000,000.00
8,000,000,000
8,000,000,000.00
6,000,000,000.00 6,000,000,000
4,000,000,000.00 4,000,000,000
2,000,000,000.00
2,000,000,000
-
2011
2012
2013
2014
2015
2016
2017
2018
2019
2020
2021
2022
2023
2024
2025
-
Gross Return Return - Investment Net Profit (2,000,000,000)
Gross Return Return - Investment Net Profit
Durban Rate of Return (include Marginal Tax) - Scenario
2
4,000,000,000
3,500,000,000
3,000,000,000
2,500,000,000
2,000,000,000
1,500,000,000
1,000,000,000
500,000,000
-
2011 2012 2013 2014 2015 2016 2017 2018 2019 2020 2021 2022 2023 2024 2025
(500,000,000)
Gross Return Return - Investment Net ProfitConclusions and future assessments The Gap Market is wholly underserved in South Africa Provision of Housing and access to services is too slow o Backlog remains consistent o Need alternate means of Housing Provision (with Private Sector) The profitability of an investment in affordable rental housing can be calculated with the use of Cost benefit analysis techniques such as IRR we believe it is possible for the private investors to join and provide indication of different ways in which additional resources that can be levered into affordable rental housing to work with the private sector subsidies for affordable housing Various revisions to Rates of Returns possible with greater data
From backyard Private rental to Subsidized
                    Rental

From here in Langa…     …to here in Rondebosch
Thank You Jaya Josie – jjosie@hsrc.ac.za Krish Chetty – kchetty@hsrc.ac.za Nozibele Gcora – ngcora@hsrc.ac.za
You can also read