FY 2018 ROADSHOW PRESENTATION - February 2019 - Airbus

Page created by Isaac Lang
 
CONTINUE READING
FY 2018 ROADSHOW PRESENTATION - February 2019 - Airbus
FY 2018
ROADSHOW
PRESENTATION

February 2019
FY 2018 ROADSHOW PRESENTATION - February 2019 - Airbus
SAFE HARBOUR STATEMENT

  DISCLAIMER
  This presentation includes forward-looking statements. Words such as “anticipates”, “believes”, “estimates”, “expects”, “intends”, “plans”, “projects”, “may” and similar
  expressions are used to identify these forward-looking statements. Examples of forward-looking statements include statements made about strategy, ramp-up and
  delivery schedules, introduction of new products and services and market expectations, as well as statements regarding future performance and outlook. By their nature,
  forward-looking statements involve risk and uncertainty because they relate to future events and circumstances and there are many factors that could cause actual
  results and developments to differ materially from those expressed or implied by these forward-looking statements.
  These factors include but are not limited to:
   Changes in general economic, political or market conditions, including the cyclical nature of some of Airbus’ businesses;
   Significant disruptions in air travel (including as a result of terrorist attacks);
   Currency exchange rate fluctuations, in particular between the Euro and the U.S. dollar;
   The successful execution of internal performance plans, including cost reduction and productivity efforts;
   Product performance risks, as well as programme development and management risks;
   Customer, supplier and subcontractor performance or contract negotiations, including financing issues;
   Competition and consolidation in the aerospace and defence industry;
   Significant collective bargaining labour disputes;
   The outcome of political and legal processes including the availability of government financing for certain programmes and the size of defence and space procurement
    budgets;
   Research and development costs in connection with new products;
   Legal, financial and governmental risks related to international transactions;
   Legal and investigatory proceedings and other economic, political and technological risks and uncertainties.
  As a result, Airbus’ actual results may differ materially from the plans, goals and expectations set forth in such forward-looking statements.
  For a discussion of factors that could cause future results to differ from such forward-looking statements, see the Airbus “Registration Document” dated 28 March 2018,
  including the Risk Factors section.
  Any forward-looking statement contained in this presentation speaks as of the date of this presentation. Airbus undertakes no obligation to publicly revise or update
  any forward-looking statements in light of new information, future events or otherwise.
  Rounding disclaimer:
  Due to rounding, numbers presented may not add up precisely to the totals provided and percentages may not precisely reflect the absolute figures.
  IFRS 15 Disclaimer:
  The Company has adopted the IFRS 15 standard as of 1st January 2018. 2017 figures are pro forma, amended with IFRS15 restatements and new segment reporting.
FY 2018 ROADSHOW PRESENTATION - February 2019 - Airbus
3

FY 2018 HIGHLIGHTS

    Strong 2018 performance, Guidance delivered

    A380 deliveries cease in 2021

    A400M re-baselining negotiated

    Dividend proposal: € 1.65 / share, +10% vs. FY 2017

    2019 Guidance confirms growth trajectory
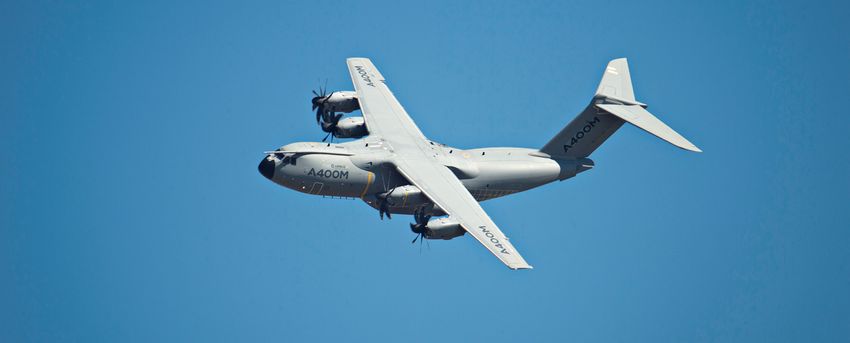
FY 2018 ROADSHOW PRESENTATION - February 2019 - Airbus
4

AIRBUS AT A GLANCE – AS OF FY18
                                                                                   Deliveries by Programme
                                         Airbus                                              (units)

                                                                                                             A320 78%
  Consolidated Airbus                                     Passenger Aircraft,                                A350 12%
   External Revenue by Division                           Freighter Conversion,                              A330       6%
                                                                Services
                                                                                                             A220       3%
                                                                                                             A380       2%

                                       Helicopters                                 External Revenue Split

         € 63.7 bn                                                                                           Platforms
                                                        Civil / Parapublic and                               59%
       t/o defence € 9.9 bn
                                                         Military Helicopters
                                                          for a wide range of                                Services
                                                        missions, Support and                                41%
                                                                Services

                                                                                   External Revenue Split
       Airbus                 74%
       Helicopters             9%
                                    Defence and Space
       Defence and Space      17%                                                                            Platforms
                                                                                                             70%
                                                        Military Aircraft, Space
                                                           Systems, Comms,                                   Services
                                                             Intelligence and                                30%
                                                         Security, Unmanned
                                                              Aerial Systems
FY 2018 ROADSHOW PRESENTATION - February 2019 - Airbus
5

COMMERCIAL POSITIONING – AS OF FY18
               Airbus Commercial Aircraft                                          Consolidated Airbus
                   Order Book in units by Programme                                  Order Book in value by Region

                           7,577 units                                                        € 460 bn
                              t/o A220                                                        t/o defence
                              480 units                                                         € 39 bn

                  A320      80%      A330        4%                           Asia Pacific     30%       Middle East     8%
                  A350        9%     A380        1%                           Europe           28%       Latin America   6%
                  A220        6%                                              North America    19%       Other           9%

                  Order Book units reflect contractual view. Order Book value measured under IFRS 15 reflects
                  assessment of recoverability and net transaction price, including engines

 AIRBUS: Gross orders: 831 a/c; net orders: 747 a/c, incl. 40 A350, 27 A330 and 135 A220; Backlog: 7,577 a/c
 HELICOPTERS: Net book to bill > 1; 381 net orders including 15 H160, 51 Lakota LUH, 29 NH90, 8 H215M, and 4 H225M
 DEFENCE AND SPACE: Net book to bill of ~0.8. Key contract wins include EF Qatar, 4 MRTTs, Heron TP drones for
 Germany, 2 satellites and first contract for Ariane 6 signed with Eutelsat
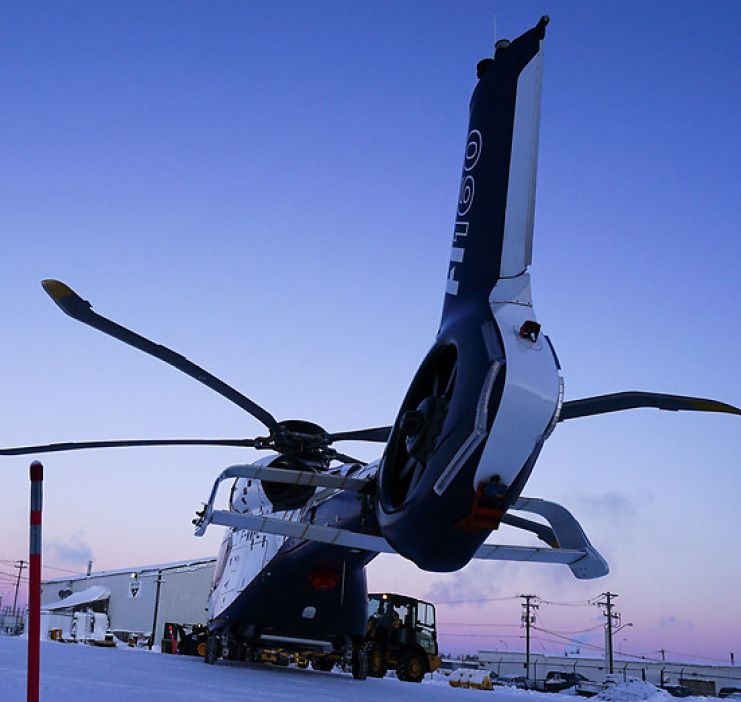
FY 2018 ROADSHOW PRESENTATION - February 2019 - Airbus
FY 2018
               Market   Product       FY18
               Demand   Positioning   Review
ROADSHOW
PRESENTATION
FY 2018 ROADSHOW PRESENTATION - February 2019 - Airbus
7

WORLD FLEET TO DOUBLE OVER NEXT 20 YEARS

                                  4.4%                             26,540
                                   annual
                                                                       Grow
                                   growth                                                                               37,390
                                                                                                                        Deliveries

                                                                   10,850
                              21,450                                Replace
                                 Fleet in
                                 service                           10,600                                                 ~37k
                                                                        Stay                                     New deliveries
                                   2018                                                        2037
  Continued healthy traffic growth in 2018: RPK growth +6.7%, Record Load Factor 82%, +260 million passengers
  Notes: Passenger aircraft (≥ 100 seats) | Jet freight aircraft (>10 tons), Rounded figures to the nearest 10 – Assuming same rules as today
  Source: Airbus GMF 2018
  Box sizes for illustrative purposes only
FY 2018 ROADSHOW PRESENTATION - February 2019 - Airbus
8

LONG-TERM GROWTH FUELLED BY MIDDLE-CLASS EXPANSION
IN EMERGING ECONOMIES
  2017 Trips per capita - Bubble size proportional to population
                                                                                                  Advanced
 10                                                                                               Developing
                                                                                                  Emerging

  1
       0                  10                   20                   30     40   50   60      70                  80

                                                                                          2017 real GDP per capita*

 0.1

0.01

       Source: Sabre, IHS Economics, Airbus GMF 2018
       Equivalent amount of passengers flying from/to/within the country
       * 2010 $US at Purchasing Power Parity
FY 2018 ROADSHOW PRESENTATION - February 2019 - Airbus
FY 2018
               Market   Product       FY18
               Demand   Positioning   Review
ROADSHOW
PRESENTATION
FY 2018 ROADSHOW PRESENTATION - February 2019 - Airbus
10

COMPETITIVE AIRCRAFT PORTFOLIO UNDERPINS RECORD
BACKLOG
                                                 Solid and well diversified Backlog*
                                                           7,577 aircraft

                                                                  Europe
                                          North                    & CIS
                                         America

                                                                           Middle-East
                                                                                          Asia
                                                                                         Pacific

                                                                  Africa

                                                       Latin
                                                      America

          % Backlog as of end December 2018                                                        Lessors
          % Share of 2018-2037 PAX deliveries (GMF 2018)

                                                  Airbus backlog* aligned with
                                              regional needs and demand forecast
  * Commercial aircraft
  8% of undisclosed customers
11

     STEADY RAMP-UP IN A HEALTHY COMMERCIAL ENVIRONMENT

         Backlog                                                                                                                           O&D

          8,000                                                                                                                            1,600

          7,000                                                                                                                            1,400

          6,000                                                                                                                            1,200

          5,000                                                                                                                            1,000

          4,000                                                                                                                            800
                                                                                                                                    800
          3,000                                                                                                        688   718           600
                                                                                      588       626    629    635
          2,000                                             498      510    534                                                            400
                                  434      453    483
                           378
          1,000     320                                                                                                                    200

               0                                                                                                                           0
                    2004   2005   2006     2007   2008      2009     2010   2011      2012      2013   2014   2015    2016   2016   2018

Book-to-bill         1.1    2.8    1.8      3.0       1.6    0.5      1.1   2.7       1.4       2.4    2.3     1.7     1.1   1.5    0.9

Cancellations (%)    0.3    2.6    1.3      3.4       3.3    1.1      2.0   4.3       1.7       1.5    3.8     0.9     2.1   1.7    1.1

                                            Backlog            Deliveries          Net orders          Average net order

                                         Growing backlog while ramping-up deliveries
                                                 to meet customer demand
12

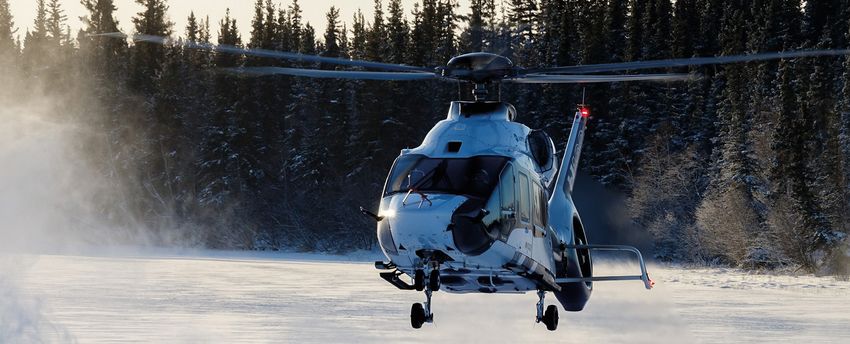
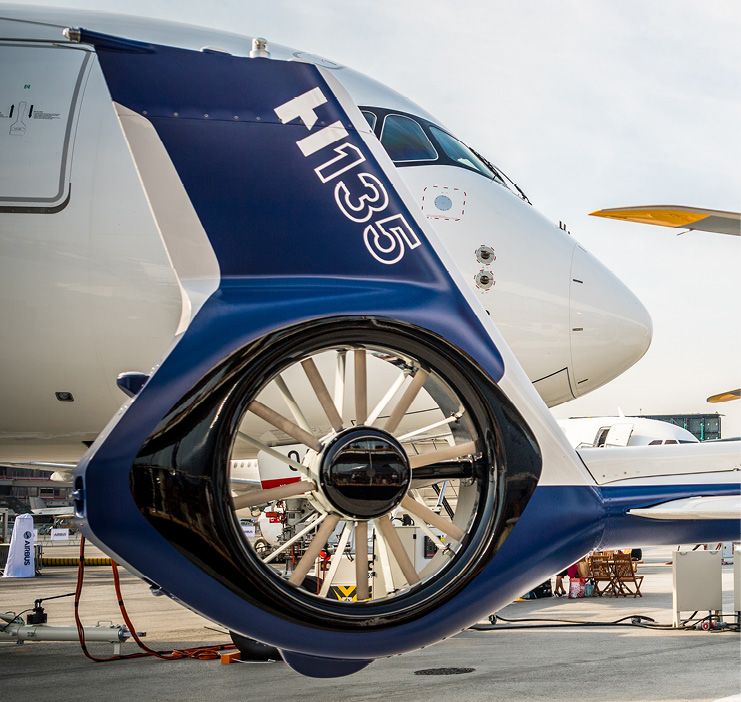
HELICOPTERS: MARKET AND PRODUCT POSITIONING
                 CIVIL & PARAPUBLIC                                     MILITARY AIRCRAFT

          Demand impacted by softness in O&G                    Military market supported by growing Defence
MARKET

                                                                budgets
          LT market potential: ~ 22k new h/c in next 20 years
                                                                Successful campaigns in 2018
          UAM new market

          Product renewal strategy: H135, H145, H160,           Unique product offering addressing wide range
PRODUCT

          H175                                                  of missions and classes
          Wide mission coverage                                 Military offers based on proven Civil technology

            Renewed product portfolio and global market presence
13

DEFENCE AND SPACE: MARKET AND PRODUCT POSITIONING
            MILITARY AIRCRAFT                        SPACE SYSTEMS                      CIS / UAS / OTHERS

          Geopolitical instability               Growth in space spending             Big data / analytics / digital
MARKET

          Growth in defence spending             More connected world                 Cyber protection
          Increasing need for security           Increasing need for services         Increasing need for autonomy and
                                                                                      reactivity

                                                                                      Cyber Protection
                                                 Telecom satellites, ENS
          Multi-mission military aircraft
PRODUCT

                                                                                      (Stormshield, 3 Cyber Defence Centres)
                                                 OneWeb (small satellites)
          Integrated combat systems                                                   Digital services and secured connectivity
                                                 Space services                       (HAPS)
          Services around platforms
                                                 (SpaceTug - Space Utility Vehicle)
                                                                                      Unmanned Aerial Systems
                                                                                      (Airbus Aerial, European MALE)

                                             Successful repositioning
                                            through portfolio reshaping
14

LEVERAGING DIGITAL IN ALL AREAS OF OUR BUSINESS

      Skywise             Data exploitation              Connectivity

                Driving further industrial efficiency

                Improving reliability of assets in use
                for customer benefit

                Generating new business opportunities
FY 2018
               Market   Product       FY18
               Demand   Positioning   Review
ROADSHOW
PRESENTATION
16

KEY PROGRAMME UPDATE
                    • Programme now fully consolidated and integrated into Airbus since July 1st 2018
            A220    • Good commercial momentum: 135 orders since July 2018. FY18 Backlog: 480 aircraft
                    • Focus on commercial momentum, production ramp-up and cost reduction

                    • Backlog of 6,000+ aircraft supports our ramp-up plans to rate 60 by mid-year and
                      beyond as we target rate 63 in 2021
            A320    • First A321ACF and first A321LR delivered in 2018
                    • ACF deliveries will increase in 2019, ramp-up remains challenging

                    • Successful A330neo EIS with TAP – 3 A330neo delivered in 2018
                    • A330-800 achieved First flight in Q4’18
            A330    • A330neo ramp-up continuing in 2018 – working closely with engine partner to deliver
                      in line with customer commitment

                    • Reached Rate 10 in Q4’18: 93 deliveries in 2018, incl. 14 A350-1000. OR>99%
            A350    • Backlog supports rate 10 going forward, including latest commercial discussions
                    • A350 breakeven in 2019 – improving margins beyond

                    • A380 deliveries cease in 2021
            A380    • 8 deliveries in 2019, 7 in 2020 and the remaining 2 in 2021

                    • A400M Re-baselining negotiated
                    • Update of contract estimate at completion triggered a net additional charge of € 436 m
            A400M   • 17 aircraft delivered in FY18 – development and retrofit activities progressing in line
                      with agreed roadmap
17

FY 2018 FINANCIAL PERFORMANCE
        Revenues                                                                         EBIT Adjusted
        in € bn                                                                          in € bn / RoS (%)
                                                                                                                       9.2%*

                                                                                                    5.4%
                      59.0                          63.7                                                                5.8
                                                                                                     3.2

                     FY 2017
                FY 2017 Restated                   FY 2018                                         FY 2017
                                                                                               FY 2017 Restated        FY 2018

                                                                                                                  * Airbus RoS 10%

        EPS(1) Adjusted                                                                  FCF before M&A and Customer Financing
        in €                                                                             in € bn

                                                   5.22                                              2.9                2.9

                      2.67

                FY 2017 Restated
                    FY 2017                        FY 2018                                     FY 2017 Restated
                                                                                                   FY 2017             FY 2018

  (1) FY 2018 Average number of shares: 775,167,941 compared to 773,772,702 in FY 2017
  Capitalised R&D: € 91 m in FY 2018 and € 219 m in FY 2017
  2018 figures include A220, consolidated into Airbus as of July 1st 2018
  2017 figures are amended with IFRS15 restatements
18

FY 2018 PROFITABILITY

  EBIT Performance
  in € bn                                                                                FY 2018 EBIT Reported of € 5.0 bn

                                                                                         FY 2018 EBIT Adjustments resulting from:
                                                                                            €   –   463   m   A380
                     5.8
                                                  5.0
                                                                                            €   –   436   m   A400M provision
          3.2                         2.7                                                   €   –   123   m   Compliance costs
                                                                                            €   +   188   m   M&A
          EBIT Adjusted                EBIT Reported
                                                                                            €   +   129   m   PDP mismatch / BS revaluation
                 FY 2017 Restated       FY 2018
                                                                                            €   –    81   m   Others
                                                                                         FY 2018 Net Adjustments of € – 786 m
  EPS(1) Performance
  in €

                                                                                         FY 2018 Net Income of € 3.1 bn

                    5.22
                                                                                         FY 2018 Finance Result adjustments of € – 0.5 bn
                                                  3.94
         2.67                         3.05
                                                                                         FY 2018 Net Income Adjusted of € 4.0 bn
          EPS Adjusted                 EPS Reported
                                                                                         FY 2018 tax rate on core business is 26%
                 FY 2017 Restated       FY 2018

  (1) FY 2018 Average number of shares: 775,167,941 compared to 773,772,702 in FY 2017
  Capitalised R&D: € 91 m in FY 2018 and € 219 m in FY 2017
  2018 figures include A220, consolidated into Airbus as of July 1st 2018
  2017 figures are amended with IFRS15 restatements
19

CURRENCY HEDGE POLICY
  IN $ BILLION                                                                                                                                     Forward Sales as of December 2018
                                                               1.9
                                                                                                                                                   Collars as of December 2018
                                                                                        4.6
                                                                                                                                                   Forward Sales and Collars as of Dec. 2017

                                                                                                                  1.7

                                    25.4                      25.7
                                                                                        22.2
                                                                                                                  17.0

                                                                                                                                            7.6

                                                                                                                                                                 1.3
     Average hedge                    2018                      2019                      2020                      2021                      2022                  2023
         rates                                                                                                                                                   and beyond

  € vs $                               1.24                      1.23                      1.23                      1.24                      1.27                  1.30
  Forwards/Collars   (2)         ( 1.25 in Dec. 17 )       ( 1.24 in Dec. 17 )       ( 1.22 in Dec. 17 )       ( 1.23 in Dec. 17 )       ( 1.24 in Dec. 17 )   ( 1.32 in Dec. 17)

 £ vs $                                1.52                      1.45                      1.37                      1.36                      1.35                  1.40

                                                                                                                                        Mark-to-market value incl. in AOCI = € - 1.6 bn
                                                                                                                                                           Closing rate @ 1.15 € vs. $

     In FY 2018, $ 19.0 bn(1) of new Forwards were added at an average rate of € 1 = $ 1.25

     $ 25.4 bn(1) of hedges matured at an average rate of € 1 = $ 1.24

     Hedge portfolio(1) 31 December 2018 at $ 81.9 bn (vs. $ 88.7 bn in Dec. 2017), at an average rate of $ 1.24(2)

  2018 figures include A220, consolidated into Airbus as of July 1st 2018
  Approximately 60% of Airbus US$ revenues are naturally hedged by US$ procurement. Graph shows US$ Forward Sales and Collars
  (1) Total hedge amount contains $/€ and $/£ designated hedges; (2) Blended Forwards and Collars rate includes Collars at least favourable rate
20

FY 2018 CASH EVOLUTION
IN € BILLION
                              +5.5

                                                         -0.6                                              +0.5

                                                                                  -1.9
                                                                                                                              -1.2

                                                                                                                                            -2.4

                          Free Cash Flow incl. A220 before M&A : € 3.0 bn
                                  t/o Customer Financing: € 0.1 bn

     13.4                             Free Cash Flow before M&A and                                                                                      13.3
                                        Customer Financing € 2.9 bn

   Net Cash            Gross Cash Flow             Change in                Cash used for                   M&A(2)         Shareholder   Pensions &     Net Cash
    position           from Operations           Working Capital               investing                                     Return        Others (3)    position
   Dec. 2017                                                               activities before                                                            Dec. 2018
                                                                                 M&A(1)

        A220 impact on FCF: ~ € -0.2 bn, net cash impact limited after funding agreement

    2018 figures include A220, consolidated into Airbus as of July 1st 2018
    (1) Thereof Capex of -2.3 bn; (2) M&A transactions include acquisitions and disposals of subsidiaries and businesses
    (3) Including C-Series A/C Ltd. Partnership (C-SALP) funding agreement
21

2019 GUIDANCE AND DIVIDEND PROPOSAL
 As the basis for its 2019 guidance, Airbus expects the world economy and air traffic to grow in line
 with prevailing independent forecasts, which assume no major disruptions
 Airbus 2019 Earnings and FCF guidance is before M&A

      Airbus targets 880 to 890 commercial aircraft deliveries in 2019

      On that basis:
      Airbus expects to deliver an increase in EBIT Adjusted of approximately +15% compared to 2018
      and FCF before M&A and Customer Financing of approximately € 4 bn

  2018 Dividend Proposal:

      Airbus proposes a dividend for 2018 of € 1.65 / share, +10% vs. FY 2017
22

KEY PRIORITIES

      Deliver on 2019 commitments

      Ramp-up A320

      Improve A350 margins

      Leverage military portfolio

      Services, Digital and Innovation

            Deliver Earnings and FCF growth potential
23

COMMITMENT TO CASH GENERATION & SHAREHOLDER
RETURNS
                                                                          2012 - 2018

        € 47 bn                                                           € 15 bn                                   € 9 bn
                                                                          FCF                                      Shareholder
      Investment                                                       generation(1)                                Return(2)

                                                                   Dividend per Share

                                                                                                            1.50     1.65
                                                          1.20                  1.30           1.35

              0.60                  0.75
                                                           40%                  38%            105%         40%       42%

               39%                  40%
                                                                                                      (3)
               2012                  2013                  2014                  2015          2016         2017      2018

                             Financial flexibility protected: Net Cash of € 13 bn
                                Increased liquidity: Gross Cash of € 22 bn(4)
  (1) incl. € 5 bn M&A
  (2) of which € 6 bn of Dividend and € 3 bn of Share Buyback. Before 2018 Dividend Proposal
  (3) Increased exceptionally to deliver sustained dividend growth per share
  (4) as of 31 Dec 2018
24

DELIVER EPS & FCF GROWTH POTENTIAL

                                   2018 - 2021

                 EPS                                     FCF                    Future Growth
               Growth                                  Growth                      Potential

            A320neo
                                                                                     A350
         Volume & Price                              EPS Growth
                                                                              Margin improvement

             A350
       Turning Profitable
                                                       A400M*
                                                                      2021+      A320 Higher
                                                                                 Rate potential
            Boost
        Competitiveness

                                                    Working Capital                Boost
        Investment in
                                                       Control                 Competitiveness
     Digital & Innovation

  * A400M will continue to weigh in 2019 and 2020
  Box sizes for illustration purpose only
You can also read