Cleantech markets in Germany: Energiewende and more - Thomas Grigoleit Director Energy, Environment and Ressources April 2015 - GTAI
←
→
Page content transcription
If your browser does not render page correctly, please read the page content below
©Chris Schmidt - istockphoto

                               Cleantech markets in Germany: Energiewende and more…

                               Thomas Grigoleit
                               Director Energy, Environment and Ressources

                               April 2015
                                                                              www.gtai.com |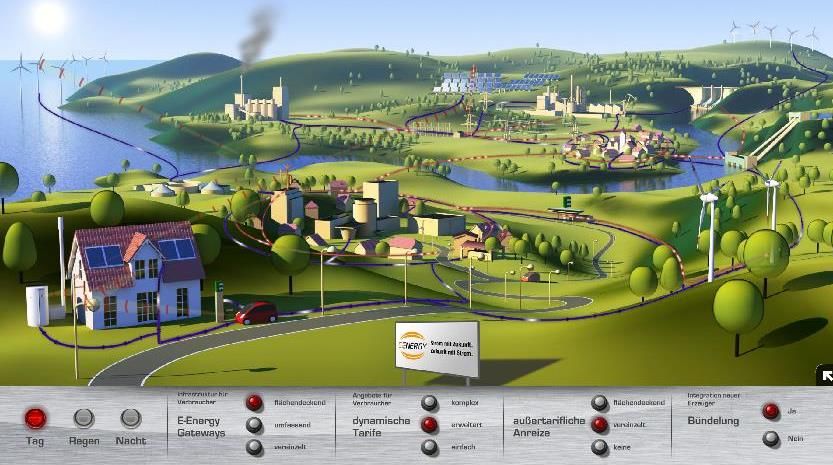
Germany Trade & Invest
Germany Trade & Invest (GTAI) is the official foreign trade and inward
investment promotion agency of the Federal Republic of Germany.

                                                                www.gtai.com |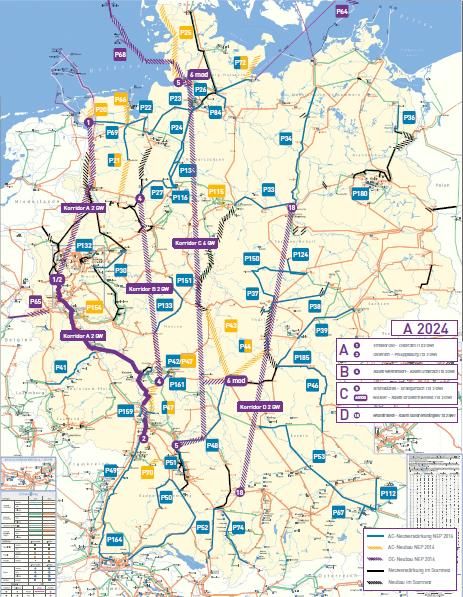
Agenda

 Cleantech Markets in Germany: Energiewende and more…

   a) From Generation to Integration

   b) Energy Efficiency

   c) Environmental Technologies

                                                        www.gtai.com |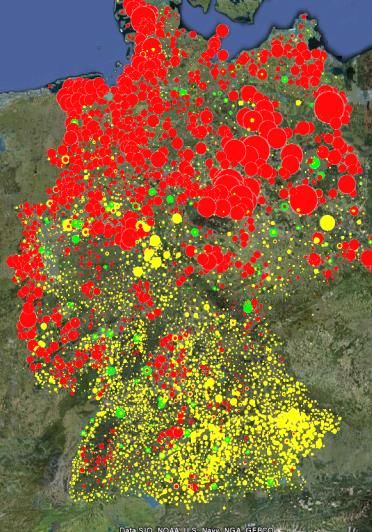
Renewables Energy Revolution

                              Total capacity of renewables
                                   2000)
                              (End 2005)
                                   2012)
                                   2010)

                                 ~~
                                  ~~ 30,000 installations
                                   1.300.000
                                    221,000
                                     750,000  installations
                                             installations
                                             installations

                                             Wind energy

                                             PV

                                             Biomass

                                    The circle diameter is proportional
                                         to the electrical capacity

                            Sources: 50HertzT, TenneT, Amprion, TransnetBW, internal data

22.05.2015 | www.gtai.com                                                            www.gtai.com |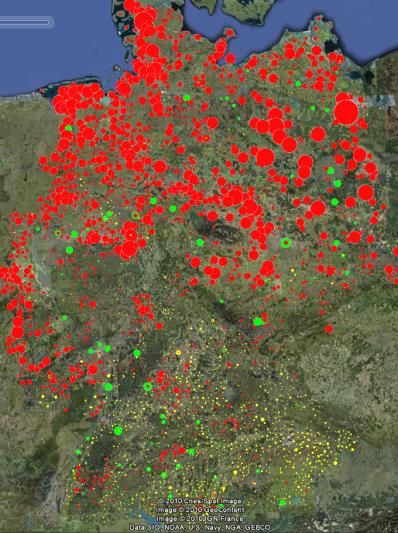
The Energy Concept (2010)
Main Objectives
 Climate protection measures            2020              2050

 GHG cuts vs. 1990                      -40%              -80%

 Renewable share of…                    2020 (2025)       2050
 Total energy consumption               18%               60%

 Electricity consumption                35%    (40-45%)   80%

 Heat generation                        14%               60%

 Energy efficiency measures
 Increase in energy productiveness      2.1% p.a.

 Reduction of energy consumption        -50% (2050 vs. 2008)

 Reduction of electricity consumption   -25% (2050 vs. 2008)

 Renovation rate                        2% p.a.

 Reduction of energy consumption for    -10% (2020 vs. 2005)
 transportation                         -40% (2050 vs. 2005)
                                                                 www.gtai.com |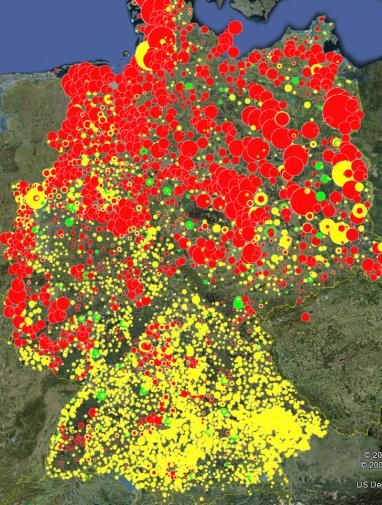
Germany‘s nuclear power phase-out
In 2012:
99 TWh electricty produced which accounts for
Due to the nuclear disaster in Fukushima in 16% of nuclear power!
2011, closure of nuclear power plants was
brought forward from 2036 to 2022 2021 Hamburg
8 out of 17 nuclear power plants were
already shut down in 2011 Berlin
2022
2011: 17.6% nuclear power of total energy
2021
consumption (2010: 22.6%)1
Cologne
Development of installed nuclear power plants
capacity in MW2
Frankfurt
25000
21.547 2015
20000
22.6 % of 2019
15000 2022
electricity
Stuttgart
10000 generation
(2010) 2017 2022
5000 4.285
0 2021 Munich
0
2010 2011 2012 2015 2019 2021 2022 2023
Active nuclear reactor with
date of scheduled closure
1) Quelle: BMWi „Die Energiewende in Deutschland“, Februar 2012
Nuclear reactor already closed
2) Quelle: DAtF, 2012
www.gtai.com |
www.gtai.com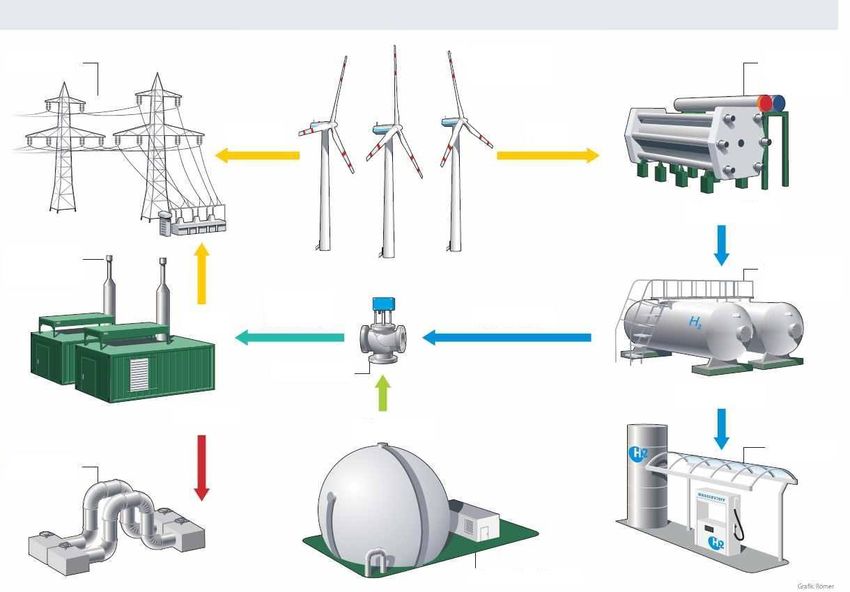
Energiewende in Germany

Future electricity mix in Germany will be based on Wind and PV

                                                         www.gtai.com |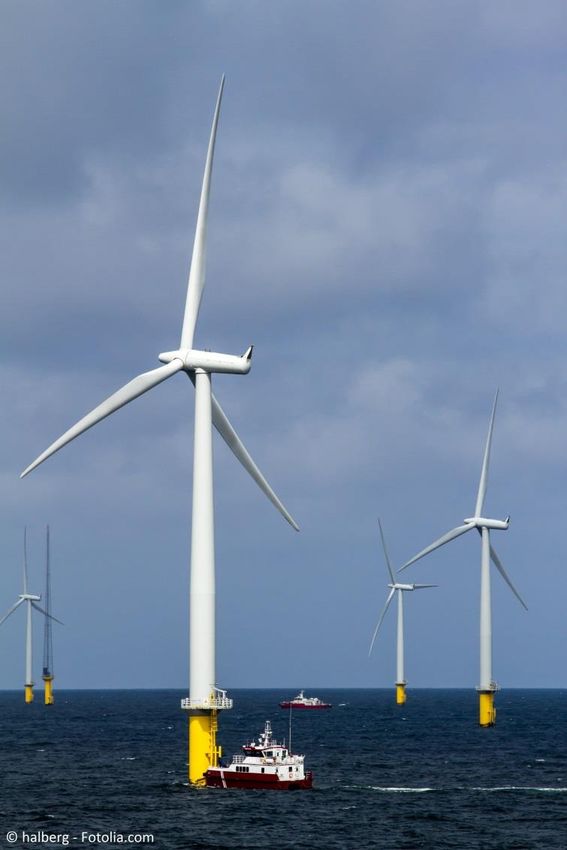
The German Wind Energy Market
   Germany's wind energy market in numbers

   Top 10 New Installed Capacity 20141)                                            Total installed wind power 20142)                      39,165 MW
                                                                                   Total installed wind turbines
                                                                                   onshore 20142)                                               24,867
           Rest of World 13%                            China 45.2%                Newly installed wind power
                                                                                   onshore 20142)                                           4,750 MW
  Turkey 1,6%
                                                                                   Market growth 2014                                            58%
  France 2%                                                                        Repowering share in new
Sweden 2%                                                                          onshore installation 20142)                              1,148 MW
 UK 3.4%                                                                           Total connected wind power
                                                                                   offshore 20142)                                          1,049 MW
Canada 3.6%
                                                                                   Newly installed offshore capacity
                                                                                   20142)                                                   1,218 MW
India 4.5%
                                                                                   Electricity generation 20133)                        53.4 bn kWh
  Brazil 4.8%
                                                                                   Employees in Germany 20124)                                 117,900

         USA 9.4%                                                                  Share of German electricity
                                                                                   demand 20145)                                                    10%
                           Germany 10.2%
   Sources: 1) GWEC 2015 2) Deutsche WindGuard 2014, 2015 3) DEWI/Deutsche Wind Guard /Arbeitsgruppe Energiebilanz, 2014; 4) Federal Ministry for the
      Environment, Nature Conservation and Nuclear Safety 2013 5) BDEW 2015

                                                                                                                                          www.gtai.com |
                                                                                                                                                    8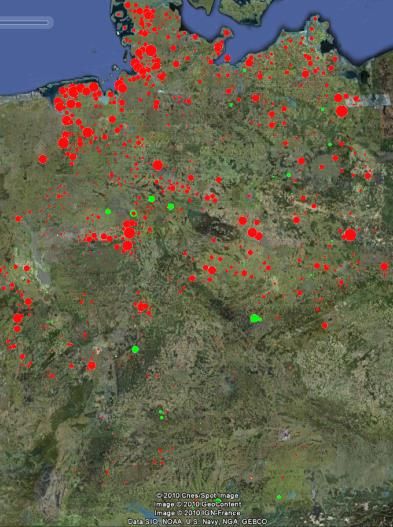
Current Status of Offshore Wind Developments

  Development of Offshore Wind in Germany

                            OWTs with Grid Connection - Annual Additions (left axis)
                            OWTs with Grid Connection - Cumulative Capacity (right axis)
  800                                                                                                  1200

  700
                                                                                                       1000
  600

                                                                                                       800
  500

  400                                                                                                  600

  300
                                                                                                       400
  200

                                                                                                       200
  100

     0                                                                                                 0
               2009          2010            2011            2012           2013           2014

Source: WindGuard 2015
22.05.2015 | www.gtai.com
                                                                                                  www.gtai.com |
                                                                                                        9
22 May 2015
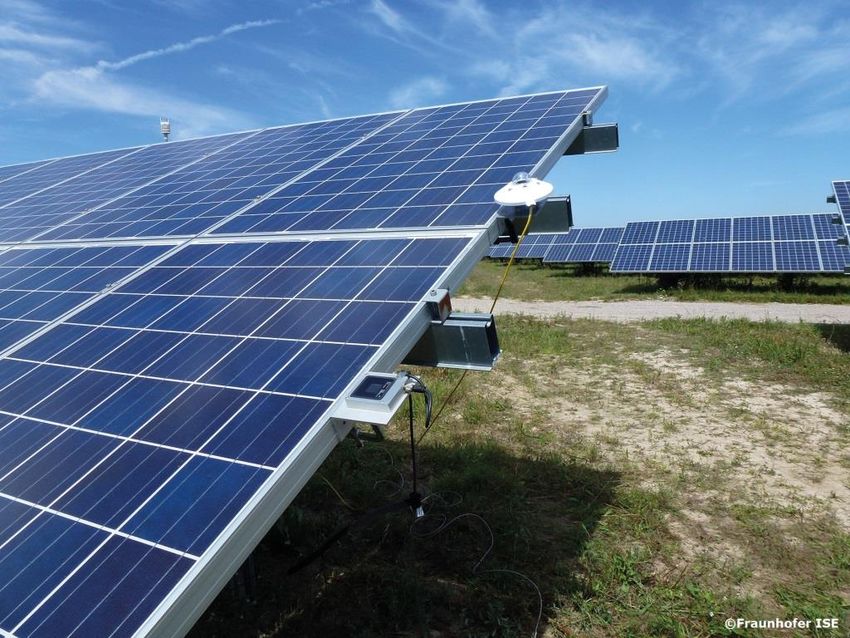
The German PV Market 2014

Germany is the largest PV market in Europe with the strongest private
customer segment

Estimated PV Installations 2014 [MWp1]                                        German PV Market 20142

                                                                              • Newly installed PV power                   1.9 GWp
                                  Germany
                     Rest of       1.900 Rest of                              • Number of newly installed PV systems         75,000
                     World
                                          Europe
                      7000
                                           6000
                                                                              • Total installed PV power                    38 GWp

          USA                                                                 • Total number of PV systems installed 1.5 Million
                             Total
          6000
                           ~ 42 GWp

                                                     China
                                                                              • PV electricity production                 35,2 TWh
                                                     12000
                                                                              • Share of final electricity consumption        6.1 %
                     Japan
                     9000
                                                                              • FIT commitment for                          52 GWp

Sources:
   1) Preliminary estimations by PV-Magazine, Solarserver, IHS, Bloomberg New Energy Finance
   2) Preliminary numbers from BDEW 2015, Federal Network Agency 2015, BMU 2015; Fraunhofer ISE 2015

                                                                                                                         www.gtai.com |
From Grid-Parity to Battery-Parity
With fruther increasing electricity prices and decreasing PV system costs,
the business case for storage is becoming better and better
0,55
Prognosis 4,90
4,70
0,50
4,50
4,30
0,45 4,10
3,90
0,40 3,70
3,50
0,35 3,30
EUR/kWh
3,10
0,30 2,90
2,70
0,25 2,50
2,30
2,10
0,20
1,90
1,70
0,15 1,50
1,30
0,10 1,10
0,90
0,05 0,70
2007 2008 2009 2010 2011 2012 2013 2014 2015 2016 2017 2018
Electricity price for households [2.5-5 MWh/a] Electricity costs for PV* Electricity costs for PV + Battery**
* Model calculation for rooftop systems, based on 802 kWh/kWp (Frankfurt/Main), 100% financing, 6% interest rate, 20 year term, 2% p.a. O&M costs
** based on 5,000 cycles , 87% efficiency
Sources: System Prices: BSW 2015; Model Calculation: Deutsche Bank 2010; Electricity Prices 2007-2013: Eurostat 2013.
www.gtai.com |Grid Parity = Competitiveness
Competitiveness of solar = new business opportunities!
Wattage
PV Energy
„Own-Consumption“
Energy from grid
of PV Energy
Energy Demand
Time of day
0h 3h 6h 9h 12h 15h 18h 21h 24h
Notes: 1) Depending on size /type of system; Min. to max . tariff in 2013 of new EEG 2012 2) Depending on electricity retail price of respective utility company.
7 october, 2014 www.gtai.com
www.gtai.com ||Market for storage and smart grid technologies
Punctual overcapacities in electricity production through fluctuating RES
Increasing volatility of electricity prices!
MW
MW €/MWh
€/MWh
60000
60000
50000
50000
40000
40000
30000
30000
20000
20000
10000
10000
00
00:00
00:00 02:00
02:00 04:00
04:00 06:00
06:00 08:00
08:00 10:00
10:00 12:00
12:00 14:00
14:00 16:00
16:00 18:00
18:00 20:00
20:00 22:00
22:00
Solar
Solar Wind
Wind Non-Fluctuating
Non-Fluctuating
Electricity generation in Germany June 16th 2013 @ ~34 GWp installed PV capacity
*Source: EEX 2013 (http://www.transparency.eex.com)
www.gtai.com |Example for critical grid situations: Eclipse 2015
Eclipse on March 20th had no effect on German‘s grid stability due to
excellent forecasting & compensation
Electricity production in Germany, week 12th 2015:* Eclipse on March
20th 2015
GW
PV Wind Non-fluctuating Net imports
*Source: ISE 2015 (http://www.energy-charts.de)
22.05.2015 | www.gtai.com
www.gtai.com |Ensuring grid stability in the future
Simulation of German grid in 2022: Daily & seasonal fluctuations increase
February (week 6th) April (week 14th)
GW
GW
August (week 33th) November (week 47th)
GW
GW
PV Wind Biomass Fossiles Electriciy demand
22.05.2015 | www.gtai.com
*Source: Agora Energiewende 2015 www.gtai.com |Large-scale batteries balancing the grid
Installed battery capacity in Germany for primary control provision
30
Aachen, Eon Energy Research Centre at
RWTH Aachen University (Li-ion, high-
28 temperature, lead-acid)
Dresden, Younicos & DREWAG (Li-ion) 5
26
24 Pellworm, EON & Schleswig-Holstein Netz
AG, Hybrid (Li-ion, Redox-flow) 2 2
22 Braderup, Bosch, Hybrid (Li-ion, Redox- 0,76 0.76
flow)
20 2.235
Feldheim, Energiequelle GmbH, Li-Ion
18
Schwerin, Younicos & Wemag, Li-Ion
16
14 Berlin, Younicos & Vattenfall, LiFePo 10 10
12
Berlin, Younicos & Vattenfall, Hybrid (Li-
Ion, NAS)
10
Völklingen-Fenne, Evonik, Li-Ion
8
5 5
6
4
2 2 2
2
1 1 1
1 1 1 1
0
2012 2013 2014 2015
Source: IEK-STE Database, Energiespeicher Jülich www.gtai.com |
16Hybrid Power Plant – Continuous Energy Supply
Enertrag Hybrid Power Plant – Sustainable and clean electricity & heat
Hydrogen
Grid Production via
Unused
Electrolysis
Electricity
(Produced at
Electricity Night)
Hydrogen
2 Cogeneration
Plants
Hydrogen
Storage
Electricity Variable Mixture Hydrogen
Mixing Valve
Hydrogen
Heat Biogas (from Corn)
Filling
District Station
Heating
Biogas Storage
Source: http://www.bi-bigben.de/elements/hybridkraftwerk1.jpg
22.05.2015 | www.gtai.com
www.gtai.com |Power to Gas pilot plant and H2 Filling Stations
www.gtai.com |
18Expansion of the electricity grid in Germany
An enormous expansion of the high voltage grid system is required by
2024.
Grid Expansion Distance in Km.
DC-New Construction 2,200
AC-New Construction 1,300
DC/AC- Grid 5,200
Reinforcement
Expansion and Reinforcement
Transmission grid
Grid expansion and Reinforcement of 8,700km is
required by 2024
Baseline scenario with overhead lines requires:
22 bn €*
Additionally the connection of the offshore-grid is
estimated to
10-12 bn €
*Costs estimates per NEP-Draft 2014 49GW/12GW wind onshore/offshore
www.gtai.com |
Source: TSO 2014 19Agenda
Cleantech Markets in Germany: Energiewende and more…
a) From Generation to Integration
b) Energy Efficiency
c) Environmental Technologies
www.gtai.com |Primary Energy Efficiency in Germany
Germany aims to decouple economic growth and energy consumption –
much has been achieved but the potential is still vast.
Average Increase
Base year = 1990 change 1990 to 2012
in % in percentage
p.a. points
160
150 + 1.85 + 50
140
+ 1.44 + 37
130
120
110
100
90 - 0.4 - 9
80
70
- 1.82 - 33
60
50
GDP PEC Energy Productivity Energy Intensity
Source: Authors‘ own graph; data source: AGEB (Working Group on Energy Balances), 2013
22.05.2015 | www.gtai.com
www.gtai.com |The Building Energy Efficiency Opportunity
Germany has Europe‘s largest building stock and construction market.
Refurbishment segment dominates – smart retrofit solutions are needed!
Volume of residential construction in
Germany, in EUR billions Market Drivers for
140
Energy Efficiency:
120
100
1. Energy prices
80
60 2. Regulation &
40
Incentives
20
0
3. Innovation
Residential new Residential refurbishment
Source: DIW 2013 , Heinze Marktforschung , BBSR *Prognosis GTAI © novonty – fotolia.com
www.gtai.com |
www.gtai.com
Germany Trade & InvestVast Industrial Energy Efficiency Potential
93 billion EUR investment = 199 TWh economically attractive savings*
Economically attractive energy savings potential in German industry in TWh
with existing technologies.
15
Savings potential:
42 TWhel/a = 4.9 B € energy costs/year
8.0 TWhel 157 TWhth/a = 6.3 B € energy costs/year
3.3 TWhel
7.5 TWhth
12.6 TWhel
10
Payback in years
0.8 TWhel
3.9 TWhel 59.8 TWhth 79.7 TWhth
4.4 TWhel
2.2 6.5 TWhel 10.0 TWhth
Heat
TWhel
5
0.4 TWhel
0.2 TWhel
Needed: New business models, financial innovation, tech solutions
0
0 5000 10000 15000 20000 25000 30000
Invest in million EUR
Motion Energy Waste
26000 17500 14000
(Pumps,
10500 7900
Data 7200 6700
Com- 3700
Process
2000 500
Electri- 300
Process Process Hydraulics city Water
Lighting Manage- HVAC pressed
Heat Automation E-Motors, Cold Treat-
ment Air Supply
etc.) ment
Source: Siemens
22.05.2015 2013, * Economically attractive= IRR> 8%
| www.gtai.com
www.gtai.com |
23Agenda
Cleantech Markets in Germany: Energiewende and more…
a) From Generation to Integration
b) Energy Efficiency
c) Environmental Technologies
www.gtai.com |The German Market for Waste Management Recycling
Germany is by far the world’s largest market for waste management
recycling with a turnover of EUR 17 billion (17% of the global market
share)
REDUCE
German Recycling Market 2014
• Industry Turnover EUR 17 billion
REUSE
• Germany has 64% of the world market share
for material separation devices
• Number of employees 60,000
RECYCLE
• Expected increase at 5.2% until 2025
Source: GreenTech Atlas, 2014; BMUB
www.gtai.com |
www.gtai.com
25Future Population Dynamics: Impacts .
Changes in population development from 2005 to 2025 as a %
“The Water-Wende” - In some
regions, the decline in
population will lead to an
infrastructural challenge”
Source: Profile of the German Water Sector, 2011 – Edited by ATT, BDEW, DBVW, DVGW, DWA, VKU – Graphics provided by BDEW (2013)
www.gtai.com |Sustainable Water Technologies
R&D Clusters
No. Institute
1 Ecologic
2 Engler-Bunte-Institute
3 Cologne University of Applied Sciences, "STEPS"
4 Fachhochschule Deggendorf - University of Applied Sciences
5 University of Applied Sciences Osnabrück
6 Research Center Karlsruhe, Program ENVIROMENT
7 Fraunhofer-Community, Fraunhofer-Institute for Applied Ecologics
8 Fraunhofer-Community, Fraunhofer-Institute for Molecular-Biology
9 GKSS Research Center Geesthacht GmbH
10 Institute for Automation and Communication e.V. Magdeburg
11 Institute for Hygiene and Enviroment
12 Institute for Regional Developement and Planing (IRS)
13 University Stuttgart
14 Institute for social-ecological Research
15 University Karlsruhe
16 IZES-Institute for Futural-Energy-Systems
17 Johannes-Gutenberg-University Mainz
18, 19 Leibniz University Hannover
20 Martin-Luther-University Halle-Wittenberg
21 Eco Institut e.V. Freiburg
22 PIK - Potsdamer Institute for Climate Consequences Research
23 RWTH Aachen
24, 25 Technical University Berlin
26, 27 Technical University Dresden
28 Technical University Hamburg-Harburg
A Selection of Networks of
29 Technical University Ilmenau
30 Technical University Kaiserslautern Competence
31 Technical University Munich
32 University Bielefeld
33, 34 University Bremen
35 University Duisburg-Essen, Biofilm Center
36 University Freiburg
37 University Kassel
38 University Leipzig
39, 41 University Lüneburg
40 University Siegen
42 Wuppertal Institute for Climate, Enviroment, Energy GmbH
43 ZEW - Center for European Economic Research GmbH
www.gtai.com |
www.gtai.comEnergiewende – Longterm scenario
The E-Energy Vision for a Smart Grid
Source: E-Energy
www.e-energy.de/en
Source: E-Energy
www.gtai.com |Don‘t hesitate to contact us!
Energy, Environment and Resources Division:
Europe
Berlin - Headquarters
Mr. Thomas Grigoleit Mr. Heiko Staubitz Mr. Tobias Rothacher Mr. Henning Ellermann
Director Senior Manager Senior Manager Manager
Energy, Environment and Energy Storage and Smart Photovoltaics and Storage Energy Efficiency
Resources Grid T. +49 30 200 099-225 T. +49 30 200 099-257
T. +49 30 200 099-224 T. +49 30 200 099-226 tobias.rothacher@gtai.com henning.ellermann@gtai.com
thomas.grigoleit@gtai.com heiko.staubitz@gtai.com
Ms. Esther Frey Mr. Max Hildebrandt Mrs. Flérida Regueira Cortizo Mr. David J.Warne
Manager Manager Senior Manager Senior Manager
Wind Photovoltaics and Storage Environmental Technologies Geo Energy & Resources
T. +49 30 200 099-253 T. +49 30 200 099-223 T. +49 30 200 099-230 T. +49 30 200 099-601
esther.frey@gtai.com max.hildebrandt@gtai.com flerida.regueira@gtai.com david.warne@gtai.com
North America
New York Office San Francisco Office
Mr. Claus Habermeier Ms. Angelika Geiger
Director Director
New York, USA San Francisco, USA
T: +1 212 584 9715 T: +1 415 248 1246
F: +1 212 262 6449 F: +1 415 627 9169
claus.habermeier@gtai.com angelika.geiger@gtai.com
Asia-Pacific
Beijing Office Tokyo Office Mumbai Office
Mr. Markus Hempel Mr. Iwami Asakawa Ms. Asha-Maria Sharma
China Representative Japan Representative India Representative
Beijing, China Tokyo, Japan Mumbai, India
T. +86 10 6539 6725 T. +81 3 5275 2072 T. +91 22 66 65 21 80
F. +86 10 6590 6167 F. +81 3 5275 2012 asha-maria.sharma@gtai.com
markus.hempel@gtai.com iwami.asakawa@gtai.com
© 2014 Germany Trade & Invest
All information provided by Germany Trade & Invest has been put together with the utmost care. However, we assume no liability for the accuracy of the information provided.
www.gtai.com |You can also read