Italy draft national energy and climate plan - Brussels, 29-30 January 2019
←
→
Page content transcription
If your browser does not render page correctly, please read the page content below
GOVERNANCE OF THE ENERGY UNION AND CLIMATE ACTION

                            Italy
                            draft national energy
                            and climate plan
                            Brussels, 29-30 January 2019
GOVERNANCE OF THE ENERGY UNION AND CLIMATE ACTION
PREPARATION OF THE DRAFT PLAN
• MAIN ELEMENTS AND KEY LESSONS LEARNED FROM THE
PROCESS TO DATE, INCLUDING ON THE ROLE OF REGIONAL
COOPERATION
Main elements
Integrated approach aims to ensure also environmental and socio-economic sustainability. On the
one side, the evolution of energy system and its related targets will be pursued while preserving
environmental assets like air quality, landscapes and land use. On the other side, citizens and
businesses will be firstly involved in the transition process, promoting self-consumption and energy
communities, while monitoring energy bills and competitiveness of enterprises
Accelerating the GHGs emissions reduction, in line with the long term objective of a deep de-
carbonization by 2050, also trough the phasing out of coal in power generation
Promote the diffusion and integration of renewable energies, while minimising environmental
impacts (for example priority will be given to PV plants on buildings to preserve the soil, heat
pumps to avoid particulate emissions, advanced biofuels to use residues and waste)
Energy efficiency will be crucial to contribute to environmental protection goals and to reduce
foreign fossil fuel dependency, while sustaining economic growth. Energy savings are mostly
expected in the civil and transport sectors, where electrification will also reduce air pollution
• Lesson learned
+ The comprehensive plan on energy transition gave us the opportunity to develop a crosscutting
approach, based on integrated analysis and targets, with a coherent view throughout all the
different aspects of energy and environment
− At this early stage an highly detailed definition of all policies and technology options, their funding
and their impacts, to achieve long term targets may be tricky, suggesting possible in progress
adjustmentsGOVERNANCE OF THE ENERGY UNION AND CLIMATE ACTION
Overview of key objectives, targets and contributions
related to EU 2030 targets (Article 4)
2016 2030 UNITS
Binding national 2030 target for non-ETS GHG emissions
under ESR compared to 2005
- 18 - 33 %
(Estimated) Annual national limits 2021-30 261 221 Mt CO2eq
(year 2021)
No debit rule (accounted emissions from land
LULUCF commitment use shall be entirely compensated by an
equivalent removal of CO₂ from the atmosphere)
Planned share of energy from renewable sources in gross
final consumption of energy in 2030
17 30 %
Levels of indicative renewables trajectory in the years
2022, 2025 and 2027
17 21, 24, 26 %
National contribution for energy efficiency:
- Primary energy consumption in 2030 148 125* Mtoe
- Final energy consumption in 2030 116 104
Level of electricity interconnectivity by 2030 8 10 %
* Corresponding to a 43% reduction of 2030 primary energy consumptions foreseen by PRIMES 2007 scenario.GOVERNANCE OF THE ENERGY UNION AND CLIMATE ACTION
Decarbonisation / GHG and renewable energy
2016 2030 UNITS
Planned share of energy from renewable sources in gross
final consumption of energy in 2030 17.4 30 %
Estimated share of renewable sources in the heating and
cooling sector (end point of estimated trajectory for RES-H/C) 18.9
33.1 %
Estimated share of renewable sources in the electricity sector
(end point of estimated trajectory for RES-E) 34.0 55.4 %
Estimated share of renewable sources in the transport sector
(end point of estimated trajectory for RES-T) 6.5 21.6 %
(Other national GHG objectives and targets consistent with
the Paris Agreement and the existing long-term strategies) n.a. n.a.
(Other sector targets and adaptation goals, if available)*
* *
ADDITIONAL COMMENTS:
* In 2015 Ministry of Environment approved the National Adaptation Strategy. The National
Plan on Adaptation has recently gone through a public consultation. Targets and goals on
adaptation will be set directly by Regions at local level, based on the principles and
guidelines included in the Strategy and the Plan.GOVERNANCE OF THE ENERGY UNION AND CLIMATE ACTION
Energy efficiency
2016 2030 UNITS
National contribution for energy efficiency:
- Primary energy consumption in 2030 148.0 125.0*
Mtoe
- Final energy consumption in 2030 115.9 103.8
Cumulative amount of energy savings to be achieved over the
period 2021-2030 under Article 7(1)(b) on energy saving n.a. 51.4 Mtoe
obligations of Directive 2012/27/EU
Indicative milestones of the long-term strategy for the
renovation of the national building stock (if available) n.a. 5.7** Mtoe
Total floor area to be renovated or equivalent annual energy
savings to achieved under Article 5 of Directive 2012/27/EU 1.4 6.2*** Mm2
ADDITIONAL COMMENTS (IF ANY):
The main contributions on energy efficiency are expected from civil sector
(residential and services) and transport, also through the electrification of
final consumptions.
* Corresponding to a 43% reduction of 2030 primary energy consumptions foreseen by PRIMES 2007 scenario.
** Annual savings foreseen for 2030 due to building renovation. For 2040 foreseen annual savings
will increase up to 11.4 Mtoe, approximately.
*** Corresponding to an annual increase of 3% of the total floor area of central government
buildings.GOVERNANCE OF THE ENERGY UNION AND CLIMATE ACTION
Interconnections / market integration / energy poverty
2016 2030 UNITS
Level of electricity interconnectivity by 2030 %
8* 10*
Cross border interconnection capacities for electricity 9285 14375 MW
Usage rates - Cross border interconnection capacities for Import 74**
n.a. %
electricity Export 11
The cross border wholesale price differential: yearly
>2 n.a. €/MWh
average of absolute hourly price differentials of €/MWh
The electricity demand and possible import need: nominal
transmission capacity / peak load 2030 27 35 %
The electricity supply and the export potential: nominal
transmission capacity / installed renewable generation 28 25 %
capacity 2030
Market integration
Energy poverty 8.6 7 %***
ADDITIONAL COMMENTS ON INTERCONNECTIVITY:
The very high capacity of non programmable energy sources foreseen for 2030 makes it very
difficult to reach the target (calculated as ratio between Net Transfer Capacity and total generation
capacity).
* Excluding interconnections with Montenegro and Tunisia.
** Calculated as ratio between total import (export) and the yearly average of hourly net transfer
capacities.
*** % of families suffering from energy poverty.GOVERNANCE OF THE ENERGY UNION AND CLIMATE ACTION
Security of supply, R&I and competitiveness
(non-quantitative objectives)
SECURITY OF SUPPLY
National objectives with regards to security of supply.
− The energy dependence will decrease significantly, going from 77.5% in 2016
to 63.5% in 2030; this is the combined effect of policies on energy efficiency
and renewables.
− Security and flexibility of the electricity system. Considering that the planned
2030 electricity system will mostly rely on gas and RES, with growing
distributed generation, it is planned to introduce new architectures and
management methods (eg including renewables, storage and demand) and
to remove the obstacles that slow down the interventions on the networks.
− For natural gas diversification of the supply sources, (eg. LNG) and
improvement of the flexibility of the national infrastructures (eg. by
increasing the gas storage capacity).
− Given the time needed for the progressive transition to a lower fossil-fuelled
energy system, the role of a national environmentally and technologically
advanced, efficient and competitive downstream oil industry is still
important. It will ensure the reliability, sustainability and security of supply
through, for example, biorefineries processing advanced feedstock, for a
transition to advanced biofuels and new products with high environmental
compatibility.GOVERNANCE OF THE ENERGY UNION AND CLIMATE ACTION
Security of supply, R&I and competitiveness
(non-quantitative objectives)
RESEARCH, INNOVATION AND COMPETITIVENESS
National objectives and funding targets for public and private research and innovation relating to the Energy Union.
− Italy is part of the EU SET-Plan and is a promoter of Mission Innovation launched
at COP21 to boost frontier projects for clean energy technologies and committed
to double public funds for R&D for clean energy (from 222 Million Euro in 2013
to 444 Million Euro in 2021)
− Development of advanced clean energy materials enabling high performance
and low costs for PV, energy storage, efficiency in buildings and industrial
processes, components of electric power transmission lines.
− Development of management models of electricity system and grids that favor
the integration of renewable and non-programmable generation, self-production,
storage, energy communities and aggregators.
− Application of advanced information technologies, internet of things, peer to
peer to the electricity system, to improve grid security and resilience.
− Development of models and tools to increase the penetration of the electric
mobility in the transport sector and improve its integration and interaction with
the electricity system.
− Upgrade of electricity grids, smart grids. Evolution of distribution grids, with
focus both on hardware components (eg to make networks bi-directional) and
software (eg to enable demand response management initiatives).GOVERNANCE OF THE ENERGY UNION AND CLIMATE ACTION
COOPERATION & GOOD PRACTICES
• IN WHAT AREAS WOULD YOU LIKE TO SEE FURTHER
COOPERATIVE WORK WITH OTHER MEMBER STATES/THE
COMMISSION?
• An important topic on which address specific cooperative work is the implementation of the
planned development of cross-country infrastructures. Moreover, the sharing of scenarios on
electricity market among countries will help to evaluate their consequences on international
trade of electricity. The Commission could play a stronger role to promote such exchanges.
• WHAT ELEMENT(S) OF YOUR DRAFT PLAN WOULD YOU
RECOMMEND AS ‘GOOD PRACTICE’ FOR OTHER MEMBER STATES?
The Governance set up: In order to ensure an holistic approach an intergovernmental
“steering committee” composed by Ministry of Economic Development, Ministry of
Environment, and Ministry of Transport has been set up.
Involvement of the public and stakeholders: Public consultation has an important role
in Italy. The Italian NECP will be subject to the Strategic Environmental Assessment (SEA)
procedure and in this framework the Environmental report elaborated on the NECP will be
open for a wide consultation.
Development of strong analytical base and projection: Due to the cross cutting
nature of the Plan a ”Modelling and Scenarios” technical working group composed by public
institutes dealing with climate, energy and economic issues has been established. A link
among models and tools has been implemented in order to elaborate a coordinated Energy,
GHGs, and Economy analysis.GOVERNANCE OF THE ENERGY UNION AND CLIMATE ACTION
PLANNED NEXT STEPS FOR THE FINALISATION OF THE PLAN
• REGIONAL COOPERATION
• Besides the on going cooperation for the implementation of the planned
interconnections (gas and electricity), the cooperation with neighbouring countries will
be important for the implementation of the Plan and will be part of our work for 2019.
• PUBLIC CONSULTATION
In 2019 will be organized: 1) wide public consultation, including local authorities,
through the institutional NECP web site platform 2) public auditions with Italian
Parliament 3) thematic meeting with energy and climate stakeholders 4) public
consultation on the Environmental Repot of the NECP elaborated in the framework of
the Strategic Environmental Assessment (SEA).
• POLITICAL ENDORSEMENT
• The dialogue with the Parliament will benefit from the work currently performed by
the Commission X of the Chamber of Deputies, aimed to understand how the
following target can be met: delivery to the market of sustainable technologies,
improvement of energy efficiency, ensure energy security and flexibility and reduce
energy costs. A dialogue with regions and municipalities will start in order to share
targets and some measures.
• OTHER NEXT STEPS
• Continuous dialogue with the CommissionGOVERNANCE OF THE ENERGY UNION AND CLIMATE ACTION • Back-up
GOVERNANCE OF THE ENERGY UNION AND CLIMATE ACTION
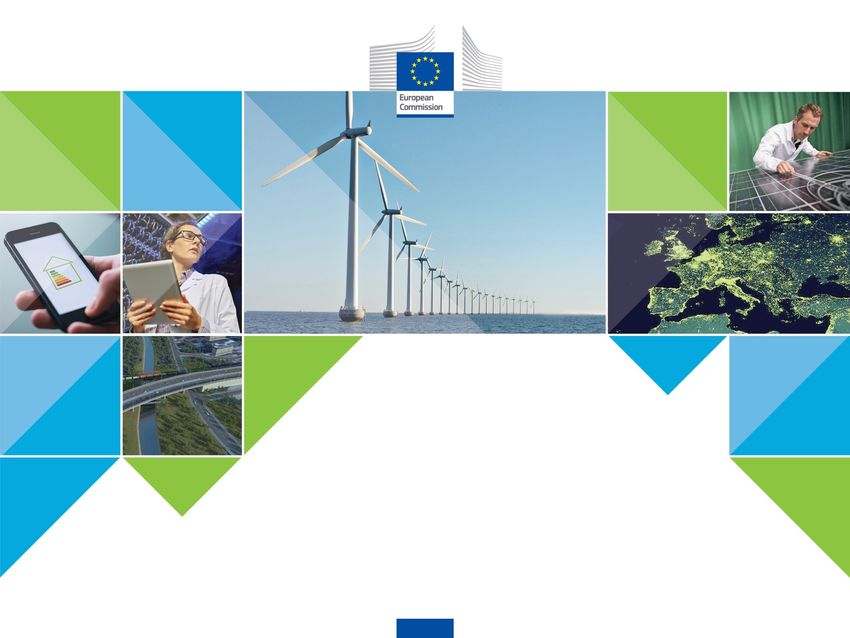
Decarbonisation / GHG and renewable energy
Trajectory of overall RES share towards 2030 planned national contribution to EU target
Observed overall Gross final consumptions [Mtoe] Planned overall Gross final consumptions [Mtoe]
145 35, 0%
Observed RES share [%] Planned RES share [%]
30%
28% 30, 0%
125
27%
26%
25%
24%
23%
25, 0%
105
22%
21%
20%
18% 18% 19% 19% 20, 0%
17% 18% 17%
17%
15%
85
13%
15, 0%
65
10, 0%
45
5,0 %
128 127 124 119 121 121 120 120 120 120 119 119 118 117 116 115 114 113 112 111
25 0,0 %
2011 2012 2013 2014 2015 2016 2017 2018 2019 2020 2021 2022 2023 2024 2025 2026 2027 2028 2029 2030
• RES share acceleration starting from 2020, along with implementation of planned policiesGOVERNANCE OF THE ENERGY UNION AND CLIMATE ACTION
Decarbonisation / GHG and renewable energy
RES trajectories in Heating and cooling sector until 2030 [Mtoe]
Observed Gross final consumptions for heating and cooling [Mtoe] Bioenergies
33% ambient energy (heat pumps)
Planned Gross final consumptions for heating and cooling [Mtoe]
65 35, 0%
32% 8 Gross production of derived heat from RES
Observed RES-H&C share [%] 31% Solar
Planned RES-H&C share [%] 30%
29% Geothermal
29%
60
30, 0%
7
27%
55
25%
24% 25, 0%
6
22%
21%21%
20%20%
50
5
19%19%19%
18%
20, 0%
17%
45
4
14% 15, 0%
40
3
10, 0%
2
35
5,0 %
1
30
59 60 59 53 56 56 56 55 54 52 51 50 49 48 47 47 46 45 45 44
-
25 0,0 %
• Stable contribution of biomass (air quality constraints)
• Sharp increase of ambient energy use, up to around 5,5 MtoeGOVERNANCE OF THE ENERGY UNION AND CLIMATE ACTION
Decarbonisation / GHG and renewable energy
RES trajectories in electricity sector until 2030
31
Observed Gross Electricity Consumptions [Mtoe]
60, 0%
80
55%
Solar Hydro* Wind*
Planned Gross Electricity Consumptions [Mtoe] 53%
Observed RES-E share [%] 50% Bioenergies Geothermal
70
30
Planned RES-E share [%] 47% 50, 0%
45%
42% 60
41%
40%
39%
38%
36%
29 40, 0%
35%36% 50
33%33%34%34%
31%
27% 40
TWh
28 30, 0%
24%
30
27 20, 0%
20
26 10, 0%
10
30 29 28 28 28 28 29 28 28 28 28 28 28 28 29 29 29 29 29 29
25 0,0 %
-
*normalized (dotted line), actual production (continuous line)
RES capacity is expected to grow up to 93 GW in 2030, with almost 40 additional GW with respect to 2017. The main
contribution will be given by solar PV, with almost +30 GW, followed by wind, with almost +9 GW
RES energy is expected to grow up to about 187 TWh, starting from 113 TWh in 2017. Again, the highest increase will be
due to solar energy (+50 TWh), followed by wind energy (+23 TWh)GOVERNANCE OF THE ENERGY UNION AND CLIMATE ACTION
Decarbonisation / GHG and renewable energy
RES trajectories in transport until 2030
37
Observed Gross final consumptions in transport [Mtoe] - RED II 1.400
25, 0%
Renewable electricity in rail transport
Single counting biofuels
Planned Gross final consumptions in transport [Mtoe] - RED II
22% Double counting biofuels (non advanced)
Observed RES-T share [%] - RED II 20% 1.200
35
Other advanced biofuels
Planned RES-T share [%] - RED II 19% 20, 0%
Advanced biomethane
17% 1.000
Renewable electricity in road transport
33
16%
14%
15, 0%
13% 800
12%
ktoe
31
11%
10% 600
8% 10, 0%
29
7%
6% 6%
6% 6% 5% 400
5% 5% 4% 5,0 %
27
200
35 33 32 33 32 32 30 31 31 32 31 31 30 29 29 29 28 28 28 28
25 0,0 %
0
• Obligation higher than RED II art 25 in order to ensure the achievement of overall RES share of 30%;
• Advanced biofuels will reach around 8% (more than twice the RED II target) thank to the contribution of
biomethane (planned to cover 75% of advanced biofuels);
• Strong growth of RES electricity consumed by road vehicles (up to 380 ktoe).GOVERNANCE OF THE ENERGY UNION AND CLIMATE ACTION
Energy efficiency
2030 savings with active policies (Article 7) Cumulative 2021-2030 savings with active
by economic sector (Mtoe) policies (Article 7) (Mtoe)
Current year
2.6
Preceding years
51.4
1.0
42.1
2.4 9.3 33.7
26.2
19.6
14.0
3.3 9.4
5.6
0.9 2.8
Residentiall
Residenziale Services
Terziario Industry
Industria Transport
Trasporti Total
Totale
2021 2022 2023 2024 2025 2026 2027 2028 2029 2030
The main contributions on energy efficiency are expected from civil
sector, with 2030 savings equal to 5.7 Mtoe, related to the residential
sector (3.3 Mtoe) and Services (2.4 Mtoe). Moreover, a relevant
contribution is expected in transport (2.6 Mtoe)
Cumulative savings in the period 2021-2030 sum up to 51.4 MtoeYou can also read