Bioenergy from Waste Paw-Paw Fruits and Peels Using Single Chamber Microbial Fuel Cells
←
→
Page content transcription
If your browser does not render page correctly, please read the page content below
OPEN     ACCESS Freely available online

                          Journal of Fundamentals of
                      a
d

    ISSN: 2090-4541
                          Renewable Energy and Applications
                                                                                                                                     Research Article

Bioenergy from Waste Paw-Paw Fruits and Peels Using Single Chamber
Microbial Fuel Cells
Kalagbor Ihesinachi A1,2*, Nwosu Lois N2, Akpotayire Stephen I3
1
  Research & Development Centre, Ken Saro–Wiwa Polytechnic,Bori, Rivers State, Nigeria
2
  Department of Science Laboratory Technology, School of Applied Sciences, Ken Saro–Wiwa Polytechnic,Bori, Rivers State, Nigeria
3
  Department of Biochemistry, University of Port-Harcourt, Choba, Rivers State, Nigeria

                      ABSTRACT
                      The generation of electricity from waste paw-paw fruits and peels is one of the approaches to meet the population
                      demand for energy. We have employed the use of single microbial fuel cells (SMFC) as an alternative source of
                      generating electricity using microorganisms. The graphite used for the electrodes were obtained from discarded
                      finger batteries. The waste paw-paw fruits and peels were weighed in varying quantities of 5kg, 10kg, 15kg and 20kg.
                      The results obtained showed that the voltage and current produced from the 20 kg paw-paw waste were capable
                      of lighting a 2V bulb continuously for one week. The decrease in voltage and current with time was as a result of
                      decrease in the organic matter contents of the substrates used. The linearity relationship between voltage, current
                      density and power density showed r2 values of 0.906 to 0.994 across the various weights of paw-paw waste used. The
                      steady increase in conductivity values showed that the medium was capable of conducting electricity. A decreasing
                      trend was observed in the results obtained for biochemical oxygen demand (BOD), dissolved oxygen (DO) and
                      chemical oxygen demand (COD) for all the substrates. In this research, we achieved the conversion of paw-paw
                      biomass to bio-energy using a simple and cheap method. The use of discarded finger batteries was an opportunity
                      to convert waste to wealth.
                      Key words: Biomass; Bioelectricity; Voltage; Finger batteries; 2V bulb; Paw-paw; Microorganisms; Daily readings.

INTRODUCTION                                                                      opportunity to generate electricity from a wide range of substrates.
                                                                                  It is a biological system in which electrons produced from the
Most of the energy around the world comes from non-renewable                      microorganisms are transported over an anode, conducting wire
sources, including coal, petroleum, oil and natural gases which are               and a cathode, thereby converting the energy directly into electrical
being depleted at a higher rate [1]. Energy is a prime requirement                energy [4,5]. In microbial fuel cells, microbes play crucial roles in
of all sectors of an economy. This includes the industry,                         energy production and the removal of organic contaminants. The
transportation, agriculture, hospitals as well as domestic uses                   single-chamber microbial fuel cell (SMFC) with an air-cathode
without which advancement of technology and survival of life is                   has great advantages in terms of the structure, power density and
not possible [2]. Despite having abundance of both renewable and                  aeration and is has been considered the most anticipated mode
non-renewable energy resources notably hydro, biomass, fossil fuels               for practical application [6].The generation of bioelectricity has
coal and natural gas, Nigeria is still being plagued with electricity             been achieved over the years using biomass[7-11]which includes
crisis. The electricity crisis has hampered the socio-economic and                agricultural crops, seeds and bio waste. It has been reported [12-
technology of the nation and has compelled many industries to                     15] that these are major sources of bioelectricity. Paw-paw contains
either shut down or relocate to neighboring countries thereby                     sugar and other ingredients with sufficient chemical energy that can
reducing job availability and national product. The development                   be converted into electrical energy by means of a redox reaction. Its
and deployment of waste-to-energy (WTE) technology in Nigeria                     high content of glucose and fructose and polysaccharides which are
was proposed [3] following the Swedish WTE model. It is expected                  easily hydrolyzed makes it a viable source for bioenergy. The
that this will improve the epileptic power supply in the country as               purpose of this research is to carry out a biotransformation of paw-
well asreduce the huge quantities of municipal solidwaste generated               paw waste into clean bioenergy and reduce the environmental
annually. The microbial fuel cell (MFC) technology provides the                   pollution that arises from the accumulation of this organic waste.
*Correspondence to: Kalagbor Ihesinachi A, Research & Development Centre, Ken Saro–Wiwa Polytechnic, P.M.B. 20 Bori, Rivers State
Nigeria, Tel: 08033098983; E-mail: kalagbor.ihesinachi@kenpoly.edu.ng
Received: November 05, 2020; Accepted: December 26, 2020; Published: January 02, 2021
Citation: Ihesinachi KA, Lois NN, Stephen AI (2021) Bioenergy from Waste Paw-Paw Fruits and Peels Using Single Chamber Microbial
Fuel Cells. J Fundam Renewable Energy Appl 11:1. doi: 10.4172/2090-4541.1000282
Copyright: ©2021 Kalagbor Ihesinachi A. This is an open access article distributed under the term of the Creative Commons Attribution
License, which permits unrestricted use, distribution, and reproduction in any medium, provided the original work is properly cited.

J Fundam Renewable Energy Appl, Vol. 11 Iss. 1 No: 282                                                                                              1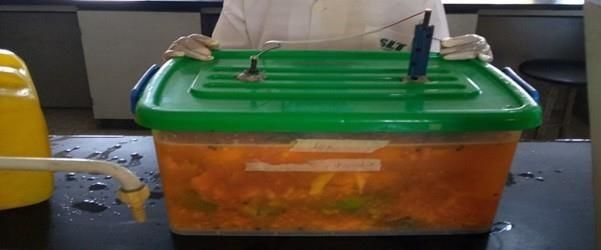
Ihesinachi K A, et al. OPEN ACCESS Freely available online
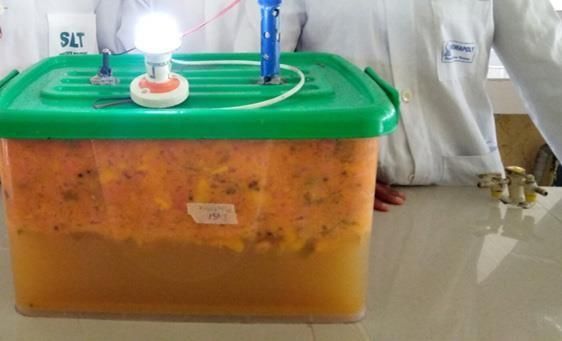
Figure 1: The SMFC set up ready and running.
METHODOLOGY RESULTS AND DISCUSSION
Construction of the Single Chamber Microbial Fuel Cells Voltage and Current
The single chamber microbial fuel cell (SMFC) was constructed The plot of the readings obtained for voltage and current from
using a 25litre rectangular plastic container. The electrodes were this research are presented in Figures 3 and 4 respectively. The
constructed with 10mm diameter PVC (poly vinyl chloride) pipes voltage and current decreased daily for all the weights studied are
filled with graphite extracted from discarded 1.5V finger batteries. shown in Tables 1-6. This can be attributed to the decrease in the
The heights of the cathode and anode electrodes were 40cm and organic matter contents of the substrate as the microorganisms
25cmrespectively. The anode is not aerated while the cathode is decomposed the biomass daily. The highest voltage and current
porous and aerated (exposed directly to the air). The terminals of recorded for the 5kg paw-paw waste was 1.9V and 1.6A respectively.
the electrodes were connected by a copper wire to 10,000 resistor These values increased as the weight of the substrates increased.
Better output values were obtained with the20kg waste. Voltage
and digital multimeter was connected to the positive and negative
and current readings were 4.5V and 4.2A respectively on Day 1.
terminals of the electrodes for current and voltage readings. This
There was a gradual decrease of these values as the study progressed
is shown in Figure 1.The SMFC was constructed and used in the
to Day 7 with final readings of 2.3V and 2.0A. These were found to
laboratory at room temperature. generate enough electricity that kept a 2V bulb lit for seven (7) days
Collection of Sample Materials during the experiment as shown in Figure 2.This is in agreement
with the findings [15] that this technology enables the supply of
Waste paw-paw fruits and peels were collected from different energy to small devices.
market dump sites and taken to the laboratory. The required
quantity for the week’s study was weighed out using a digital top- The results obtained from the polarization curves for the different
loading weighing balance (Model: SP20kg; capacity: 20kg/40lb) weights shows that the relationship between voltage and power
and were kept in the chamber to decompose for 3 days leaving it density as well as its relationship with current density is
open to prevent heat from destroying the microbes. significant.
Microbial fuel cell Procedures pH
The waste paw-paw fruit and peels which had been weighed on a Average pH values obtained were 4.90 ± 0.15, 4.70 ± 0.33, 3.70
scale were poured into the 25litre plastic container and reduced ± 0.40 and 3.80± 0.37 for 5kg, 10kg, 15kg and 20kg respectively.
to pulp by hand. Water was added to the sample to make up the These values were observed to decrease as the study days progressed.
The values for the 5kg and 10kg were relatively in the same range
volume to 25litres. The SMFC container was properly secured by
of 4.3 – 5.3. The values for the 15kg and 20kg were also found to
clamping the sides with the side handles to maintain an anaerobic
have a common range of 3.6 – 4.4. The plot for these pHreadings
environment throughout the seven (7) days of study for each
from all four weights is presented in Figure 5. The medium was
batch. The copper wire was connected to the electrodes and a mostly acidic for all the batches.
10,000 resistor.Voltage and current output across the 10,000 resistor
was recorded daily, using the digital multimeter (DT 9205A). Conductivity
This procedure was carried out for 5kg, 10kg, 15kg and 20kg of Conductivity values recorded in this experiment are shown in the
the waste each week. plot presented on Figure 6. They were observed to increase daily
Physicochemical analysis with increasing quantities of the substrate. The average values
obtained were 1.60 ± 0.21 S/cm, 3.02 ± 0.57 S/cm, 3.30 ± 0.46
The physicochemical parameters; conductivity, pH, chemical S/cm and
oxygen demand (COD), biochemical oxygen demand (BOD) and 3.47 ± 0.46 S/cm for 5kg, 10kg, 15kg and 20kg respectively. The
dissolved oxygen (DO) were analyzed. The pH and conductivity 5kg substrate recorded the least conductivity readings. However,
parameters were measured using a digital hand-held portable the results obtained showed that conductivity was proportional to
HANNA instrument (HI 9813-6N). the quantity of waste paw-paw fruits and peels used. The steady
increase in values also showed that the medium was capable of
J Fundam Renewable Energy Appl, Vol. 11 Iss. 1 No: 282 2Ihesinachi K A, et al. OPEN ACCESS Freely available online
Table 1: Mean value for voltage and current readings
Parameters 5kg 10kg 15kg 20kg
Voltage (V) 0.90±0.62 1.91±0.91 2.57±0.45 3.26±0.84
Current (A) 0.84±0.54 1.50±0.90 2.54±0.99 3.17±0.76
Table 2: Mean values for physicochemical parameters
Parameters 5kg 10kg 15kg 20kg
pH 4.90±0.15 4.70±0.33 3.70±0.40 3.80±0.37
Conductivity (S/cm) 1.60±0.21 3.02±0.57 3.30±0.46 3.47±0.46
BOD (mg/L) 3.60±0.26 3.27±0.19 2.99±0.31 3.49±0.24
DO (mg/L) 5.49±0.28 5.19±0.78 4.99±0.46 4.66±0.26
COD (mg/L) 7.37±0.37 6.47±0.41 6.04±0.55 6.63±0.63
Table 3: Polarization data for 5kg with 10000Ω resistor.
Experimental days Current (A) Voltage (V) Current density (A/m2) Power (W) Power density (W/m2)
1 1.6 1.9 789.34 3.04 1499.75
2 1.3 1.4 641.34 1.82 879.88
3 1.1 1.1 542.67 1.21 596.94
4 0.9 0.8 444.01 0.72 355.20
5 0.6 0.7 296.00 0.42 207.20
6 0.3 0.2 148.00 0.06 29.60
7 0.1 0.2 49.33 0.02 9.87
Table 4: Polarization data for 10kg with 10000Ω resistor.
Experimental days Current (A) Voltage (V) Current density (A/m2) Power (W) Power density (W/m2)
1 2.7 2.9 1332.02 7.83 3862.85
2 2.4 2.7 1184.02 6.48 3196.84
3 1.9 2.5 937.35 4.75 2343.36
4 1.4 2.1 690.68 2.94 1450.42
5 1.2 1.7 592.01 2.04 1006.41
6 0.7 1.1 345.34 0.77 379.87
7 0.2 0.4 98.67 0.08 39.47
Table 5: Polarization data for 15kg with 10000Ω resistor.
Experimental days Current (A) Voltage (V) Current density (A/m2) Power (W) Power density (W/m2)
1 3.6 3.1 1776.00 11.16 5505.67
2 3.5 2.9 1726.69 10.15 5180.07
3 3.4 2.8 1677.36 9.52 4696.60
4 2.5 2.7 1233.35 6.75 3330.04
5 2.1 2.5 1036.01 5.25 2590.03
6 1.5 2.2 740.01 3.30 1628.02
7 1.2 1.8 592.01 2.16 1065.61
Table 6: Polarization data for 20kg with 10000Ω resistor.
Experimental days Current (A) Voltage (V) Current density (A/m2) Power (W) Power density (W/m2)
1 4.2 4.5 2072.03 18.90 9324.12
2 3.8 4.1 1874.70 15.58 7686.24
3 3.5 3.6 1726.69 12.60 6216.08
4 3.3 3.1 1628.02 10.23 5036.88
5 2.9 2.8 1430.69 8.12 4005.92
6 2.5 2.4 1233.35 6.00 2960.04
7 2.0 2.3 986.68 4.60 2269.36
J Fundam Renewable Energy Appl, Vol. 11 Iss. 1 No: 282 3Ihesinachi K A, et al. OPEN ACCESS Freely available online
Figure 2: The bioelectricity lights up a 2V bulb.
Figure 3: Polarization curve of voltage against current for SMFC with a 10000Ω resistor for 5kg.
Figure 4: Polarization curve of voltage against current density for SMFC with a 10000Ω resistor for 5kg.
Figure 5: Polarization curve of voltage against power density for SMFC with a 10000Ω resistor for 5kg.
J Fundam Renewable Energy Appl, Vol. 11 Iss. 1 No: 282 4Ihesinachi K A, et al. OPEN ACCESS Freely available online
Figure 6: Polarization curve of voltage against current for SMFC with a 10000Ω resistor for 10kg.
Figure 7: Polarization curve of voltage against current density for SMFC with a 10000Ω resistor for 10kg.
Figure 8: Polarization curve of voltage against current density for SMFC with a 10000Ω resistor for 10kg.
Figure 9: Polarization curve of voltage against current density for SMFC with a 10000Ω resistor for 15kg.
J Fundam Renewable Energy Appl, Vol. 11 Iss. 1 No: 282 5Ihesinachi K A, et al. OPEN ACCESS Freely available online
Figure 10: Polarization curve of voltage against current density for SMFC with a 10000Ω resistor for 15kg.
Figure 11: Polarization curve of voltage against current density for SMFC with a 10000Ω resistor for 15kg.
Figure 12: Polarization curve of voltage against current for SMFC with a 10000Ω resistor for 20kg.
Figure 13: Polarization curve of voltage against current density for SMFC with a 10000Ω resistor for 20kg.
J Fundam Renewable Energy Appl, Vol. 11 Iss. 1 No: 282 6Ihesinachi K A, et al. OPEN ACCESS Freely available online
Figure 14: Polarization curve of voltage against current density for SMFC with a 10000Ω resistor for 20kg.
conducting electricity. This is confirmed in the voltage output International Conference held by Centre for Waste Valorization
recorded in which a 2V bulb was lit from day 1 to day 4, day 6 and (CVR)-Wastes: Solutions, Treatments and Opportunities, Guimarpes,
day 7 from the10kg, 15kg and 20kg substrates respectively. Portugal, CVR. 2011. September 12th – 14th.
3. Akhator E. P, Obanor A. I, Ezemonye L. I. Electricity Generation
BOD, DO and COD in Nigeria from Municipal Solid Waste using the Swedish waste-to-
Energy Model.J. Appl. Sci. Environ. Manage. 2016; 20:635-643. DOI:
The average biochemical oxygen demand(BOD) for 5kg, 15kgand 10.4314/jasem.v20i3.18
20kg paw-paw waste was 3.61 ± 0.26 mg/L, 3.27 ± 0.19 mg/L, 4. Rabaey K, Boon N, Siciliano S. D, Biofuel cell select for microbial
2.99 ± 0.31 mg/Land 3.49 ± 0.24 mg/L respectively. The 15kg consortia that self-mediate electron transfer. Appl. Environ.
substrate had the lowest BOD values of 3.4 – 2.6 mg/L as well as Microbiol. 2004; 70:5373–5382. DOI: 10.1128/AEM.70.9.5373-
the lowest mean values. This decrease in the BOD values shows 5382.2004
that the microorganisms were able to decompose the paw-paw 5. Pham T. H. Microbial Fuel Cells in Relation to Conventional
waste efficiently thereby releasing enough electrons to sustain the Anaerobic Digestion Technology.Engr. Life Sci. 2006; 6:285 - 292.
generation of the bioelectricity. A decreasing trend was observed Doi: 10.1002/elsc.200620121.
6. Logan B. E, Regan J. M. Electricity-Producing Bacterial communities
in the results obtained for dissolved oxygen (DO).The mean values
in microbial fuel cells.Trends microbial. 2006; 14:512-518. DOI:
recorded for 5kg, 10kg, 15kg and 20kg substrates were 5.49 ± 0.28 10.1016/j.tim.2006.10.003
mg/L, 5.19 ± 0.78 mg/L, 4.99 ± 0.46 mg/L and 4.66 ± 0.26 mg/L 7. WangX, Liao FY,Liu KS. Bioaugumentation for Electricity Generation
respectively. A similar trend of decrease in values was also observed from Corn Stover Biomass using Microbial Fuel Cells.Environ. Sci.
for chemical oxygen demand (COD) with average values of 7.37 ± Technol. 2009; 43:6088–6093. DOI: 10.1021/es900391b
0.37 mg/L, 6.47 ± 0.41 mg/L, 6.04 ± 0.55 mg/L and 6.63 ± 0.63 8. Logrono W, Ramirez G, Recalde C Bioelectricity Generation From
mg/L for 5kg, 10kg, 15kg and 20kg paw-paw waste respectively are Vegetables and Fruits Waste by using a Single Chamber Microbial
shown in Figures 7-14. Fuel Cells with High Andean Soils. Science Energy procedia. 2016;
1:75:2009-2014. DOI: 10.1016/j.egypro.2015.07.259
CONCLUSION 9. Provera M, Han Z, Liaw BY Communication – Electrochemical
Power Generation from Culled Papaya Fruits. J. Electro. Soc. 2016;
The bioelectricity generated from paw-paw fruits and peels waste 163:A1457– A1459. DOI: 10.1149/2.0051608jes
using the single microbial fuel cells (SMFC) was capable of 10. Ghazali N. F,Mahmood N. A. B. N, Ibrahim KAElectricity Generation
powering a 2V bulb. We have been able to achieve the conversion from Palm Oil tree empty fruit bunch (EFB) using Dual Chamber
of paw- paw fruit and peels waste that cause environmental Microbial Fuel Cell (MFC). IOP Conference Series: Materials Sc.
pollution into bioenergy. The real potential of MFCs in electricity Engr. 2017; 206:012025. Doi:10.1088/1757-899x/206/1/012025.
11. Azouma Y. O, Jegla Z, Reppich M Using Agricultural Waste for Biogas
generation has not been fully practiced in Nigeria and this is an
Production as a Sustainable Energy Supply for Developing Countries.
opportunity to explore. It is therefore recommended that green Chem. Engr. Trans. 2018; 70:445-450. Doi:10.3303/CET 1870075.
chemistry technology be employed to boost the generation of 12. Dincer I. Renewable Energy and Sustainable Development.
bioelectricity through the use of single chamber microbial fuel Renewable and Sustainable Energy Reviews 4:157-175.RePEc:eee:re
cells (SMFC) which is a simple and cheap source. We recommend nsus:v:4:y:2000:i:2:p:157-175
that more study be carried out on a large scale for bio-energy 13. Hossain A. B,Mekhled M. A. Biodiesel Fuel Production from
production from other fruit wastes. Waste Canola cooking oil as Sustainable Energy and Environmental
recycling process. Austral J Crop Sci. 2010; 4:543-549. DOI: cropj.
REFERENCES com/sharif233_4_7_2010_543_549
14. Mata T. M, Martins A. A, Ceatano N. S. Microalgae for biodiesel
1. Larhum A.W.D. Limitation and Prospects of Natural Photosynthesis production and otherapplications.Renewable and Sustainable Energy
for Bioenergy Production. Current Opinion in Biotechnology. 2010; Reviews. 2010; 14:217-232. doi.org/10.1016/j.rser.2009.07.020
1:21:271-276. DOI:10.1016/j.copbio.2010.03.004 15. Moqsud M. A, Omine K, Yasufuku N. Microbial fuel cell (MFC) for
2. Carvalho J, Ribeiro A, Castro J Biodiesel Production by Microalgae bioelectricity generation from organic wastes.Waste Management.
and Macroalge from North littoral Portuguese Coast In: 1st 2013; 33:2465-2469. DOI: 10.1016/j.wasman.2013.07.026.
J Fundam Renewable Energy Appl, Vol. 11 Iss. 1 No: 282 7You can also read