ATRIUM EUROPEAN REAL ESTATE - Company overview Q1 trading update June 2018
←
→
Page content transcription
If your browser does not render page correctly, please read the page content below
ATRIUM EUROPEAN REAL ESTATE
                                            • Company overview
                                            • Q1 trading update
                                               June 2018

ATRIUM PROMENADA VISUALISATION | WARSAW
                                                                   1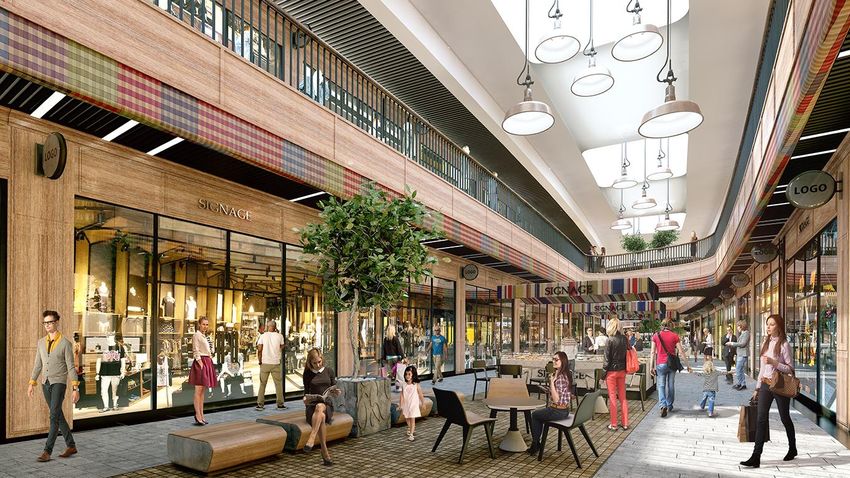
COMPANY OVERVIEW

                   2
ATRIUM – A UNIQUE INVESTMENT OPPORTUNITY
Continued focus on owning high quality assets in well-connected strong urban locations within Central Europe
Heartlands of Poland and the Czech Republic, the region’s largest and strongest economies
Strong management team with a proven track record
Balance sheet 31/03/2018 well placed to support growth initiatives:
32.9% net LTV, financial policy 40% leverage
€49m cash & marketable securities
Investment grade rating by Fitch and S&P, positive outlook Fitch
Balance between solid income producing platform & opportunities for future growth from redevelopment pipeline and portfolio rotation
3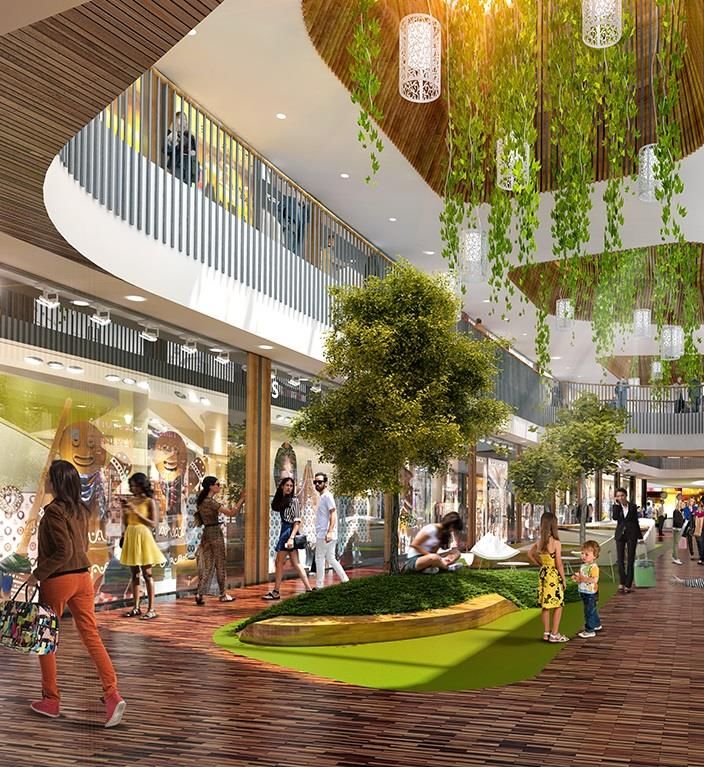
PORTFOLIO REPOSITIONING => URBAN QUALITY

                          31.12.2014                                                 31.03.2018*

              €2.6bn                         PORTFOLIO MARKET VALUE                                  €2.5bn
                153                              NUMBER OF ASSETS                                       38
                8.9                      AVERAGE ASSET SIZE IN GLA (m2)                                 25
                17                          AVERAGE ASSET VALUE (€m)                                    68
              97.1%                               OCCUPANCY (GLA)                                     96.2%
              95.1%                              OPERATING MARGIN                                     98.0%
              €365m                          DEVELOPMENT AND LAND                                    €357m
          21.7%, 3.9%                          NET LTV, COST OF DEBT                              32.9%, 3.4%
                                                                                         €27 cent p.s. (approved for
         €24.0 cent p.s.                                DIVIDEND                           2018) + €14 cent p.s.
                                                                                          special dividend Mar.18
                                           CORPORATE GOVERANANCE &
                                                TRANSPARENCY
                                         AWARDS + FIRST SUSTAINABILITY
                                                   REPORT

*Excl. a €95m asset in Romania (sale agreement signed in Apr. 2018) and a €10m asset in Slovakia (sold in May 2018)   4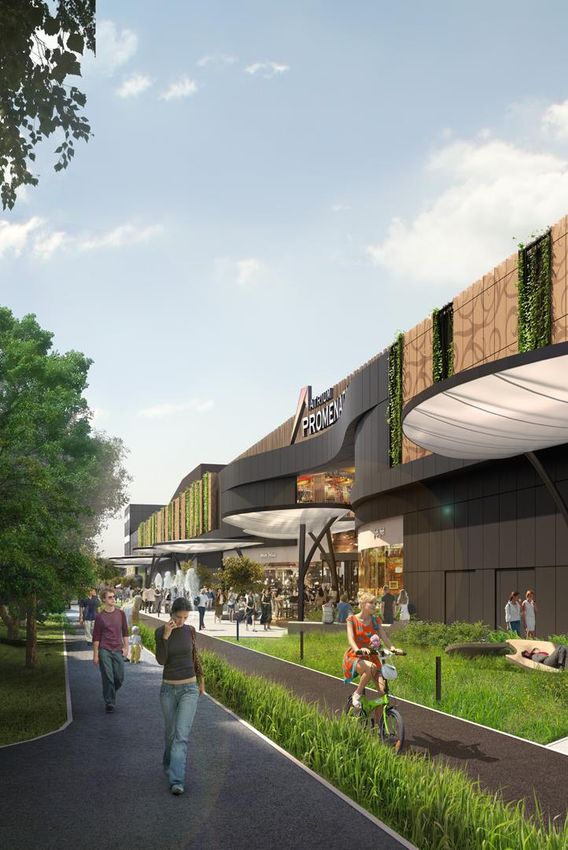
POLAND AND CZECH REPUBLIC – HEART OF THE PORTFOLIO
STANDING INVESTMENT PORTFOLIO SPREAD*
                                                                                         Atrium owns 38* properties, 0.9m sqm GLA and €2.5bn* market value

                                   SLOVAKIA                                              82%* of the portfolio is located in Poland and the Czech Republic, 37% in Warsaw and Prague
  POLAND
                                      2
               RUSSIA                                                                    Focus on high quality assets in strong urban locations at the heart of their communities
  21              7                                   HUNGARY

                                                         4                               Further growth from redevelopment and extension programme in an excess of €300m,
                                                                                         Adding over 60,000 sqm of high quality GLA in Warsaw
                                                                                         Low leverage of 33% net LTV supports growth

                                                                                                                 GEOGRAPHIC MIX OF THE PORTFOLIO*
      THE CZECH
        REP.                                                                                                        60 (1/1/17) → 38* assets as of today
           4                                                                                                                  12%

                                                                                                                      6%                                   Poland

                                                                                                                                                           Czech Republic
                                                                                                                                  MV *
                                                                                                                                 €2.5bn                    Slovakia

                                                                                                                   21%                            61%      Russia

Hungary - 4 residual assets

     *Excl. a €95m asset in Romania (sale agreement signed in Apr. 2018) and a €10m asset in Slovakia (sold in May 2018)
                                                                                                                                                                                5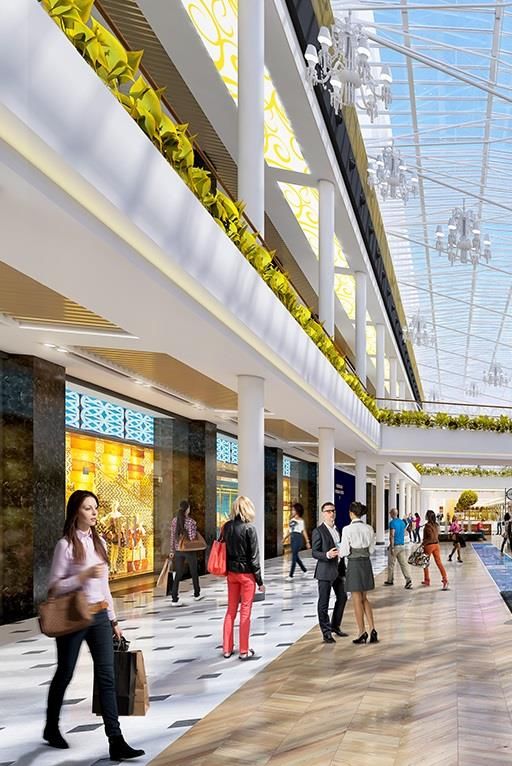
OUR STRATEGY AT THE HEART OF THE LOCAL COMMUNITY

       HIGH QUALITY ASSETS                STRENGTHENING THE PORTFOLIO
    Improving the portfolio through a       Further grow to come from the
   selective rotation of assets towards      ongoing redevelopment and
   high quality assets in strong, urban         extension programme
       locations at the heart of our
               communities

      FOCUS ON PLACEMAKING                         INNOVATION

       Providing a variety of leisure,      To meet the challenges of ever-
     dining and other entertainment        growing ecommerce and changes
                                             in consumer spending habits
     experience elements as well as a
    tenant mix tailored to the centres’
            local environments

                                                                              6
RESILIENT INCOME: STRONG TENANTS, LONG LEASE DURATION AT AN AVERAGE OF 4.8 YEARS*

     TENANT MIX BY ANNUALISED RENTAL INCOME                                                       % of
                                                                 Group                         Annualised   International Sales 2017 € Bn,
                                                                                 Main brands
                                                                 name                            Rental       presence       worldwide
                                      Fashion Apparel (40%)                                    Income**
                    2%   1%
                                      Speciality goods (13%)                                                 1,923 stores/
                   3%                                           AFM                               4%                            52.8
             4%                                                                                              17 countries
                                      Home (11%)
        7%                                                                                                   1,743 stores/
                                                                LPP                               4%                             1.6
                                      Health and Beauty (11%)                                                17 countries
      8%                        40%                              Hennes &                                    4,700 stores/
                                      Hyper/Supermarket (8%)                                      2%                            23.0
                                                                Mauritz                                      69 countries
                                      Restaurants (7%)                                                       2,064 stores/
      11%
                                                                Metro Group                       2%                            58.4
                                                                                                             29 countries
                                      Entertainment (4%)
                                                                                                             7,405 stores/
                                      Services (3%)             Inditex                           2%                            25.3
             11%                                                                                             94 countries
                          13%
                                      Non Retail (2%)                                                       12,300 stores/
                                                                Carrefour                         2%                            88.2
                                                                                                             30 countries
                                      Specialty Food (1%)
                                                                                                            1,194 stores/
                                                                Kingfisher                        1%                            11.2
                                                                                                             10 countries
                                                                                                            12,000 stores /
                                                                A.S. Watson                       1%                            55.4
                                                                                                             20 countries
 E-COMMERCE PENETRATION (2017):
                                                                                                            12,500 stores/
                                                                ASPIAG                            1%                            33.1
                                                                                                             44 countries
 Poland 6%
                                                                CCC                               1%          900 stores         3.5
 The Czech Republic 13%
                                                                Top 10 tenants                    21%

    *As of 31.12.2017
                                                                                                                                             7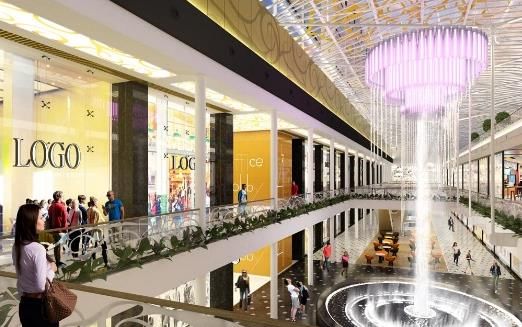
QUALITY UPGRADE VIA REDEVELOPMENTS
Quality growth from over €300m redevelopment and extension programme
Focused on 3 centres in Warsaw, adding over 60,000 sqm GLA in Warsaw
Creating dominant centres with focus on place making
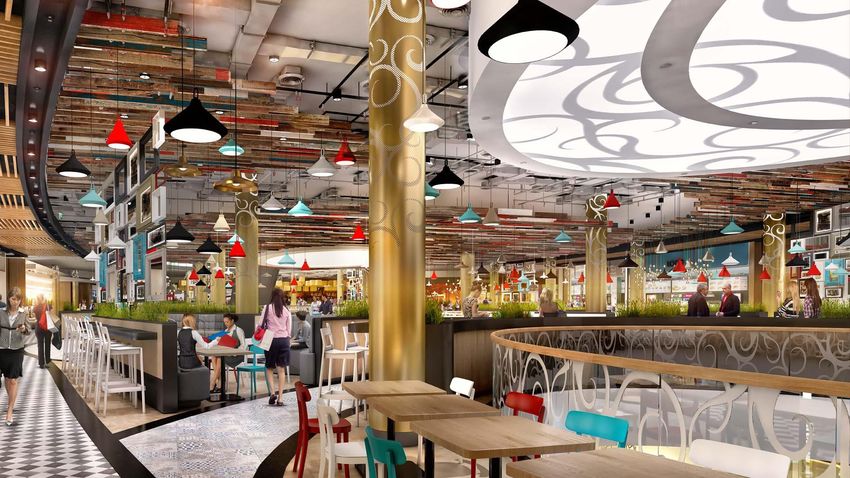
Atrium Promenada (Warsaw) Visualisation Wider offer of leisure, dining and other entertainment tailored to the centres’ local communities and catchment areas
Extensions provide new flagship stores for, among others, Inditex, H&M and LPP (Reserved) brands
High levels of tenant demand for extensions, key tenant leases secured prior to and during construction
INCREMENTAL GLA
K sqm
5.7
8.6 Atrium Promenada 49,600 sqm
28.6
Atrium Targowek 8,600 sqm
Atrium Reduta (Warsaw) Visualisation 13.4 Atrium Reduta 5,700 sqm
7.6
2016 2018 by 2021
Atrium Promenada’s new ‘Fountain Mall’ extension totalling 13,400 sqm, due to open Q4 2018
Atrium Targowek full interior refurbishment, new stores for H&M and Zara. Scheduled to complete in Q4 2018
Atrium Reduta’s new cinema and gym, scheduled for opening by year end
Atrium Targowek (Warsaw) Visualisation 8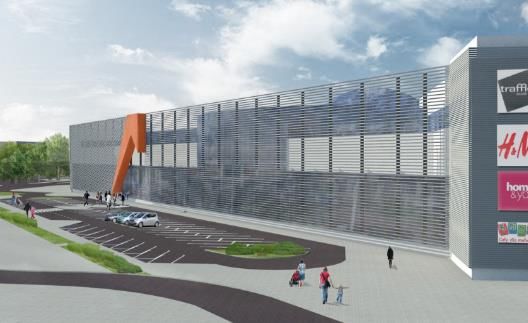
STRATEGIC FOCUS & FUTURE GROWTH

THREE KEY DRIVERS OF FUTURE GROWTH:

      PORTFOLIO REPOSITIONING
      • High quality assets in strong urban locations at the heart of their ommunities
      • Focus on Poland and the Czech Republic

                                                                                                          DIVIDEND CAGR (2010-17)
      REDEVELOPMENTS AND EXTENSIONS                                                      0.50                                                  +19%
      • Fueling Further quality growth
      • Focus on placemaking                                                             0.40                                                                            0.14       0.14
                                                                                                                                                                      Special div. Special div.
                                                                                         0.30                                                     0.36
                                                                                                                              0.32      0.34                 0.33     0.310.27 0.320.27
                                                                                                                    0.28                                         0.27
                                                                                         0.20   0.24      0.25                                        0.24                                        0.14
                                                                                                                                           0.21                                               Special div.
                                                                                                                                 0.17
                                                                                         0.10                          0.14
                                                                                                   0.03      0.12                                                                              0.0675
                                                                                                                                                                                           0.08
                                                                                         0.00
      LIQUIDITY - Significant liquidity available for investments
                                                                                                 2009      2010      2011      2012      2013      2014       2015     2016      2017        Q1
                                                                                                                       Adjusted EPRA EPS              Dividend per share p.a.               2018

                                                                                                €cents 14 per share special dividend paid in March 2018

                                                                                                €cents 27 dividend approved for 2018

                                                                                                                                                                                                         9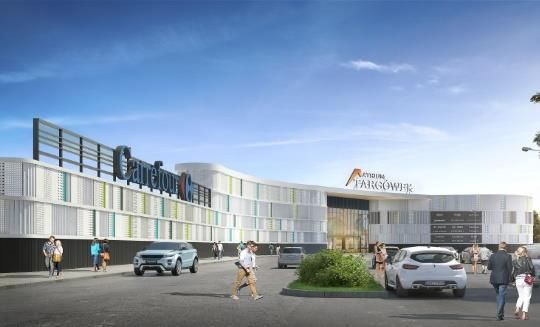
Q1 TRADING UPDATE

                    10
KPIs PERFORMANCE
3M 2018 3M 2017 CHANGE
€M €M %
NRI excl. disposed of assets/redevelopments
32.5 31.0 4.8%
NRI from disposed of assets/redevelopments 14.3 16.6
Net rental income 46.8 47.6 (1.8%)
EPRA Like-for-Like net rental income 32.5 31.3 4.1%
Operating margin (in %) 98.0 96.5 1.5%
EBITDA 41.4 39.8 4.0%
Company adj. EPRA earnings per share (in €cents) 7.9 8.1 (2.5%)
EPRA NAV per share 5.11 5.38 (5.1%)
Special dividends paid per share 0.28 -
EPRA NAV per share excl. special dividend 5.39 5.38 0.02%
11HIGHLIGHTS
OPERATIONAL PERFORMANCE
4.1% LFL NRI growth, 2.5% LFL NRI growth excl. Russia
↑4% EBITDA to €41.4m
DIVESTMENTS
Portfolio repositioning continued: 60 assets (1/1/17) → 38 assets
18 assets in Hungary and 2 in the Czech Republic sold during 2017 and Q1 2018
Apr. 2018: Agreements to sell 2 assets for €105m
€95m Militari in Romania and €10m Saratov in Slovakia @ 9% above fair value
Effective exit of Hungary and Romania
REDEVELOPMENTS
Over €300m redevelopment and extension programme which is focused on 3 centres in Warsaw
OTHERS
€75m increase in the revolving credit facility to €300m with extended maturity by 3 years to 2023
€10m annual cost saving programme on track, to be completed by the end of the year
Admin cost of €5m, 32% lower than in Q1 2017
Legacy legal arrangement: €40m paid to eligible claimants
Poland’s Sunday trading ban has taken effect from 2018, gradual implementation over 3 years
To date footfall largely compensated by increased frequency of visits during the rest of the week
12LFL GROWTH FROM HIGH QUALITY PORTFOLIO
EPRA like-for-like NRI
(in million €)
NRI Q1 2018 per country
2.5% LFL growth excl. Russia
4.1%
31.3 32.5
1.4% 4.1% Poland
Czech Republic
21.8%
Slovakia
Poland &
Russia
3M 2017 3M 2018 the Czech 51.3%
Republic >2/3rd Hungary - Near exit (Q1’18)
Net rental income 5.5%
Romania - exit April 2018
(in million €)
€2.3m disposals and redevelopments impact 15.9%
(1.8%)
49 47 48 47
3M 2015 3M 2016 3M 2017 3M 2018
13ASSETS OVERVIEW-HIGHER QUALITY PORTFOLIO, 21 ASSETS SOLD SINCE 12/2017
Market value of standing investments* Land Portfolio
(in million €) (in million €)
2,683 2,631 2,639 2,493
Land
# of
77 60 46 38* 287
assets 255 229 229
31/12/2015 31/12/2016 31/12/2017 31/03/2018 31/12/2015 31/12/2016 31/12/2017 31/03/2018
82% IN POLAND AND THE CZECH REPUBLIC, 37% IN WARSAW AND PRAGUE MONETISING LAND PORTFOLIO, NOW AT 8% OF INVESTMENT PROPERTIES
*Excl. a €95m asset in Romania (sale agreement signed in Apr. 2018) and a €10m asset in Slovakia (sold in May 2018) 14STRONG OPERATIONAL PERFORMANCE
Company Adjusted EPRA Earnings EBITDA margin @ 89%
(in million €) (in million €)
€2.3m disposals and redevelopments impact Improved operating margin following the cost saving programme
(3%) 4%
41 40 41
30 30 35
29 30
6.1/ 5.6/ 5.4/ EPRA NAV per
5.1/
4.4 3.5 3.8 4.0 share/Share 84% 74% 84% 89% EBITDA as % of NRI
price at 31 Mar.
3M 2015 3M 2016 3M 2017 3M 2018 3M 2015 3M 2016 3M 2017 3M 2018
EPRA NAV
(28%) (38%) (30%) (22%)
discount
Company Adjusted EPRA Earnings per share and Dividend per share
(in € cents)
(3%)
8.1 7.6 8.1 7.9
6.8 6.8 6.8 6.8 Company adj. EPRA
earn. per share
Dividend per share
84% 89% 83% 86% Dividend payout ratio
(% of Adj. EPRA earnings)
3M 2015 3M 2016 3M 2017 3M 2018
15CAPITAL STRUCTURE SUPPORTS GROWTH
Cash and marketable securities of €49m (31/12/17: €92m)
€75m increase in revolving credit facility to €300m with an expiry in 2023
↓€2m in financial expenses compared to Q1 2017- bank refinancing in 2017 and impact of foreign currency differences
LTV (net) Borrowings Debt maturities
(in million €)
3.4% cost of debt
Long term target at around 40%
4.4 years average maturity
32.9% 84% unencumbered standing investments
30.1%
28.7%
26.3%
€969m
Total debt
501
334
127
2020 2022 2027
Bonds €834m Loan €135m Bonds Bank Loans
31/12/2015 31/12/2016 31/12/2017 31/03/2018
16STRONG OPERATIONAL PERFORMANCE IN Q1 2018
PERFORMANCE
↑4.1% LFL NRI growth, ↑2.5% excl. Russia
Strong EBITDA of €41m, 89% EBITDA margin
↓€2m admin. in Q1 2018 following €10m the cost saving programme initiated in March 2017
PORTFOLIO
Portfolio repositioning led to 38* assets as of today @ €2.5bn value
Effective exit of Hungary and Romania
Redevelopments – 3 openings in Warsaw by the end of 2018
Pursuing acquisition targets
CAPITAL MANAGEMENT
€75m increase in revolving credit facility to €300m, unutilised to support growth
€cents 14 per share special dividend paid in March 2018
OTHERS
Legacy legal arrangement: payments to eligible claimants are in progress with €40m paid
to date and €4m estimated to pay
*Excl. a €95m asset in Romania (sale agreement signed in Apr. 2018) and a €10m asset in Slovakia (sold in May 2018) 17APPENDIX 1 – KPIs PERFORMANCE FY 2017
18KPIs PERFORMANCE FY 2017
12M 2017 12M 2016 CHANGE
€M €M %
Net rental income 189.9 188.8 0.6%
EPRA Like-for-Like net rental income 145.8 137.0 6.4%
Operating margin (in %) 95.6 96.4 (0.8%)
EBITDA 159.9 113.5 40.8%
Company adj. EPRA earnings per share (in €cents) 32.4 31.4 3.2%
EPRA NAV per share 5.24 5.39 (2.8%)
Special dividends paid per share 0.14 -
EPRA NAV per share excl. special dividend 5.38 5.39 (-)
19APPENDIX 2 – SUSTAINABILITY
20SUSTAINABILITY – IT MATTERS: OUR CUSTOMERS, OUR PLACES, OUR PEOPLE
Atrium is committed to sustainable growth, reflecting our long-term business approach and our dedication to corporate citizenship
We strive for economic efficiency, social fairness and environmental sustainability in all our endeavours
Atrium’s sustainability vision is to lead the CEE market, and to continue to create value for all our stakeholders
Our strategy is centred around three focus areas – our customers, our assets, and our employees
Atrium’s sustainability achievements include:
Our 1st ever participation in GRESB resulting in a “Green Star” ranking (2017)
The EPRA Gold award for our financial reporting standards and transparency (2016)
Our first Sustainability Report , “It Matters”, in line with the EPRA best practice recommendations (2017)
We will continue to increase our efforts, to participate in GRESB, and to promote transparency and environmental regulation in the real estate sector
UNDERSTAND CUSTOMER PROVIDE SAFE AND HEALTHY DEVELOP AND ENGAGE
BEHAVIOUR AND MEET SPACES THAT OPERATE EFFICIENTLY EMPLOYEES WHO ARE PROUD
EXPECTATIONS TODAY AND BY STIMULATING INNOVATION AND TO WORK FOR US AND
IN THE FUTURE OPTIMUM DESIGN EMBRACE OUR ATRIUM VALUES
For more information on our sustainability strategy , as well as our sustainability reports, please see our website www.aere.com/sustainability
21DISCLAIMER
This document has been prepared by Atrium (the “Company”). This document is not to be reproduced nor distributed, in whole or in part,
by any person other than the Company. The Company takes no responsibility for the use of these materials by any person.
The information contained in this document has not been subject to independent verification and no representation, warranty or
undertaking, express or implied, is made as to, and no reliance should be placed on, the fairness, accuracy, completeness or correctness of
the information or opinions contained herein. None of the Company, its shareholders, its advisors or representatives nor any other person
shall have any liability whatsoever for any loss arising from any use of this document or its contents or otherwise arising in connection
with this document.
This document does not constitute an offer to sell or an invitation or solicitation of an offer to subscribe for or purchase any securities, and
this shall not form the basis for or be used for any such offer or invitation or other contract or engagement in any jurisdiction.
This document includes statements that are, or may be deemed to be, “forward looking statements”. These forward looking statements
can be identified by the use of forward looking terminology, including the terms “believes”, “estimates”, “anticipates”, “expects”, “intends”,
“may”, “will” or “should” or, in each case their negative or other variations or comparable terminology. These forward looking statements
include all matters that are not historical facts. They appear in a number of places throughout this document and include statements
regarding the intentions, beliefs or current expectations of the Company. By their nature, forward looking statements involve risks and
uncertainties because they relate to events and depend on circumstances that may or may not occur in the future. Forward looking
statements are not guarantees of future performance. You should assume that the information appearing in this document is up to date
only as of the date of this document. The business, financial condition, results of operations and prospects of the Company may change.
Except as required by law, the Company do not undertake any obligation to update any forward looking statements, even though the
situation of the Company may change in the future.
All of the information presented in this document, and particularly the forward looking statements, are qualified by these cautionary
statements. You should read this document and the documents available for inspection completely and with the understanding that actual
future results of the Company may be materially different from what the Company expects.
This presentation has been presented in € and €m’s. Certain totals and change movements are impacted by the effect of rounding.
ATRIUM FLORA | PRAGUE
22THANK YOU
ATRIUM PROMENADA VISUALISATION | WARSAW
23You can also read