ROADSHOW PRESENTATION - 9M 2019 - November 2019 - Airbus
←
→
Page content transcription
If your browser does not render page correctly, please read the page content below

9M 2019
ROADSHOW
PRESENTATION

November 2019
SAFE HARBOUR STATEMENT DISCLAIMER This presentation includes forward-looking statements. Words such as “anticipates”, “believes”, “estimates”, “expects”, “intends”, “plans”, “projects”, “may” and similar expressions are used to identify these forward-looking statements. Examples of forward-looking statements include statements made about strategy, ramp-up and delivery schedules, introduction of new products and services and market expectations, as well as statements regarding future performance and outlook. By their nature, forward-looking statements involve risk and uncertainty because they relate to future events and circumstances and there are many factors that could cause actual results and developments to differ materially from those expressed or implied by these forward-looking statements. These factors include but are not limited to: Changes in general economic, political or market conditions, including the cyclical nature of some of Airbus’ businesses; Significant disruptions in air travel (including as a result of terrorist attacks); Currency exchange rate fluctuations, in particular between the Euro and the U.S. dollar; The successful execution of internal performance plans, including cost reduction and productivity efforts; Product performance risks, as well as programme development and management risks; Customer, supplier and subcontractor performance or contract negotiations, including financing issues; Competition and consolidation in the aerospace and defence industry; Significant collective bargaining labour disputes; The outcome of political and legal processes including the availability of government financing for certain programmes and the size of defence and space procurement budgets; Research and development costs in connection with new products; Legal, financial and governmental risks related to international transactions; Legal and investigatory proceedings and other economic, political and technological risks and uncertainties. As a result, Airbus’ actual results may differ materially from the plans, goals and expectations set forth in such forward-looking statements. For a discussion of factors that could cause future results to differ from such forward-looking statements, see the 2018 Airbus SE Registration Document dated 29 July 2019, including the Risk Factors section. Any forward-looking statement contained in this presentation speaks as of the date of this presentation. Airbus undertakes no obligation to publicly revise or update any forward-looking statements in light of new information, future events or otherwise. Rounding disclaimer: Due to rounding, numbers presented may not add up precisely to the totals provided and percentages may not precisely reflect the absolute figures.

3

AIRBUS AT A GLANCE – AS OF FY18
                                                                                   Deliveries by Programme
                                         Airbus                                              (units)

                                                                                                             A320 78%
  Consolidated Airbus                                     Passenger Aircraft,                                A350 12%
   External Revenue by Division                           Freighter Conversion,                              A330       6%
                                                                Services
                                                                                                             A220       3%
                                                                                                             A380       1%

                                       Helicopters                                 External Revenue Split

         € 63.7 bn                                                                                           Platforms
                                                        Civil / Parapublic and                               59%
       t/o defence € 9.9 bn
                                                         Military Helicopters
                                                          for a wide range of                                Services
                                                        missions, Support and                                41%
                                                                Services

                                                                                   External Revenue Split
       Airbus                 74%
       Helicopters             9%
                                    Defence and Space
       Defence and Space      17%                                                                            Platforms
                                                                                                             70%
                                                        Military Aircraft, Space
                                                           Systems, Comms,                                   Services
                                                             Intelligence and                                30%
                                                         Security, Unmanned
                                                              Aerial Systems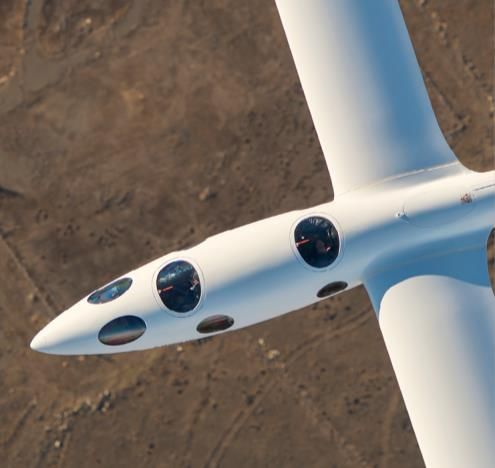
4

9M 2019 HIGHLIGHTS

      Solid commercial aircraft environment

      9m financials mainly reflect A320neo ramp-up and progress on A350

      Focus on ACF ramp-up and a more efficient delivery flow in 2019 and
      beyond

      2019 Guidance updated to reflect latest delivery and FCF outlook;
      EBIT Adjusted guidance maintained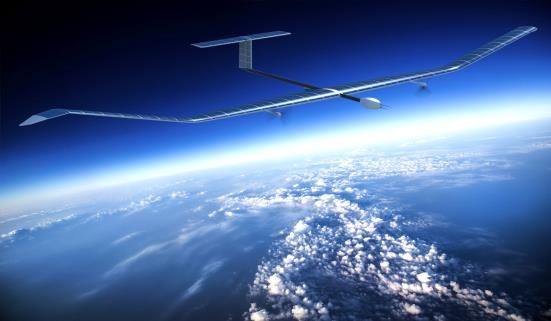
5

9M 2019 COMMERCIAL POSITIONING

                Consolidated Airbus Order Book                                     Consolidated Airbus
                            by Division
                                                                                    External Revenue
                                                                                                 by Division
                                                      9m 2019

                               Order Intake (net)          127
   Airbus
   (in units)
                               Order Book                7,133

                               Order Intake (net)          173                               € 46.2 bn
   Helicopters
   (in units)
                                                                                              t/o defence
                               Order Book                  681                                  € 6.2 bn

   Defence and Space
                               Order Intake (net)        6,064
   (in € m)

                                                                                        Airbus                 76%
                                                                                        Helicopters            7%
                                                                                        Defence and Space      17%

   AIRBUS: 303 gross orders, incl. 90 in Q3. 127 net orders in 9m. Backlog: 7,133 a/c

   HELICOPTERS: 173 net orders, incl. 12 H135 in Q3

   DEFENCE AND SPACE: Order intake € 6.1 bn, incl. key contract wins in Space
9M 2019
               Market   Product       9M 2019
               Demand   Positioning   Review
ROADSHOW
PRESENTATION
7

A ROBUST COMMERCIAL AIRCRAFT ENVIRONMENT

                                     4.3%                             25,000
                                       annual                              Grow
                                       growth                                                       39,210
                                                                                                    Deliveries

                                                                      14,210
                                   22,680                               Replace
                                     Fleet in
                                     service
                                                                        8,470                        ~39k
                                                                            Stay
                                                                                                  New deliveries
                                       2019                                                2038
                                                 Strong & Resilient passenger traffic growth:
                                               ~40% of deliveries for replacement, ~60% for growth

Notes: Passenger aircraft (≥100seats), Freighters (>10t) | Rounded figures to nearest 10
Source: Airbus GMF 2019
Box sizes for illustrative purposes only
8

LONG-TERM GROWTH FUELLED BY MIDDLE-CLASS EXPANSION
IN EMERGING ECONOMIES

2018 100
      trips per capita                                                                              Bubble size proportional
                                                                                                    to population
                    100                                                                                                            Bubble s
                                                                                                     Africa
                                                                                                                                   to popula
                                                                                                     Asia/Pacific
          10
                                                                                                     CIS                            Africa
                                                                                                     Europe
                                                                                                                                    Asia/Pa
                     10                                                                              Latin America
                                                                                                                                    CIS
                                                                                                     Middle East
            1
                0                     50                     100          150   200        250       North America                  Europe
                                                                                                                                    Latin A
                                                                                                                                    Middle
          0.1
                      1                                                               2018 real GDP per capita
                          0                        50               100         150   (2015 $US 200                      250 Parity) North A
                                                                                                thousands at Purchasing Power

        0.01
                    0.1

                0.01

Source: Sabre, IHS Markit, Airbus GMF 2019
Equivalent amount of passengers flying from/to/within the country
9M 2019
               Market   Product       9M 2019
               Demand   Positioning   Review
ROADSHOW
PRESENTATION
10

COMPETITIVE AIRCRAFT PORTFOLIO UNDERPINS RECORD
BACKLOG
                                              Solid and well diversified Backlog*
                                                        7,133 aircraft
                                                                         23%
                                                                   16%
                                   13%        17%
                                                                                                   42%
                                                                     Europe
                                                                                            26%
                                          North                       & CIS   8%       8%
                                         America

                                                                              Middle-East
                                                                                               Asia
                                                                                              Pacific

                                                                    1%        3%
                                                 7%           7%     Africa

                                                      Latin
                                                     America                                              20%

             % Backlog as of end of September 2019
             % Share of 2019-2038 new deliveries (GMF 2019)                                              Lessors

                                               Airbus backlog* aligned with
                                           regional needs and demand forecast
 * Commercial aircraft
 9% of undisclosed customers
11
STEADY RAMP-UP IN A ROBUST COMMERCIAL ENVIRONMENT
Backlog O&D
8,000 1,600
7,000 1,400
6,000 1,200
5,000 1,000
4,000 800
800
3,000 688 718 600
588 626 629 635
2,000 498 510 534 400
434 453 483
378
1,000 320 200
0 0
2004 2005 2006 2007 2008 2009 2010 2011 2012 2013 2014 2015 2016 2017 2018
Book-to-bill 1.1 2.8 1.8 3.0 1.6 0.5 1.1 2.7 1.4 2.4 2.3 1.7 1.1 1.5 0.9
Cancellations* (%) 0.3 2.6 1.3 3.4 3.3 1.1 2.0 4.3 1.7 1.5 3.8 0.9 2.1 1.7 1.1
Backlog Deliveries Net orders Average net order [2004-2018]
Growing backlog while ramping-up deliveries
to meet customer demand
* Cancellations (excluding conversions) / backlog12
HELICOPTERS: MARKET AND PRODUCT POSITIONING
CIVIL & PARAPUBLIC MILITARY AIRCRAFT
Demand impacted by softness in O&G Military market supported by growing Defence
MARKET
budgets
LT market potential: ~ 22k new h/c in next 20 years
Successful campaigns in 2018
UAM new market
PRODUCTS
Product renewal strategy: H135, H145, H160, Unique product offering addressing wide range
H175 of missions and classes
Wide mission coverage Military offers based on proven Civil technology
Renewed product portfolio and global market presence13
DEFENCE AND SPACE: MARKET AND PRODUCT POSITIONING
MILITARY AIRCRAFT SPACE SYSTEMS CIS* UAS*
Geopolitical instability leading Space spending on the rise National sovereignty demands Strong need for investment
to increased security needs digital solutions, secured and promising growth potential
Dynamic shift of space market
connectivity and cyber protection
MARKET
Defence spending at all time (new space economy, New multi-national European
high with further growth constellations, exploration) Security and information as a collaborative programme
expected service
Future ambitions of national Services verticals will offer
Defence investment cycles to space agencies and ESA Disruptive business driven by AI, increasingly interesting
kick-start in European markets Big Data and Advanced Analytics prospects
Strategic Air Mobility, Tactical Telecommunications, Earth Develop and scale digital MALE Intelligence,
and Multi-Mission Military Observation, Navigation and services and solutions Surveillance &
PRODUCTS
Aircraft Science Satellites Reconnaissance needs
Cyber Security (Stormshield)
(European Male)
Evolution of Combat Air Constellations (e.g. OneWeb)
Intelligence (C5ISR, Pléiades
Systems Solar powered High Altitude
Manned and unmanned space Neo & OneAtlas)
(Future Combat Air Systems) Pseudo Satellite (Zephyr)
systems for orbital infrastructure
Secure Connectivity
Expanding services business UAS turnkey service solution
On-Orbit Services Solutions (Network For The Sky)
with focus on digitalisation
Urban Air Mobility
Strengthening core product portfolio and expanding the smart-digital services business
*CIS: Communication, Intelligence and Security
*UAS: Unmanned Aerial Systems14
LEVERAGING DIGITAL IN ALL AREAS OF OUR BUSINESS
Skywise Data exploitation Connectivity
Driving further industrial efficiency
Improving reliability of assets in use
for customer benefit
Generating new business opportunities9M 2019
Market Product 9M 2019
Demand Positioning Review
ROADSHOW
PRESENTATION16
KEY PROGRAMME UPDATE
• Programme fully consolidated into Airbus since July 1st 2018.
A220 • 90 aircraft in operation. Backlog of 435 aircraft.
• Focusing on commercial momentum, production ramp-up and cost reduction.
• Backlog of 5,700+ aircraft supports our ramp-up.
• Progressing on A321 ACF ramp-up which remains challenging.
A320 • Focusing on securing a more sustainable delivery flow towards R63 in 2021.
• Continuing to study potential further rate increases beyond 2021.
• Backlog of 278 aircraft. Progressing on Neo transition with 26 deliveries in 9m’19.
A330 • A330-800 Type Certification expected early 2020.
• Backlog of 601 aircraft. Production stabilized at around 10 a month.
A350 • Good progress on recurring cost convergence.
• On track to reach our breakeven target in 2019.
• Progressing on Programme wind-down and securing in-service support for the next
A380 decades
• In-service fleet: 84 aircraft.
• Several key milestones towards full capability achieved in Q3’19
A400M • Continuing with development activities as agreed in the revised capability roadmap
• Retrofit activities progressing in line with the customer agreed plan
• Challenges remain, particularly on exports.17
9M 2019 FINANCIAL PERFORMANCE
Revenues EBIT Adjusted
in € bn in € bn / RoS (%)
9.0%
6.8%
46.2
40.4 4.1
2.7
9m 2018 9m 2019 9m 2018 9m 2019
EPS(1) Adjusted FCF before M&A and Customer Financing
in € in € bn
(4.2)
(4.9)
3.75
2.31
9m 2018 9m 2019 9m 2018 9m 2019
(1) 9m 2019 weighted average number of shares: 776,697,534 compared to 774,762,268 in 9m 2018
Capitalised R&D: € 78 m in 9m 2019 and € 61 m in 9m 2018
2018 figures include A220, consolidated into Airbus as of 1 July 201818
9M 2019 PROFITABILITY
EBIT Performance
in € bn 9m 2019 EBIT Reported of € 3.4 bn
9m 2019 EBIT Adjustments resulting from:
€ – 253 m PDP mismatch / BS revaluation
4.13
3.43
€ – 221 m Defence export ban
2.74 2.68
€ – 158 m A380 programme cost
EBIT Adjusted EBIT Reported
€ – 70 m Others
9m 2018 9m 2019 9m 2019 Net Adjustments of € − 702 m
EPS(1) Performance
in €
9m 2019 Net Income of € 2,186 m
3.75
9m 2019 Net Income Adjusted of € 2,912 m
2.81
2.31
1.88
9m 2019 tax rate on core business is 27%
EPS Adjusted EPS Reported
9m 2018 9m 2019
(1) 9m 2019 weighted average number of shares: 776,697,534 compared to 774,762,268 in 9m 2018
Capitalised R&D: € 78 m in 9m 2019 and € 61 m in 9m 2018
2018 figures include A220, consolidated into Airbus as of 1 July 201819
CURRENCY HEDGE POLICY Forward Sales as of Sep. 2019
Collars as of Sep. 2019
IN $ BILLION 2.5
Forward Sales and Collars as of Dec. 2018
1.7
17.4
27.1
22.2 20.7
19.4
7.4
2019 2020 2021 2022 2023
Average hedge rates remaining 3 months FY FY FY and beyond
€ vs $ 1.20 (1) 1.21 1.23 1.23 1.24
Forwards/Collars (2) ( 1.23 for FY19 in Dec. 18 ) ( 1.23 in Dec. 18 ) ( 1.24 in Dec. 18 ) ( 1.27 in Dec. 18 ) ( 1.30 in Dec. 18 )
£ vs $ 1.30 1.37 1.36 1.35 1.40
Mark-to-market value incl. in AOCI = € - 5.5 bn
In 9m 2019, $ 37.5 bn(2) of new Forwards were added at an average rate of € 1 = $ 1.21 Closing rate @ 1.09 € vs. $
$ 17.4 bn(2) of hedges matured at an average rate of € 1 = $ 1.26
Hedge portfolio(2) 30 September 2019 at $ 101.0 bn (vs. $ 81.9 bn in Dec. 2018), at an average rate of $ 1.22(3)
In 9m, $ 5.1 bn of hedges rolled over intra-year to align with backloaded delivery profile
In addition, $ 3.4 bn of hedges rolled over from 2019 into 2020
Approximately 60% of Airbus US$ revenues are naturally hedged by US$ procurement. Graph shows US$ Forward Sales and Collars
Hedge rates reflect EBIT impact of the US$ hedge portfolio
(1) Full year 2019 hedge rate expected at an average rate of € 1 = $ 1.24 as of 30 September 2019;
(2) Total hedge amount contains $/€ and $/£ designated hedges; (3) Blended Forwards and Collars rate includes Collars at least favourable rate20
9M 2019 CASH EVOLUTION
IN € BILLION
+4.5
-1.4
-8.2
13.3 -1.2 -0.2 +0.1
Free Cash Flow before M&A: € - 4.9 bn -1.3
t/o Customer Financing: € 0.0 bn
Free Cash Flow before M&A and 5.6
Customer Financing € - 4.9 bn
Net Cash IFRS 16 Gross Cash Change in Cash used for M&A(2) Shareholder Pensions & Net Cash
Position Implementation Flow from Working Capital investing Return Others Position
December 2018 Operations activities before September 2019
M&A (1)
IFRS 16 implemented 1 January 2019
(1) Thereof Capex of € – 1.5 bn
(2) M&A transactions include acquisitions and disposals of subsidiaries and businesses21
2019 GUIDANCE
As the basis for its 2019 guidance, Airbus expects the world economy and air traffic to grow in line
with prevailing independent forecasts, which assume no major disruptions
Airbus 2019 Earnings and FCF guidance is before M&A
Airbus now targets around 860 commercial aircraft deliveries in 2019, which reflects the updated
delivery schedule
On that basis:
Airbus maintains its expected increase in EBIT Adjusted of approximately +15%
compared to 2018
Airbus now expects FCF before M&A and Customer Financing of approximately € 3 bn22
KEY PRIORITIES
Focus on deliveries in 2019 and beyond
Ramp-up A320neo, including ACF
Improve A350 margins
Improve programme execution across businesses
Services, Digital and Innovation
Deliver Earnings and FCF growth potential23
DELIVER EPS & FCF GROWTH POTENTIAL
2018 - 2021
EPS FCF Future Growth
Growth Growth Potential
A320neo
EPS Growth A350
Volume & Price
Margin improvement
A350
A400M*
Turning Profitable
2021+ A320 Higher
Rate potential
Boost
A220**
Competitiveness
Boost
Investment in Working Capital
Competitiveness
Digital & Innovation Control
* A400M will continue to weigh until 2021.
* * A220 will continue to weigh until 2021. Partnership funding arrangement not included in FCF
Box sizes for illustration purpose onlyYou can also read