Ali Engel, Chief Financial Officer - June 2018 - Gannett Investor ...
←
→
Page content transcription
If your browser does not render page correctly, please read the page content below
June 2018
Ali Engel, Chief Financial Officer

Disclaimers
 This presentation may include certain forward-looking statements regarding business strategies, market potential, future financial performance and other matters. Forward-looking
 statements include all statements that are not historical facts. The words “believe,” “expect,” “estimate,” “could,” “should,” “intend,” “may,” “plan,” “seek,” “anticipate,” “project” and
 similar expressions, among others, generally identify forward-looking statements, which speak only as of the date the statements were made and are not guarantees of future
 performance. Where, in any forward-looking statement, an expectation or belief as to future results or events is expressed, such expectation or belief is based on the current plans and
 expectations of our management and expressed in good faith and believed to have a reasonable basis, but there can be no assurance that the expectation or belief will result or be
 achieved or accomplished. Whether or not any such forward-looking statements are in fact achieved will depend on future events, some of which are beyond our control. The matters
 discussed in these forward-looking statements are subject to a number of risks, trends, uncertainties and other factors that could cause actual results to differ materially from those
 projected, anticipated or implied in the forward-looking statements. These factors include, among other things:

 •   our ability to achieve our strategic transformation;
 •   an accelerated decline in general print readership and/or advertiser patterns as a result of competitive alternative media or other factors;
 •   an inability to adapt to technological changes or grow our digital businesses;
 •   risks associated with the operation of an increasingly digital business, such as rapid technological changes, frequent new product introductions, declines in web traffic levels,
     technical failures and proliferation of ad blocking technologies;
 •   macroeconomic trends and conditions;
 •   competitive pressures in the markets in which we operate;
 •   increases in newsprint costs over the levels anticipated or declines in newsprint supply;
 •   potential disruption or interruption of our IT systems due to accidents, extraordinary weather events, civil unrest, political events, terrorism or cyber security attacks;
 •   variability in the exchange rate relative to the U.S. dollar of currencies in foreign jurisdictions in which we operate;
 •   risks and uncertainties related to strategic acquisitions or investments, including distraction of management attention, incurrence of additional debt, integration challenges, and
     failure to realize expected benefits or synergies or to operate businesses effectively following acquisitions;
 •   our ability to consummate the acquisition of WordStream on a timely basis or at all;
 •   risks and uncertainties associated with our ReachLocal segment, including its significant reliance on Google for media purchases, its international operations and its ability to develop
     and gain market acceptance for new products or services;
 •   our ability to protect our intellectual property or defend successfully against infringement claims;
 •   our ability to attract and retain employees;
 •   labor relations, including, but not limited to, labor disputes which may cause business interruptions, revenue declines or increased labor costs;
 •   risks associated with our underfunded pension plans;
 •   adverse outcomes in litigation or proceedings with governmental authorities or administrative agencies, or changes in the regulatory environment, any of which could encumber or
     impede our efforts to improve operating results or the value of assets;
 •   volatility in financial and credit markets which could affect the value of retirement plan assets and our ability to raise funds through debt or equity issuances and otherwise affect
     our ability to access the credit and capital markets at the times and in the amounts needed and on acceptable terms; and
 •   other uncertainties relating to general economic, political, business, industry, regulatory and market conditions.

 A further description of these and other important risks, trends, uncertainties and other factors is provided in the company’s filings with the U.S. Securities and Exchange Commission,
 including the company’s annual report on Form 10-K for fiscal year 2017 and quarterly report on Form 10-Q for the first quarter of fiscal 2018. Any forward-looking statements should be
 evaluated in light of these important risk factors. The company is not responsible for updating or revising any forward-looking statements, whether as a result of new information,
 future events or otherwise, except as required by law.
GANNETT                                                                                                                                                                                          2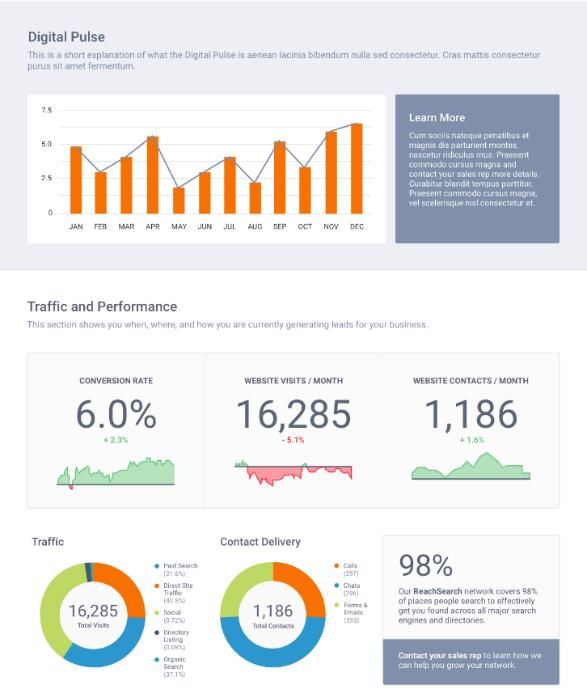
Gannett Overview

                                                               2017A Financial Summary
    $3BN Revenue $1BN Digital Revenue $360MM Adjusted EBITDA $1BN Market Capitalization

           BUSINESSES                                                                                               CONSUMERS

  • Growing Digital                                                    PREMIUM LOCAL NEWS BRANDS              • High-Quality Trusted
    Revenues                                                                                                    Content at Scale

  • $2BN+ of 2017A                                                                                            • $1BN+ of 2017A
    Advertising and                                                         NATIONAL PRESENCE                   Subscription Revenue
    Services Revenue
                                                                                                              • 127MM+ Monthly
  • $700MM+ in                   2017A(1)                                                                       Unique Visitors (2)
    Digital Advertising                                        ROBUST DIGITAL MARKETING SOLUTIONS OFFERINGS

    Revenues

GANNETT   (1) Includes ReachLocal and corporate eliminations                                                                           3
          (2) Per Comscore, as of April 2018
Nationwide Digital Marketing Solutions Provider

                                       Managed Service                                               Pending Acquisition (1) of        Self Service
                                                                                                                        BUSINESSES
                                        “Do-it-for-Me”                                                                               “Do-it-Yourself”

  $359MM             19,000                                    ~2                                     $55MM                 29%             3,400
                                                   Average Products
    2017 Revenue    Active Clients                                                                   NTM* Revenue        EBITDA Margin     Active Clients
                                                       / Client

          End-to-End Suite of Digital Marketing Solutions for SMBs at Any Stage

                                                                                                                             DIGITAL MARKETING
           DIGITAL ADVERTISING                                               WEB PRESENCE
                                                                                                                                  SOFTWARE

    ▪ Search        ▪ Geotargeting                         ▪ SEO                                     ▪ Listings         ▪ Lead Management
    ▪ Social Ads    ▪ Retargeting                          ▪ Websites                                ▪ Reviews          ▪ Marketing Automation
    ▪ Display Ads                                          ▪ Live Chat                                                  ▪ Analytics

                        Note: NTM = next twelve months
GANNETT                                                                                                                                                     4
                        (1) Subject to regulatory clearance and other customary closing conditions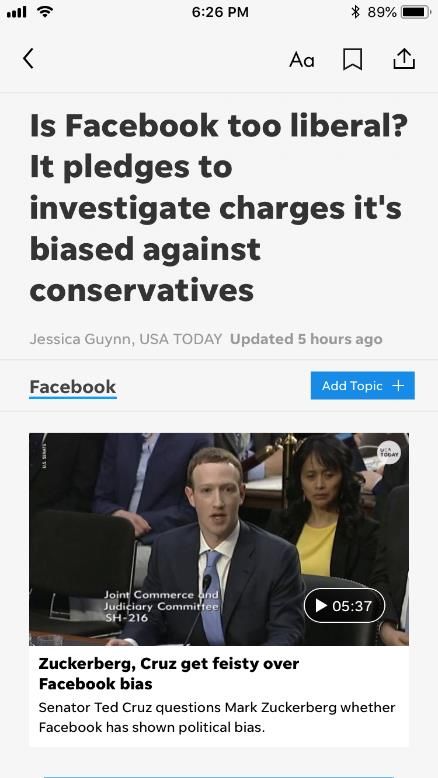
A Large, Growing Local Digital Advertising Market…

                                                                                                                ~9MM
                                                                                                              SMBs in the U.S.

                                                                                                     $76.3B
                                                                                            $70.4B
                                                                                   $63.8B
                                                    $57.2B
                  $50.2B

                    2017                               2018                        2019     2020     2021

GANNETT   Source: BIA Kelsey: U.S. Local Advertising Forecast 2017; IAB/Borrell.                                                 5
…That is Increasingly Complex for SMBs to Manage

                                                                                   “I don’t have
                                                                                   enough time”

                                              75%
                                            of SMBs                              “I don’t know how
                                       Advertise Digitally…                           to do it”

                                    …But Run into
                                                                                  “I don’t have
                                   Numerous Issues
                                                                                    necessary
                                                                                   personnel”

GANNETT   Source: IAB/Borrell; ReachLocal Survey Data – 2017; LSA Pulse Survey                       6
USA TODAY NETWORK Overview

The USA TODAY NETWORK delivers tremendous nationwide reach through strong, trusted national,
local and passion brands that form the foundation of our local-to-national network strategy

          Local                                                                                        USA TODAY
  ▪ 12MM Local Sunday                                        Local                   USA TODAY   ▪ 3MM USA TODAY Average
    Readership                                                                                     Daily Print Readership

  ▪ 42MM Average Monthly                                                                         ▪ 97MM Average Monthly
    Unique Visitors                                                        Passion                 Unique Visitors

  ▪ 109 Local Markets                                                                            ▪ 25MM Mobile App
                                                                                                   Downloads

GANNETT             Source: comScore (April 2018), MRI, AAM, Scarborough                                                    7
USA TODAY NETWORK Overview

                          Tangible Value for Advertisers and Consumers

  Significant USA TODAY NETWORK Scale                           Top News Destination for Millennials   Leading User Engagement
   Avg. Monthly Unique Visitors (millions)                        Monthly Unique Visitors (millions)      Page Views per Visit

                                  127
                                                                    37            35
                   117                                                                         27      2.8
      110                                                                                                         2.3            2.1

     2016          2017        YTD 2018

GANNETT                        Source: comScore (April 2018).                                                                          8
Largest Local Media Organization in the United States
Wisconsin
Des Moines (90)
WA Rochester (52)
ND ME
MT MN
Key Highlights OR ID Milwaukee (40)
Detroit (14)
NY VT
NH Westchester
SD MA
▪ #1 or #2 local news WY
WI
CT
RI
website in most CA
MI
NJ
PA
markets
NE IA
NV
UT IL DE
MO IN OH WV
CO MD
▪ 32% millennial audience KS VA Cincinnati (28)
across top markets AZ
KY
NC Indianapolis (35)
NM OK TN
▪ 1,500+ FTE Sales AR
AL Louisville (45)
Organization
MI SC
GA Knoxville (65)
▪ 3,000+ Journalists Guam Phoenix (12)
TX
LA FL
Nashville (37) Fort Myers (79)
Naples (146)
Large Markets / Clusters
38 3 2 4 Large Community
Print Content Design Advertising Creative Circulation
Sites Studios Services Call Centers Small Markets
GANNETT Note: Numbers in parentheses represent MSA rankings based on 2016 US Census estimates. 9
The Future of Gannett: Our Strategy

          1                  2                    3                     4

     Leverage        Accelerate growth   Maximize the value     Continue to pursue
 nationwide scale       of our digital   of our legacy print      opportunistic
and local presence    revenue through       business and           acquisitions
  to expand and          innovative      rationalize our cost
    deepen our            consumer               base
relationships with    experiences and
  consumers and        new marketing
    businesses         experiences for
                         businesses

GANNETT                                                                          10
Strategy: Leverage Nationwide Scale and Local Presence to
Expand and Deepen Relationships
B2B Strategy B2C Strategy
Deliver ROI for advertisers Connect with / monetize targeted audiences
Focus on customer segments with the right Super-serve and retain our most valuable
1 1
product suite and level of service subscribers
Drive deeper penetration of digital Deepen our relationship with younger
2 marketing services and advertising 2 audiences through niche passion brands
products within our broad client base and events
Align storytelling efforts with consumers’
Leverage data and technology to drive
3 3 consumption habits across mobile, video
effectiveness and efficiency
and audio
Pursue acquisitions that expand our
Pursue acquisitions that fill an advertising
4 4 passion brands or fill a gap in our
or marketing service product gap
storytelling product portfolio
GANNETT 11Strategy: Accelerate Expansion of Digital Revenue
B2B Product Innovation
• New Sales Proposal Tool
Sales efficiency
Reduced churn
GANNETT 12Strategy: Accelerate Expansion of Digital Revenue
B2C Product Innovation
Core News New Franchises
GANNETT 13Strategy: Maximize the Value of Legacy Print Business
and Rationalize Cost Base
Track Record in Reducing Continued Opportunity to
Operating Expenses Maximize Profits
($ in millions)
• Distribution & Production
$3,709
$630MM+ • Regionalization / Centralization
In Opex
Reductions
• Standardization / Optimization
$3,079
• Outsourcing
(1)
PF2015 2017
GANNETT (1) Pro forma for acquisition of JMG, NJMG and ReachLocal. Source: Pro forma financials filed with 8-K on 10/21/16. 14Strategy: Pursue Opportunistic Acquisitions
Digital Marketing
Consumer Engagement Local Market Expansion
Software & Services
(August 2016, $163MM) (October 2016, undisclosed)
(April 2016, $261MM)
(April 2017, $32MM) (October 2017, undisclosed) (July 2016, $39MM)
Pending Acquisition of
(June 2018, $130MM)
GANNETT 15Financial Highlights
Recent Financial Highlights
Strong Digital Advertising Improvement and Focus on Digital
1 Transformation
Digital Advertising Revenues Reached 44% of Total Advertising
2 Revenues in Q1 ’18
Pending Acquisition of WordStream, a Digital Marketing Software
3 Company, to Further Enhance ReachLocal’s Digital Marketing Solutions
4 Continued Focus on Efficiencies to Drive Steady Cash Flow
$100MM Stock Repurchase Authorization and 2017 Annual
5 Dividend of $0.64 per share
6 Completed $200MM Convertible Debt Financing in April
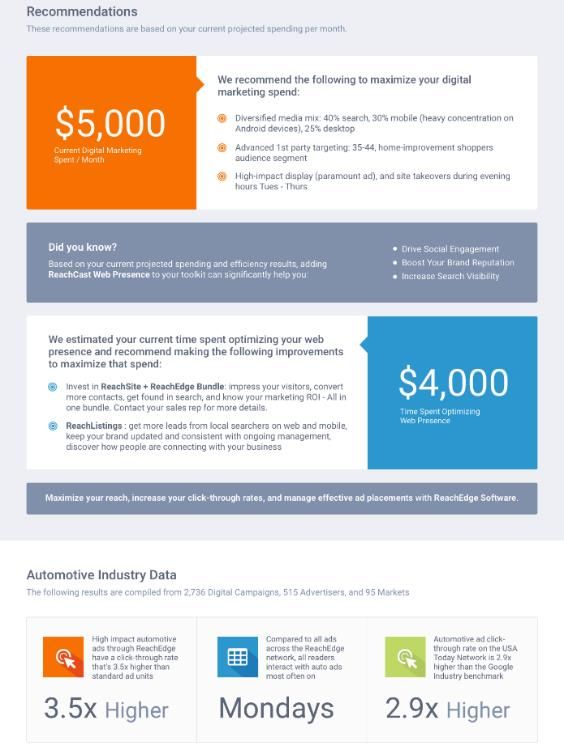
GANNETT 17Strong Improvement in Digital Advertising Trends
ReachLocal Operating Revenue &
Q1 ’18 Highlights $120.0 Adjusted EBITDA Margin 9%
$101.4 8%
($ in millions) $93.8 $96.5
$100.0
$85.9 7%
$75.2 $77.6
$80.0 7% 6%
Results Ahead of Expectations Driven by Solid 6%
5%
1 Growth in Digital Advertising Revenues $60.0 5% 6%
4%
$40.0 4% 3%
2%
$20.0
1%
Publishing Segment Digital Advertising 1%
2 Revenues Grew 7% YoY
$- 0%
Q4'16 Q1'17 Q2'17 Q3'17 Q4'17 Q1'18
Operating Revenue Adjusted EBITDA Margin
ReachLocal Revenues were $96.5 Million, up
3 24%Year-Over-Year Digital Advertising Revenues as a % of Total
Advertising Revenues
41.8% 43.6%
37.9% 38.6% 40.1%
34.9%
Total Digital Revenues Increased 9% to $255.5
4
Million, or ~35% of Total Revenue
Strong Cash Flow and Real Estate Sales Led to
5
Significant Debt Paydown in Q1/early Q2 Q4'16 Q1'17 Q2'17 Q3'17 Q4'17 Q1'18
GANNETT ReachLocal Q2’17 Adjusted EBITDA Margin impacted by one-time transition costs associated with migration of Gannett accounts to the ReachLocal platform 18Financial Summary
Revenue Total Digital Advertising Revenues
($ in millions)
($ in millions)
$3,146 $709.3
$2,885 $3,047
$495.5
$405.2
2015A 2016A 2017A 2015A 2016A 2017A
Adjusted EBITDA and Margin Free Cash Flow(1)
($ in millions) ($ in millions)
$387 $360 $360
$177 $164
13% 12% 11% $106
2015A 2016A 2017A 2015A 2016A 2017A
Adjusted EBITDA Margin
GANNETT (1) Defined as cash flow from operating activities less capital expenditures. 19We Are Gannett. From local to national, we engage the country to tell its stories.
Appendix
Proven and Experienced Management Team

                                            Sharon Rowlands                         Alison K. Engel
            Robert J. Dickey          President, USA TODAY NETWORK
             President & CEO                                                       Senior Vice President,
                                     Marketing Solutions & CEO, ReachLocal   Chief Financial Officer & Treasurer

               Kris Barton
            Chief Product Officer,
                                         Maribel P. Wadsworth                       Kevin Gentzel
                                      President, USA TODAY NETWORK                Chief Revenue Officer
          USA TODAY NETWORK
                                         and Publisher of USA TODAY
GANNETT                                                                                                            22
Non-GAAP Financial Metrics - Consolidated
($ in millions)
Fiscal Year
2017 2016 2015
Net income (GAAP basis) $7 $53 $146
Provision for income taxes 34 14 48
Interest expense 17 13 5
Other non-operating items 10 10 (34)
Operating income (GAAP basis) $68 $89 $165
Depreciation & Amortization 192 133 108
Asset impairment charges 47 56 29
Restructuring costs 44 46 77
Acquisition-related items 5 33 0
Other items 4 3 8
Adjusted EBITDA (non-GAAP basis) $360 $360 $387
GANNETT 23Non-GAAP Financial Metrics – ReachLocal Segment
($ in millions)
Q4 2016 Q1 2017 Q2 2017 Q3 2017 Q4 2017 Q1 2018
Operating income (GAAP basis) ($7,498) ($4,772) ($7,889) ($4,207) ($2,071) ($2,926)
Depreciation & Amortization 8,312 7,875 8,783 8,846 8,398 8,513
Restructuring costs 78 323 191 466 539
Acquisition-related items 43
Other items 399 168 83
Adjusted EBITDA (non-GAAP basis) $892 $3,146 $1,217 $5,229 $6,961 $6,209
GANNETT 24You can also read