TMB Bank Plc. Performance and Transformation Journey - Investor Presentation, NDR Singapore - ttb

Page created by Albert Schroeder
 
CONTINUE READING
TMB Bank Plc. Performance and Transformation Journey - Investor Presentation, NDR Singapore - ttb
TMB Bank Plc.
Performance and Transformation Journey

Investor Presentation, NDR Singapore
March 2017
TMB Bank Plc. Performance and Transformation Journey - Investor Presentation, NDR Singapore - ttb
AGENDA

  TMB’s journey and 2016 performance

  Asset quality

  2017 Target

                                        [2]
“Be the most advocated transactional bank in the country”
Aligning strategy to TMB Aspiration for the Future with key digital enablers

                                                               Strategic intents

                                                                                                   Digital enabler III
                                                                                                                             Continue
                                                                                                                          Enhancing digital
                                                                   Quality
                                                                                                                            Capabilities
                                                                   Deposit

                                                Transactional                     Recurring
                                                  Banking                        Non-interest
                                                 Excellence                        Income
                            Digital enabler I

   Build Brand

                                                                                                   Digital enabler IV
through Customer                                                  Customer                                               Foster Innovations
    Experience                                                  Understanding                                              and Find Right
                                                                                                                            Partnerships
                                                 Optimized                            Cost
                                                  Capital                          Efficiency
                                                 Utilization
                                                                      High
                                                                  Performance
                     Digital enabler II

      Employ
                                                                                                                            Build agile

                                                                                                Digital enabler V
  effective use of                                               and Empowered
                                                                  Organization                                           organization and
   data analytics
                                                                                                                         instill innovation
                                                                                                                               culture
                                                                                                                                              [3]
Growing quality deposits through Deposit-Led Strategy
     Since 2012, Our key strategy was deposit-led strategy which keep our                  Key products of transactional deposit balance(1) (THB mn)
     funding cost competitive and sustain NIM at healthy level. This                       (1)(THB  Bn)free and TMB One bank
                                                                                               TMB All
     development led to a key action in acquiring quality deposits namely,                 (low cost deposit)
                                                                                                                                                    93,964            93,430
     transactional deposits.
                                                                                                                                        65,397
            Growing transactional deposits resulted in strategic shift in deposit mix
             to more stable and low cost of deposits                                                                 46,556

                          As a results, deposit cost has improved to match top peers             29,778

                          % Transactional deposit/total deposit rose to 40% in 2016

                                                                                                  FY2012            FY2013              FY2014      FY2015            FY2016

    Deposit Mix                                                    645.3
                                                                                           Cost of deposits (Included DPA)                                   TMB

   (THB bn)                                           572.4                      599.2                                                                       Avg. 4 largest banks
                                                                                          2.50%                                   2.1%      2.2%
                               496.4     529.7                      26.8%                                                                             2.1%
                                                                                 19.6%                             2.0%
                                                       30.7%
                                                                                          2.00%                                                                    1.8%
      Fixed                               37.6%
                               35.0%                                             40.6%                                                      2.1%
                                                                    36.2%                               1.5%                    2.1%                                          1.6%
                                                       31.5%
                                                                                                                                                     1.9%          1.8%
      No Fixed                                                                            1.50%
                               24.6%      28.1%                                                                      1.7%
                                                                                                                                                                              1.5%
      Saving                                           28.8%        26.9%        31.4%
                               29.1%      27.4%                                           1.00%          1.2%
      Current
                               11.3%      7.0%         9.0%         10.1%         8.4%
                                                                                          0.50%
                               FY2012    FY2013       FY2014       FY2015       FY2016
                                                                                                      FY2010      FY2011       FY2012      FY2013   FY2014    FY2015       FY2016
% Txn deposit/ total deposit      40%      34%           37%         38%           40%
                                                                                         Note: 4 largest banks - BBL, KBANK, KTB, SCB
% Retail deposit                  66%      69%           65%         67%           68%
                                                                                                                                                                                     [4]
Acquire transactional deposits lead to customer understanding

  # New deposit accounts from flagship transactional deposit                      How will we grow transactional deposit?

Growth                                                                                By acquiring transactional deposit, TMB has the opportunity to better
*All Free product (no. of account)                                                     understand customers need and pains in order to offer the best
                                                                                       financial solutions for customers to make the most of their lives.
                                                               7%
                                                                                  1                            2                              3
                                                                                        Simplify account            Provide convenient             PromptPay Payroll
                                               96%                  485,332                                        solution for customer            (Eliminate hurdle to
                                                                                        opening process
                                                     454,393                                                                                       switch primary bank)

                                22%                                                   Online opening account       Provide transactional          To acquire corporate
                                                                                      (2nd deposit product)        convenience that               employee
                                                                                                                   outweigh lower saving
           274%
                                      232,283                                                                      interest rate
                     189,920
                                                                                                                   Offer superior benefits.
                                                                                                                   “The more you use, the
                                                                                                                   more you benefit”
    50,758

                                                                                     From data analytics view: other than gaining transactional deposits,
    FY2012            FY2013          FY2014         FY2015         FY2016
                                                                                      TMB can in turn redeploy transactional history of “Propensity to buy”
                                                                                      and “Moment of truth” to match with customers need for the next
                                                                                      best cross-selling.

                                                                                                                                                         Digital Enabler I

                                                                                                                                                         Digital Enabler II

                                                                                                                                                        Digital Enabler III
                                                                                                                                                                              [5]
Optimizing loan mix for better risk-adjusted return
    Performing loan breakdown
                                                                                 575.8              In 2017: Focusing on resume loan growth with better risk-adjusted return :
    (THB billion)                                                   560.3                           SME and retail loans.
                                                           512.3
                                         477.1                       20%           26%
                       430.6                                18%
Retail                                    17%
                       18%                                  17%      15%
                                                                                   16%                      Build on
                                          20%                                                                                               Customer penetration               Focus on Efficiency
Small SME              15%                                  19%                                         big data analytics
                                                                     22%           19%
                                          16%                                                       1                                                                     3
Medium sized SME       17%                                                                                                              2
                                          46%               46%      43%
Corporate              50%                                                         39%        I.    Propensity
                                                                                                         1.     to buy data       I.            1. more exiting
                                                                                                                                            Penetrating             I.             1.
                                                                                                                                                                              Continuously improve end-to-
                                                                                                    from credit card                        TMB customers                     end process e.g. process
                                                                                                    transactions.                                                             automation, improving
                      FY2012            FY2013            FY2014   FY2015        FY2016                                                                                       turnaround time etc.

                                                                                                    Introducing Data Analytics
         Net interest margin (NIM)                                     Avg. 4 largest banks
                                                                                              II.         2.
                                                                                                    e.g. risk-based pricing, A-   II.
                                                                                                                                            Focusing on keep good
                                                                                                                                                 2.
                                                                                                                                                                                Mortgage loan take up rate(*)

          4.0%
                                                                       TMB                          Score, Behavioral Score and
                                                                                                                                            customers
                                                                                                                                                                                  In 2016 :   84%
                                                                                                    Transactional score                                                                  From 70% in 2015
          3.5%
                                                            3.1%   3.0%           3.2%
                                        3.1%
                     3.0%                                                                                                                                                     Increase capacity utilization
          3.0%
                                                                                  3.1%                                                                              II.            2. mobile sale and
                                                                                                                                                                              of branch,
                                        2.9%              3.0%      3.0%                                                                                                      RM
          2.5%
                       2.7%
          2.0%
                    Note: 4 largest banks - BBL, KBANK, KTB, SCB                                                                                                         (*) %Take up after loan approval
          1.5%
                     FY2012            FY2013           FY2014     FY2015       FY2016                                                                                                    Digital Enabler I

         With shift in loan mix toward better risk-adjusted return with SME                                                                                                              Digital Enabler II
          and retail loans and well-managed funding cost, TMB could
                                                                                                                                                                                          Digital Enabler III
          narrowed down NIM gap with the 4-largest banks
                                                                                                                                                                                                                [6]
Growing Transactional Banking comes with better fee income

Net fee and service income (THB mn.)
                                                                                 +14.3% CAGR

                                                                                           %Growth16’           TMB disrupted ourselves by forgoing cross region and
                                                                         7,821     7,997   +2.2%
                                                                                                                 other hidden fees since 2012 when we first launched No
                                                                                    30%    BA +23%
                                               5,579          5,734                                              Fee to answer to the customers’ need for transactional
 Bancassurance fee
                             4,690
 Mutual fund fee
                                                                                    22%    MF flat               banking excellence
                              23%
 Trade finance fee            9%                                                     4%    TF +14%
                                                                                     6%
                              4%
                              8%
                                                                                           LG +9%
 LG Fee                                                                             12%    Loan related -32%
                             19%
 Loan related fee                                                                   26%
                             37%
 Others

                         FY2012               FY2013         FY2014     FY2015    FY2016
     Fee                                                                                                        The foregone transactional fees were well-compensated
                         1.0%                 1.1%           1.1%       1.3%      1.3%
avg. earning
   assets                                                                                                        by an increase in fees from our strategic fee products as a
                                      Fee breakdown (THB mn.)
                                                                                                                 result of enlarged customer base and improving cross-
                                                             %growth
                                    1H16         2H16         HoH                                                selling ability
           Bancassurance              1,069          1,325    +24.0%
             Mutual fund               694           1,054    +51.9%
            Trade finance              182             173      -5.3%
                    LG Fee             236             256     +8.2%
          Loan related fee             548             386     -29.7%
                    Others            1,028          1,046     +1.7%
                                                                                                                             Remarks: Fee/ avg.earning assets calculated by (Net Fee + Capital market)/
           Total Net Fee              3,758          4,239    +12.8%                                                         avg.earning assets
                                                                                                                                                                                                          [7]
Fee income opportunity from underserved customers

                                         Sales Performance by Channel
% percentage change of service
                                              Sales Performance by Channel
transaction by channels in 2016                                                                                    Increase service levels
                                                                                                                       and efficiency
                                  Sales Transaction
                      110%        (Million)
                                   5.0
                                                                                                                 Double the size of contact center
                                   4.5
                                   4.0   Breakdown        84%       9%          2%          5%
                                   3.5
                                            2016
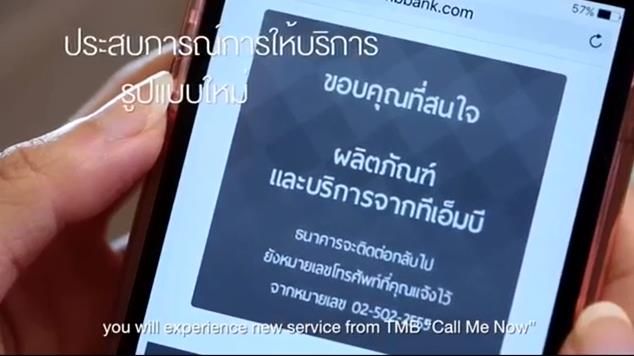
                                                                                                                 Continue to deliver better customer
                                   3.0                                                                            experience with “Call Me Now”
                                   2.5         2.07
                                                        1.73
                                                                                                     Channel
                                   2.0
                                                                                                     strategy    Utilize digital channels to decrease
                                                                                                                  branch operational traffic and focus
                                   1.5
                                   1.0
                                                                  0.19                     0.11
                                                                                                                  more on sales
              2%
                                   0.5
                                                                              0.04
                                     -

    -7%
                                              Overall   Branch   Contact
                                                                 Center
                                                                             Direct
                                                                           Online Sales
                                                                                          Terminal
                                                                                                                 Offer seamless experience for
   Branch   ATM/ADM   Digital                                                                                     customers anytime across channels
                                                                                                                  (Omni-channel experience)

                                                                                                                                         Digital Enabler I

                                                                                                                                         Digital Enabler II

                                                                                                                                         Digital Enabler III

                                                                                                                                                               [8]
Growing revenue across all channels

             2015       2016                 Proportion of revenue by channel
                                                                                                                   Improve our seamless services (Omni-channel)

                                                                                                        Why waiting?                 Better serve customer       Offer right products &
          93%                                                                                        No need to wait with                 experience                     services
                      90%
                                                                                                                                                                Fulfill customers’
                                                                                                   “Call Me Now”                   More Contactable                    needs

                                                                                                           5      min                  75%
                                                                                                                                             99%

                                                                                                 Call Back period reduced from     Improved to 99% from 75%   26% increase in success case
                                                                                                      2-3 days to 5 minutes                                         (i.e. Credit card)

                                                            3.4%                                 Search for product information easily through all channels;
                                                                     3.3%
                                     2.7%                                                 1.8%
                                                     1.8%                   1.4%
                            1.5%
                                            0.9%                                                  Smart phone                    Website
                                                                                                   Computer
                                                                                                                     www.TMBbank.com
             Branch     Contact center        Digital              ATM             Omni

                                                                                                  Internet Banking
                                                                                                                            Facebook
Growth 16’    12%              98%                 121%            13%              48%

*Our focus in 2017                                                                                                                                                Digital Enabler I

                                                                                                                                                                  Digital Enabler II

                                                                                                                                                                  Digital Enabler III
                                                                                                                                                                                             [9]
Improving efficiency resulted in lower cost to income ratio

        Operating income and expenses                                                TMB strategic move for cost management
         Total operating income         (THB million)
         Total operating expenses                                                      TMB has reduced portion of fixed cost and increased variable cost base,
                                                                     +10.0% CAGR
40,000
                                                                                        so the Bank can manage cost more efficiently.
                                                                     35,108
35,000                                                  33,298
                        29,120        29,769                                                            Total costs                    Increased portion of variable costs to
30,000                                                                                                                                 effectively manage costs
          24,019                                                                         43%        46%          47%         50%
25,000                                                                                                                                 Manageable costs
20,000                                                                  +4.9% CAGR                                                       Premise & Equipment: Rental fee
                                                                                         17%         19%         20%                      from leasing
15,000
                                          15,714            16,460       16,438                                                          Personnel expense: Outsource
10,000         13,565        14,803
                                                                                         26%         27%
 5,000
                                                                                                                  27%                   Business volume related
                                                                                                                                           Business tax
    -                                                                                                                                      Personnel expense: Revenue & Profit
             FY2012        FY2013       FY2014            FY2015       FY2016            57%         54%         54%          50%           sharing schemes

                                                                                                                                       Optimized volume growth to achieve lower
         TMB has consistently emphasized in faster revenue                                                                            cost per transaction
          growth over cost growth to result in growing PPOP                                                                               Personnel expense: Salary base
                                                                                                                                          Premise & Equipment: Bank own
                                                                                                                                          Depreciation
                                                                                        FY2015     FY2016       FY2017       Target

                                                                                         Fixed   Business Volume Related   Managable

                                                                                                           = Total Variable cost

                                                                                       For 2017, TMB focuses on bringing 5 major cost of transactions lower,
                                                                                        potentially bring their cost per transaction down as much as 30%
                                                                                                                                                                 Digital Enabler III

                                                                                                                                                                 Digital Enabler V     [10]
Improving efficiency equals improvement of profitability overtime

                    Pre-provision operating profit (PPOP)
                     (THB Billion)
                                                                         +15.7% CAGR

                    18
                                                                         18.6
                    15                                       16.9
                    12                  14.4      14.2

                     9          10.4
                     6
                     3
                     0
                              FY2012   FY2013    FY2014     FY2015      FY2016

                    PPOP path ensures the Bank’s operating profitability continues to grow

                                                                                              [11]
AGENDA

    TMB’s journey and 2016 performance

    Asset quality

    2017 Target

                                          [12]
Reduced NPLs with higher coverage ratio for prudence

         Non performing loans & NPL Ratio                         NPL                         Coverage Ratio
     (THB million)                                                NPL ratio

40,000    36,047
                                                                                                                                      157%
35,000                                                                                                                                         142%     143%
                     29,828                                                                                                  140%
30,000
           14.3%                                                                                                    113%
25,000                        22,103   22,421
                                                         20,473
20,000                                          18,093             17,605
15,000                                                                                                      73%
                                                                                                   57%
10,000               5.7%                                          14,008     From SME with
                              4.1%     3.9%                                   TCG claimable
 5,000                                          2.9%     3.0%       2.5%      of THB3.8 bn
    0
          FY2010     FY2011   FY2012   FY2013   FY2014   FY2015   FY2016                          FY2010   FY2011   FY2012   FY2013   FY2014   FY2015   FY2016

               NPL ratio was actively brought down to 2.53%                                        TMB has been consistently prudent in business
                in 2016, from 14.3% in 2010, by dealing with                                         operation, hence, coverage ratio was raised maintained
                legacy portfolio and cleaning our balance                                            high at 143% in 2016
                sheet to limit future downside risk

               NPL as of Dec 16 was THB17.6 bn with the
                Thai Corporate Guarantee claimable of
                THB3.8bn

                                                                                                                                                                 [13]
NPL formation and NPL resolution were well monitored

                                                                                                                                                       NPL resolution
                                                                                                                                                       included extra write off

                                                                                                                                                        Natural NPL
                                                                                                                                                        resolution

        NPL formation in 2016 was more driven by restructuring                                  To be conservative and to reduce downside risk in the future, TMB
         loan portfolio                                                                           made an extra write-off amounted to THB12 billion and NPL sale
                                                                                                  amounted to THB1.2 billion
        New NPL formation in 4Q16 was lower to 0.8% mainly
         due to SME portfolio                                                                    Consequently, NPL ratio dropped to 2.53%,

      Note: 1) % NPL formation and NPL resolution calculated per total loan+ interbank loan
            2) Stated as annualized basis
                                                                                                                                                                            [14]
TMB maintained stable performing loan portfolio quality with relatively small
                                  180
restructuring and rescheduling loans
                                                                                     160
                                            Pass, SM and NPL loan                                                                                                                    Loan quality
                                                                                                      Dec-15                        Jun-16                         Sep-16
% of       94.6%           94.3%      94.8%                                      450 140                                                                          Dec-16

total loan
 700
   THB bn   648       649           659                                              120
                                                                                 500
                                                                                                                                                                            P-Normal 92.5%
 600

            Dec-15         Jun-16     Dec-16                                     550
                                                                                     100
 500                                                                                                                                            94.8%

                                                                                 600
                                                                                       80
 400

 300                                                                             650
                                                                                       60                                                                                   Perform-Rescheduled 1.0%
                                                                                                       Dec-15                        Jun-16                        Sep-16   Perform-Restructured 1.2%
                                                                                       0
 200
                                                2.9%
                                                                                       40                                      Chart Title                                  SM-Normal 0.7%
                                                         2.8%                 2.98%10        2.87%                                               2.7%                       SM-Rescheduled 0.2%
                                                                   2.7%
                                                                                                          2.52%                                                             SM-Restructured 1.9%*
 100                                                                                 20
                                                                                       20                                                                                   Included restructured loan under concession rate of THB6.8 bn
                                                                                                                                                                            (1.0% of total loan)
                                                   17
                                          THB bnDec-15    19
                                                         Jun-16   19
                                                                   Dec-16       2030          20        18
                                                                             Dec-15          Jun-16       Dec-16
  0                                                                                                                                                                          NPL 2.52%
                     PASS                                SM
                                                                                     40
                                                                                       0     NPL
                                                                                     50

                                                                                                      Dec-15                        Jun-16                         Sep-16
            Note: Bank-only financial statement                             Dec-15          Jun-16      Dec-16                                                    Note: Bank-only financial statement
                                                                                     60
                     700                        659
                                648
                                                                                                                   SM-Normal    SM-Reschedule    SM-Restructure
                                          649
                                                                                     70

                     600
              Special mention loan portfolio remained stable, while NPL                                                                       With higher proportion of NPL formation coming from
               portfolio
                  500    decreased as a result of write offs that have                                                                          restructured loan, our relatively small restructuring also mitigate
               reduced downside risks                                                                                                           future downside risk
                     400
                                                                                                                                               Written-off portfolio was THB22.2 billion as of Dec 16
                     300
                                                                                                                                                                                                                                            [15]
The proactive provision was set high in 2016

           Provision expense                     Annualised credit cost
                   THB million                            172 bps
          3,000                                                            151bps
                                    bps
                                     128      135 bps
                                                         2,541
          2,000
                                             1,998
                                                                          2,234        The write-off loan was required to set up 100% provision,
                        64 bps     1,877
          1,000                                                                         disregarded of collateral value.
                       923
             0
                      4Q15          1Q16     2Q16        3Q16             4Q16         Additional write-offs together with uncertain economic
                                                                                        outlook, the Bank set relatively high provision of THB2.2
                  Coverage ratio
                                                                                        billion in 4Q16
                      142%          140%     143%       142%          143%

                      4Q15          1Q16     2Q16       3Q16          4Q16

                                                                                       Provision was THB8.6 billion in 2016, equivalent to
                         FY2015            FY2016         YoY growth (%)                credit cost of 146 bps
Provision expense        5,479 mn          8,649 mn              57.9%
                                                                                       TMB aims to maintain coverage ratio at 140-150%
     Credit cost          94 bps           146 bps               52 bps

                                                                                                                                                    [16]
Enhance Small SME portfolio quality by using data analytics

      Application
      score
     Refine “A-score” to
      increase prediction
                                              B    ehavior
                                               Score
                                                                                      TScore
                                                                                         ransactional

      power, aiming for
      better customer
      screening
                                   Monitor existing customers by analysis of       Advanced analytics using big data to observe
     Enable bank to                credit behavior                                  transactional behavior to efficiently profile
      optimal risk-return                                                            customers
      portfolio profile and        Help TMB offer credit limit and facilities
      attract good credit           where customer needs                            Can be applied to cross selling optimization,
      customers,                                                                     portfolio monitoring, and collections,
     Allow TMB to                                                                   covering end to end credit life cycle
      introduce price-for-
      risk approach based                                                           Firstly applied to enhance capability of Early
                                                                                     Warning System

  TMB continues to improve monitoring and prevention system from traditional approach (Day-Past-Due) to
   be based on customer profile, which will timely capture problem of bad accounts
                                                                                                                                      Digital Enabler II
  In addition, using data analysis can early identify frauds which will increase bank’s ability to prevent fraud
   cases                                                                                                                              Digital Enabler III

                                                                                                                                                            [17]
ROE at competitive level that strengthen capital base

                                                               ROAE             TMB         Avg. 4 largest banks

                                                               20%
                                                                                          16.4%    17.4%
                                                                                                               16.0%
                                                                                 15.1%
                                                               15%     12.7%                                             12.9%
                                                                                                                                 11.3%
                                                                                                               14.6%    12.9%
                                                               10%
                                                                                                                                 10.2%
                                                                                                     9.7%
                                                                5%
                                                                               7.9%
                                                                     6.6%                 2.2%

                                                                0%
                                                                      FY2010   FY2011    FY2012   FY2013     FY2014    FY2015    FY2016

                                                       ROAE gaps with peer were closed in the final year of transformation,
                                                        putting TMB now as a main competitor in the market, with stronger
                                                        capital, higher buffer for loan loss, and healthier risk and profitability
                                                        indicators

                                                       Tier 1 capital improved from 2015 to 12.8% (entirely Core Tier 1) and
                                                        CAR improved to 18.1%

       Note: 4 largest banks - BBL, KBANK, KTB, SCB                                                                                       [18]
AGENDA

    TMB’s journey and 2016 performance

    Asset quality

    2017 Target

                                          [19]
2017 Key financial target

                          Key ratios     2016 Actual   2017 Target

              Performing loan growth        2.8%         8-10%

              Deposit growth                -7.1%        8-10%

              Net interest margin           3.2%       3.2%-3.3%

              Net fee income growth         2.2%         10-20%

              Cost to income ratio          47%          45-47%

              ROE                          10.2%        10%-12%

              NPL ratio                    2.53%        2.3-2.5%

              Coverage ratio                143%        140-150%

              Credit cost (annualized)     146 bps     140-150 bps

                                                                     [20]
Areas of focus in 2017 to continue our growth

                                                                           In 2016,
                                                                           %Txn to Non-Txn Deposit in 2016 was at (40%) comparing to ratio in
                      Transactional Deposit                                the beginning of the year at (37%)
                        Growing transactional deposit                      +107% increased in #no. of customer account in flagship product,
                     continues to be a challenge for both                  namely “All-Free”
                        commercial and retail banking

                                                                                                                    In 2016,
                                                                             Fee Income                             Fee/EA of 1.3% vs 2.0% Top Peers

                                                                        While Fee Income has improved
                                                                   substantially from 2008 level of 0.6% per
                                                                   EA, fee income capability remains subpar
                                                                            comparing to Top Peers

                                                                                                                         Efficiency
                                                                                                                While TMB has been more efficient
                                                                                                           comparing to C/I of 71% in 2008, efficiency
                                                                     In 2016,
                                                                                                           still present a gap comparing to Top Peers
                                                                     TMB C/I = 47%; Peers’ C/I = 40%

Note: Fee/EA = Fee per Earning Asset; C/I = Cost to Income Ratio                                                                                         [21]
National e-payment (Phase 1 : 2016-2018                            Digital Foundation)

                                                         MOF and Bank of Thailand
                                                 Determine direction and strategic objectives

            PromptPay                     2      Debit Card                                    eTaxation
    1                                            (EDC expansion)                          3                                   4     Subsidy
                                                                                               System
        Go live on Jan 27, 2017            Start deploy EDC expansion
                                           in Mach 17
                                                                                                                              Enhancing the efficiency in
 Money transfer service from          Debit-led strategy developed                                                            supporting low-income earners
 bank account through Citizen                                                            E-Personal tax - (Go live)
                                       by the government aimed to                                                             with better access to financial
 ID or mobile phone number.                                                              e-Withholding Tax                   service
                                      make the Thai payment system
                                                                                         e-Tax Invoice / e-Receipt
                                      more effective, convenient, and
 For TMB, customer can                                                                   e-Filing
                                      secure which enable cashless
 transfer to any PromptPay for                    society
 free regardless of no. of times,
 and amount to any banks.
                                                                                                                                    ePayment
                                                                                                                              5
                                                                                                                                    Promotion and PR
                                                Expandding the first batch of
                                              500K terminals by 2016
                                              increasing eventually to 2 Mn                                                       Encouraging Thais to take up
                                                                                                                                  Nation e-payment supporting
                                                        terminals
                                                                                                                                  by incentivize campaign and
    Registered PromptPay
                                                                                                                                  Public awareness
   300K in FEB 2017
%PromptPay/ active cust = 13%
                                    Phase 2: 2018-2020
                                                                                                                       Phase 3: 2021-2025
                                    Inclusion: everyone can reap benefit of digital
                                                                                                                       Full Transformation
                                    technology                                                                                                                   [22]
TMB Bank Public Company Limited                                                               Website: www.tmbbank.com
3000 Phahonyothin Road
Chatuchak, Bangkok 10900

Disclaimer
This presentation contains some information from other sources, that TMB Bank Public Company Limited does not make any representations regarding the use, validity, accuracy, or
reliability of, or the results of the use of information, data but not limited to, all text, and images (“the Content”) on this presentation. Some content may contain forward looking
statements, that based on management’s view upon the information currently available to us. These statement are subject to certain risks and uncertainties that could cause the
actual results materially differed from what had been previously stated. The materials in this presentation shall not, and are not intended to, constitute or contain an offer to sell or
the solicitation of an offer to buy, any securities of TMB Bank Public Company Limited.
You can also read