EARNINGS CALL PRESENTATION - Q4 2020 - FEBRUARY 11, 2021 - BORGWARNER

Page created by Carolyn Waters
 
CONTINUE READING
EARNINGS CALL PRESENTATION - Q4 2020 - FEBRUARY 11, 2021 - BORGWARNER
Earnings Call Presentation
  Q4 2020

February 11, 2021
EARNINGS CALL PRESENTATION - Q4 2020 - FEBRUARY 11, 2021 - BORGWARNER
Forward-Looking Statements
This presentation may contain forward-looking statements as contemplated by the 1995 Private Securities Litigation Reform Act that are based on management’s current
outlook, expectations, estimates and projections. Words such as “anticipates,” “believes,” “continues,” “could,” “designed,” “effect,” “estimates,” “evaluates,” “expects,”
“forecasts,” “goal,” “guidance,” “initiative,” “intends,” “may,” “outlook,” “plans,” “potential,” “predicts,” “project,” “pursue,” “seek,” “should,” “target,” “when,” “will,” “would,” and
variations of such words and similar expressions are intended to identify such forward-looking statements. Further, all statements, other than statements of historical fact
contained or incorporated by reference in this presentation that we expect or anticipate will or may occur in the future regarding our financial position, business strategy and
measures to implement that strategy, including changes to operations, competitive strengths, goals, expansion and growth of our business and operations, plans, references to
future success and other such matters, are forward-looking statements. Accounting estimates, such as those described under the heading “Critical Accounting Policies and
Estimates” in Item 7 of our Annual Report on Form 10-K for the year ended December 31, 2019 (“Form 10-K”), are inherently forward-looking. All forward-looking statements
are based on assumptions and analyses made by us in light of our experience and our perception of historical trends, current conditions and expected future developments, as
well as other factors we believe are appropriate in the circumstances. Forward-looking statements are not guarantees of performance, and the Company’s actual results may
differ materially from those expressed, projected or implied in or by the forward-looking statements.

You should not place undue reliance on these forward-looking statements, which speak only as of the date of this presentation. Forward-looking statements are subject to risks
and uncertainties, many of which are difficult to predict and generally beyond our control, that could cause actual results to differ materially from those expressed, projected or
implied in or by the forward-looking statements. These risks and uncertainties, among others, include: uncertainties regarding the extent and duration of impacts of matters
associated with COVID-19, including additional production disruptions; the failure to realize the expected benefits of the acquisition of Delphi Technologies PLC that the
Company completed on October 1, 2020; the failure to promptly and effectively integrate acquired businesses; the potential for unknown or inestimable liabilities relating to
acquired businesses; our dependence on automotive and truck production, both of which are highly cyclical and subject to disruptions; our reliance on major OEM customers;
commodities availability and pricing; supply disruptions; fluctuations in interest rates and foreign currency exchange rates; availability of credit; our dependence on key
management; our dependence on information systems; the uncertainty of the global economic environment; the outcome of existing or any future legal proceedings, including
litigation with respect to various claims; future changes in laws and regulations, including, by way of example, tariffs, in the countries in which we operate; impacts from any
potential future acquisition or divestiture transactions; and the other risks, including by way of example, pandemics and quarantines, noted in reports that we file with the
Securities and Exchange Commission, including Item 1A, “Risk Factors” in our most recently-filed Form 10-K and in our most recently-filed Form 10-Q. We do not undertake
any obligation to update or announce publicly any updates to or revisions to any of the forward-looking statements in this presentation to reflect any change in our expectations
or any change in events, conditions, circumstances, or assumptions underlying the statements.

© BorgWarner Inc.                                                                     2
EARNINGS CALL PRESENTATION - Q4 2020 - FEBRUARY 11, 2021 - BORGWARNER
Non-GAAP Financial Measures
This presentation contains information about BorgWarner’s financial results that is not presented in accordance with accounting principles generally accepted in
the United States (“GAAP”). Such non-GAAP financial measures are reconciled to their closest GAAP financial measures in the Appendix. The provision of these
comparable GAAP financial measures for 2020 is not intended to indicate that BorgWarner is explicitly or implicitly providing projections on those GAAP financial
measures, and actual results for such measures are likely to vary from those presented. The reconciliations include all information reasonably available to the
company at the date of this presentation and the adjustments that management can reasonably predict.

Management believes that these non-GAAP financial measures are useful to management, investors, and banking institutions in their analysis of the Company's
business and operating performance. Management also uses this information for operational planning and decision-making purposes.

Non-GAAP financial measures are not and should not be considered a substitute for any GAAP measure. Additionally, because not all companies use identical
calculations, the non-GAAP financial measures as presented by BorgWarner may not be comparable to similarly titled measures reported by other companies.

© BorgWarner Inc.                                                         3
EARNINGS CALL PRESENTATION - Q4 2020 - FEBRUARY 11, 2021 - BORGWARNER
Agenda

▪ Fred Lissalde
    Chief Executive Officer

▪ Kevin Nowlan
    Chief Financial Officer

▪ Q&A

© BorgWarner Inc.             4
EARNINGS CALL PRESENTATION - Q4 2020 - FEBRUARY 11, 2021 - BORGWARNER
2020 Finishes Strong, Well Positioned for the Future
                                                                                                                                           ▪ Organic revenue and outgrowth
              Net Sales                                          Adj. EPS*                                     Free Cash Flow*               ahead of expectations
       Outgrowth Ahead of
           Guidance
                                                           Solid Year Despite
                                                           Global Pandemic
                                                                                                              Above High End of
                                                                                                               Guidance Range
                                                                                                                                           ▪ Decremental margin in line with
       12.1% Adj.        9.7% Adj.                                                                                                           expectations, while continuing
       Op Margin*        Op Margin*
                                                                                                                                             to support future growth
                         $10,165

      $10,168
                          $9,045
                                                           $4.13                                              $699              $743       ▪ Record free cash flow
                                                                                                                                             generation
                                                                              $2.76
               630 BPS
               Outgrowth                                                                                                                   ▪ Completed Delphi Technologies
                                                                                                                                             acquisition
      FY 2019            FY 2020                         FY 2019            FY 2020                          FY 2019          FY 2020      ▪ Multiple new product awards for
           Delphi Technologies Sales                                                                                                         electrified vehicles

** Adj. operating margin, Adj. EPS and Free cash flow on this slide are non-US-GAAP measures. See reconciliation to US GAAP in Appendix.

© BorgWarner Inc.                                                                                        5
EARNINGS CALL PRESENTATION - Q4 2020 - FEBRUARY 11, 2021 - BORGWARNER
800-volt Electric Motor for Global CV Customer
                                               800-volt Electric Motor
                                     ▪ Award with a large global commercial
                                       vehicle (CV) EV customer launching in 2024
                                        ▪ Multi-faceted platform will support the
                                          manufacturer’s goal of a common electric
                                          drivetrain
                                        ▪ Customer can significantly reduce charging
                                          time while achieving a higher power density
                                        ▪ Available in multiple variants to serve our
                                          expanding commercial vehicle EV market

                      Commercial Vehicle EV market
                    represents a significant opportunity

© BorgWarner Inc.                6
EARNINGS CALL PRESENTATION - Q4 2020 - FEBRUARY 11, 2021 - BORGWARNER
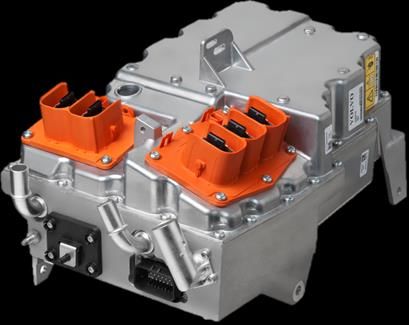
400-Volt SiC Inverter for Major European OEM

                                                      400-Volt Inverter
                                           ▪ Partnering with a major European OEM
                                             on next-generation BEVs expected to
                                             launch in 2022
                                             ▪ Leading market trend of 400V Si to SiC
                                               upgrade to extend EV mileages with
                                               minimum design impact
                                             ▪ Downstream integration capability helps to
                                               secure customer demand with competitive
                                               cost

                    Second largest power electronics win to date

© BorgWarner Inc.                      7
EARNINGS CALL PRESENTATION - Q4 2020 - FEBRUARY 11, 2021 - BORGWARNER
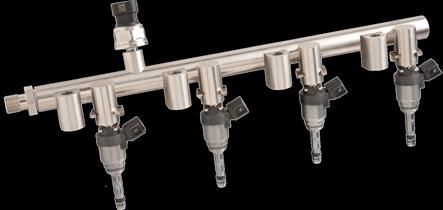
Key European Inverter Wins Provide Scale
         BorgWarner Competitive Advantage        Inverters for 3 Key European OEM Programs

 ▪ Efficient speed to market with products                                          ~1.1M

   covering 400V SiC, 800V SiC, 48V
 ▪ Proprietary inverter power module design
 ▪ Vertical integration
     ▪ Power modules, integrated circuit
         development and full software
         capability in-house                     ~72K
 ▪ Scale in Electronics                          2022        2023        2024        2025

         Inverter wins expected to drive substantial future revenue growth

© BorgWarner Inc.                            8
EARNINGS CALL PRESENTATION - Q4 2020 - FEBRUARY 11, 2021 - BORGWARNER
Integration on Track – Moving Forward as One BorgWarner
$ in millions

        Q4 2020 Sales & Adj.
         Operating Margin                                                                          Cumulative Cost
                                                                                                     Synergies

                              9.6% Adj.
                              Op Margin*

         3.8% to
        5.0% Adj.                                                                                                                        SiC Inverters
        Op Margin*

                               $1,120                                                                                 $90

         $950 to
         $1,000
                                                                                                   $15
        Guidance                Actual                                                            2020           Mid-point 2021
                                                                                                                    Estimate           GDi systems

 Delphi Technologies
                                                                                                 Synergies on                      Multiple program
 Q4 results ahead of
                                                                                                   schedule                       awards post signing
      guidance
** Adj. Operating Margin excludes synergies of $15 million and $13 million of purchase price amortization.

© BorgWarner Inc.                                                                                            9
Investor Day 2021
▪ Date: Tuesday, March 23, 2021

▪ Time: 9:00AM – 11:30AM EDT

▪ Where: Virtual broadcast from
    BorgWarner WHQ

▪ Will feature presentations by
    senior leadership followed by Q&A

© BorgWarner Inc.                       10
Summary of 2020 Results and 2021 Outlook
                                                                                                           Free Cash Flow*

  ▪ Delivered strong outgrowth and free cash
                                                                                                           ($ in millions)

         flow in 2020                                                                                    $743                 $800 to
                                                                                                                               $900

  ▪ Strong free cash flow expected to continue,
         enabling investments to support growth                                                         FY 2020              FY 2021 Est.

                                                                                                                              Electric
  ▪ Expect medium-term outgrowth to be in
                                                                                                      Combustion
                                                                                                                              ~2.6X $$

         line with prior expectations
                                                                                                                               $2,427

  ▪ Believe we remain strongly positioned to                                                             $943
         capitalize on long-term industry trends
                                                                                                        2025 BorgWarner Content
                                                                                                       Opportunity Per Light Vehicle

* Free cash flow on this slide is a non-US-GAAP measure. See reconciliation to US GAAP in Appendix.

   © BorgWarner Inc.                                                                            11
BorgWarner Q4 2020 Net Sales Walk
$ in millions

                                                            ▪ Global light vehicle markets up
                Q4 2019 net sales   $2,559
                                                              ~1.6% year over year

                              FX             $88            ▪ Organic sales grew ~6.2%, driven by
                                                              outgrowth in China and strong China
       Market Impact and pricing      $(6)                    commercial vehicle performance

                         Backlog              $165
                                                               ▪   China – Dual clutch transmission
                                                                   modules (DCT); commercial vehicles
     Delphi Technologies impact                    $1,120      ▪   Europe – Roughly in line with market
                                                                   due to lapping diesel outperformance
                Q4 2020 net sales                  $3,926      ▪   North America – Impacted by F-150
                                                                   change-over

© BorgWarner Inc.                             12
BorgWarner Financial Results & Adj. Operating Income
$ in millions

     Q4 2019 adj. operating
                                                             $340                                                                                                     Three months ended
                                                                                                           (in millions, except per share amounts)
           income*                                                                                                                                                       December 31,
                                                                                                           GAAP & Non-GAAP Financials
                                                                                                                                                                       2019        2020
                                                                                                           Sales                                                          $2,559      $3,926
                                 FX                                       $6
                                                                                                           Adj. operating income*                                              $340    $448
                                                                                                           Adj. operating margin                                              13.3%   11.4%
     Market impact, pricing,
         backlog and other                                   $(7)
                                                                                                           Adj. diluted EPS*                                                  $1.17    $1.18

        Delphi Technologies                                                                                Free cash flow*                                                     $221    $197
                    impact                                                         $109

                                                                                                                                             $216 million of stock
     Q4 2020 adj. operating
                                                                       $448                                                                  buybacks in Q4 2020
                   income*

     * Adj. operating income, Adj. operating margin, Adj. diluted EPS and free cash flow on this slide are non-US-GAAP measures. See reconciliation to US GAAP in Appendix.

© BorgWarner Inc.                                                                            13
Expect Global Markets to Rebound in 2021
          BorgWarner Global Market                                     North America                               Europe                           China

          FY’20                    FY’21
          Actual                    Est.

                               11% to 14%                           FY’20               FY’21             FY’20                 FY’21      FY’20              FY’21
                                                                    Actual               Est.             Actual                 Est.      Actual              Est.

                                                                                     22% to 25%

                                                                                                                              11% to 14%

                                                                                                                                           0.5%             -2% to 1%

          -16.0%
                                                                    -21.5%                                -21.0%

Note: FY’20 Actuals are BorgWarner-weighted market assumptions based on January 2021 LV IHS and February 2021 CV On-Hwy IHS

© BorgWarner Inc.                                                               14
2021 Expected Sales Walk and Guidance
$ in millions

                Full-year Net Sales Outlook                                                                                            Net Sales Highlights

            2020 net sales                  $10,165
                                                                                          ▪          Global BWA LV/CV markets up ~11% to ~14%
                                                                                          ▪          ~100 to ~300 basis points of outgrowth
    Delphi Technologies
                                                                 $2,628
       pro forma impact
                                                                                                                           Earnings and FCF Highlights
     2020 pro forma incl.
                                                                                          ▪
                             8.3% Pro forma
                             Adj. Operating Margin    $12,793                                        Incremental margins in the low 20% range before
   Delphi Technologies**
                                                                                                     synergies and purchase price amortization
                       FX                                        $355
                                                                                          ▪          Delphi Technologies cost synergies benefit expected
                                                                                                     to be an incremental $70 to $80 million in 2021
      Market change and
                                                        $1,182          $1,522
                 pricing                                                                               ▪ Cumulative Synergies ~$85 to $95 million
  Backlog, mix & change
                                                                $370    $630
                                                                                          ▪          Adj. Diluted EPS ~$3.85 to $4.25*
    in Aftermarket sales
                                                                                          ▪          Free cash flow ~$800 to $900 million*
                             10.0% - 10.5%
            2021 net sales   Adj. Operating Margin*        $14,700        $15,300     * Adj. operating margin, Adj. diluted EPS and free cash flow on this slide are non-US GAAP measures. See reconciliation to US GAAP in Appendix.
                                                                                      ** On October 1, 2020 BorgWarner completed its acquisition of Delphi Technologies PLC (Delphi Technologies). The 2020 pro forma unaudited quarterly
                                                                                      financial information included herein includes the pro forma combined results of BorgWarner and Delphi Technologies for periods prior to October 1, 2020. The
                                                                                      pro forma financial information has been derived from the unaudited consolidated financial statements included in BorgWarner’s and Delphi Technologies’
                                                                                      Quarterly Report on Form 10-Q for the three and six months ended June 30, 2020 and does not give effect to the transaction on periods prior to October 1,
                                                                                      2020. The pro forma financial information is not necessarily indicative of either the actual consolidated results had the acquisition of Delphi Technologies
                                                                                      occurred on January 1, 2020 or of future operating results.

© BorgWarner Inc.                                                                15
Mid-Term Outgrowth Expectations Remain Intact
$ in millions

Expected Light-duty Diesel Sales for Legacy                        2021 to 2024 LV/CV Net Backlog & Aftermarket Growth
      Delphi Technologies Portfolio

                                                                                                   North                  Europe
                                        Overcoming diesel                                         America                  20%
                                                                                                   25%
                                        headwind
                                                                               $2,800
                                                            $370
                                                             to
                                                            $630                                  ROW
                                                                                                  10%

  2020          2021   2022   2023   2024                   2021            2022 to 2024                                 China
                                                                                                                          45%

                                                                         Net backlog supports 2022-2024
  In line with original expectations
                                                                         outgrowth in the mid-4% range

© BorgWarner Inc.                                      16
Thank you!

© BorgWarner Inc.       17
Appendix

© BorgWarner Inc.     18
2021 Planning Assumptions

    ▪ CapEx                             $650 to $700 million
    ▪ R&D spending                      ~5% of sales
    ▪ Tax rate for ongoing operations   ~32%

© BorgWarner Inc.                  19
Pro Forma 2020 Quarterly Sales and Adj. Operating Income (Unaudited)
 On October 1, 2020 BorgWarner completed its acquisition of Delphi Technologies PLC (Delphi Technologies). The 2020 pro forma unaudited quarterly financial information included herein includes the pro forma
 combined results of BorgWarner and Delphi Technologies for periods prior to October 1, 2020. The pro forma financial information has been derived from the unaudited consolidated financial statements included in
 BorgWarner’s and Delphi Technologies’ Quarterly Report on Form 10-Q for the three and six months ended June 30, 2020 and does not give effect to the transaction on periods prior to October 1, 2020. The pro
 forma financial information is not necessarily indicative of either the actual consolidated results had the acquisition of Delphi Technologies occurred on January 1, 2020 or of future operating results.

                                                                              Q1 2020               Q2 2020               Q3 2020                Q4 2020               FY 2020
                       Air Management
                       Net sales                                          $         1,683       $            961      $          1,750       $         1,942       $          6,336
                       e-Propulsion & Drivetrain
                       Net sales                                                    1,032                    757                 1,305                 1,447                  4,541
                       Fuel Injection
                       Net sales                                                       411                   250                    410                   479                 1,550
                       Aftermarket
                       Net sales                                                       174                   129                    195                   194                   692

                       Inter-segment sales eliminations                                 (76)                  (43)                  (72)                 (136)                 (327)
                       Total Company
                       Net sales                                          $         3,224       $          2,054      $          3,588       $         3,926       $        12,792

                       Adj. operating income                              $           274 $                  (52) $               396 $                 448 $                 1,066
                       Adj. operating margin                                          8.5%                 -2.5%                 11.0%                 11.4%                   8.3%

© BorgWarner Inc.                                                                              20
BorgWarner Weighted Market Estimates

                                                                                                         FY'20                  FY-21 Est.
                      LV Range                                                                          -20.1%                 22% to 25%
                                                                   North America
                      CV Range                                                                          -30.1%                25.5% to 28.5%

                      LV Range                                                                          -21.6%                 11% to 14%
                                                                          Europe
                      CV Range                                                                          -16.9%                7.5% to 10.5%

                      LV Range                                                                          -4.2%                   3% to 6%
                                                                           China
                      CV Range                                                                          26.5%                 -30% to -33%

                      Weighted LV Range                                                                 -16.8%                12.5% to 15.5%
                      Weighted CV Range                                     Total                       -10.8%                 3.5% to 6.5%
                      Weighted Total Range                                                              -16.0%                 11% to 14%

Note: FY’20 Actuals are BorgWarner-weighted market assumptions based on January 2021 LV IHS and February 2021 CV On-Hwy IHS

© BorgWarner Inc.                                                               21
Fourth Quarter and Year-to-Date Reconciliation to US GAAP
 Adjusted Operating Income and Adjusted Operating Margin
 The Company defines adjusted operating income as operating income adjusted to eliminate the impact of restructuring expense, merger, acquisition and divestiture expense,
 other net expenses, discontinued operations, and other gains and losses not reflective of the Company’s ongoing operations. The company defines adjusted operating margin
 as adjusted operating income divided by net sales

                                                                                      Three Months Ended                 Year Ended
                                                                                         December 31,                   December 31,
                           $ in millions                                                2020      2019                 2020      2019
                           Sales                                                      $ 3,926 $ 2,559                $ 10,165 $ 10,168

                           Operating income                                           $     214 $         478        $     618 $       1,303
                           Operating margin %                                               5.5%         18.7%             6.1%        12.8%

                           Non-comparable items:
                           Restructuring expense                                            131             31             203            72
                           Merger, acquisition and divestiture expense                       38              1              96            11
                           Intangible asset accelerated amortization                         38             -               38            -
                           Amortization of inventory step-up                                 27             -               27            -
                           Asset impairment and loss on divestiture                           -              7              17             7
                           Net gain on insurance recovery for property damage                 -             -                (9)          -
                           Unfavorable arbitration loss                                       -             -                -            14
                           Officer stock awards modification                                  -             -                -             2
                           Gain on derecognition of subsidiary                                -           (177)              -          (177)
                           Adjusted operating income                                  $     448 $          340       $     990 $       1,232
                           Adjusted operating margin                                       11.4%         13.3%             9.7%        12.1%

© BorgWarner Inc.                                                            22
Fourth Quarter and Year-to-Date Reconciliation to US GAAP
 Adjusted Earnings Per Diluted Share
 The Company defines adjusted earnings per diluted share as earnings per diluted share adjusted to eliminate the impact of restructuring expense, merger, acquisition and
 divestiture expense, other net expenses, discontinued operations, other gains and losses not reflective of the Company's ongoing operations, and related tax effects.

                                                                                         Three Months Ended                  Year Ended
                                                                                            December 31,                    December 31,
                                                                                             2020           2019           2020           2019

                                   Earnings per diluted share                            $      1.52    $      1.06    $      2.34    $      3.61

                                   Non-comparable items:
                                    Restructuring expense                                       0.53           0.11           0.86           0.26
                                    Merger, acquisition and divestiture expense                 0.13           0.01           0.38           0.05
                                    Intangible asset accelerated amortization                   0.13             -            0.14             -
                                    Amortization of inventory step-up                           0.09             -            0.10             -
                                    Asset impairment and loss on divestiture                      -            0.03           0.08           0.03
                                    Net gain on insurance recovery for property damage            -              -           (0.04)            -
                                    Unfavorable arbitration loss                                  -              -              -            0.07
                                    Officer stock awards modification                             -              -              -            0.01
                                    Gain on derecognition of subsidiary                           -           (0.02)            -           (0.02)
                                    Unrealized gain on equity securities                       (1.26)            -           (1.36)            -
                                    Delayed-draw term loan cancellation                           -              -            0.01             -
                                    Pension settlement loss                                     0.02             -            0.02           0.10
                                    Tax adjustments                                             0.02          (0.02)          0.23           0.02

                                   Adjusted earnings per diluted share                   $      1.18    $      1.17    $      2.76    $      4.13

© BorgWarner Inc.                                                              23
FY’21 Adj. Operating Income and Adj Operating Margin
Reconciliation to US GAAP

                                                                      Full Year 2021 Guidance
                                                                        Low            High

                    Net Sales                                     $       14,700   $     15,300

                    Operating income                              $        1,260 $        1,450
                    Operating margin                                        8.6%           9.5%

                    Non-comparable items
                    Restructuring expense                         $          200   $        150
                    Merger, acquisition and divestiture expense               10             10

                    Adjusted operating income                     $        1,470 $        1,610
                    Adjusted operating margin                              10.0%          10.5%

© BorgWarner Inc.                                    24
FY’21 Adj. Earnings per Diluted Share Reconciliation to US GAAP

                                                                       Full Year 2021 Guidance
                                                                          Low          High

                    Earnings per diluted share                         $     3.23   $      3.77

                    Non-comparable items:
                         Restructuring and other expense                     0.58          0.44
                         Merger, acquisition and divestiture expense         0.04          0.04

                    Adjusted earnings per diluted share                $     3.85   $      4.25

© BorgWarner Inc.                                    25
FY’20 and FY’21 Free Cash Flow to Reconciliation to US GAAP
The Company defines free cash flow as net cash provided by operating activities minus capital expenditures, including tooling outlays. The measure is useful to both management
and investors in evaluating the Company’s ability to service and repay its debt.

                                                                           Three Months Ended       Year Ended
                                                                              December 31,         December 31,
                                                                             2020       2019      2020      2019
                           Net cash provided by operating activities       $     416 $      184 $   1,224 $   1,008
                           Derecognition of subsidiary                           -          172       -         172
                           Capital expenditures, including tooling outlays      (219)      (135)     (481)     (481)
                           Free cash flow                                  $     197 $      221 $     743 $     699

                                                                                         Full Year 2021 Outlook
                                                                                            Low         High
                                         Net cash provided by operating activities       $     1,450 $    1,600
                                         Capital expenditures, including tooling outlays        (650)      (700)
                                         Free cash flow                                  $       800 $      900

© BorgWarner Inc.                                                              26
Key Definitions
    The terms below are commonly used by management and investors in assessing
    ongoing financial performance:

    ▪ Organic Net Sales Change. BorgWarner net sales change year over year excluding
        the estimated impact of foreign exchange (FX) and net M&A.

    ▪ Market. For 2020, light vehicle production weighted for BorgWarner's geographic
        exposure as estimated by BorgWarner. For 2021, light and commercial vehicle
        production weighted for BorgWarner’s geographic exposure as estimated by
        BorgWarner.

    ▪ Outgrowth. For 2020, BorgWarner's “Organic Net Sales Change” vs. year-over-year
        change in “Market”. For 2021 “Organic Net Sales Change” excluding Aftermarket
        segment vs. year-over-year change in “Market”.

© BorgWarner Inc.                           27
You can also read