First Quarter 2018 Business Update - April 26, 2018

Page created by Michael Rhodes
 
CONTINUE READING
First Quarter 2018 Business Update - April 26, 2018
First Quarter 2018
Business Update
    April 26, 2018
First Quarter 2018 Business Update - April 26, 2018
First Quarter 2018 Results (GAAP Basis)

                                                                     $ in millions, except EPS

                                                                             Q1            % of    Q1     % of     Increase /
                                                                            2018         Sales    2017    Sales   (Decrease)
          Net sales                                                         $756                  $733                3%

          Gross profit                                                        332        44.0%     316    43.1%       5%

          Royalty income                                                          8        1.1%     11     1.4%     (24%)

          SG&A                                                                280        37.1%     248    33.8%      13%

          Operating income                                                      60         8.0%     78    10.7%     (23%)

          Interest and other, net                                                 7        1.0%      7     0.9%      10%

          Income before taxes                                                   53         7.0%     72     9.8%     (26%)

          Income taxes                                                          10                  25              (59%)

          Net income                                                          $42          5.6%    $47     6.4%      (9%)

          Diluted EPS                                                      $0.89                  $0.95              (6%)

          Weighted average shares outstanding                                   47                  49               (3%)
                         1
          EBITDA                                                              $83        10.9%     $98    13.4%     (16%)
1 Non-GAAP   measure; see reconciliation to net income on page 27.
Note: Results may not be additive due to rounding.                                                                              2
First Quarter 2018 Business Update - April 26, 2018
First Quarter 2018 Highlights
                                                                                 $ in millions, except EPS
                                                                                  Adjusted
                     Net Sales                                                Operating Income*                       Adjusted EPS*
                                                                         (Adjusted Operating Margin)
                                         +3%                                                                                    +12%
                                                                                                      (9%)
                                         $756                               $80                                                  $1.09
           $733                                                                                       $73      $0.97

                                                                         11.0%                       9.6%
                                                                           of                         of
                                                                        Net Sales                  Net Sales

          2017                           2018                              2017                      2018      2017              2018
     •   Net sales +3%
          - Growth led by U.S. Retail and International segments
          - Good contributions from Skip Hop and Mexico (both acquired in 2017)

     •   Adjusted operating profit $73 million (vs. $80 million LY), reflecting lower U.S. Wholesale revenue
         and higher investment spending
     •   Adjusted EPS +12% to $1.09; reflects benefit from tax reform and lower share count
* Results are stated on an adjusted basis; see reconciliation to GAAP on pages 25 and 26.                                                3
First Quarter 2018 Business Update - April 26, 2018
First Quarter 2018 Net Sales

                                                                   $ in millions
                                                      Retail1                         Canada
                                                      Comp                            xRetail1,2     +3%
                                                                                       Comp
                                                      +3.0%
                                                                                       +3.6%

                                                       $20            ($12)             $15          $756
                     $733

                    Q1 2017                          U.S. Retail   U.S. Wholesale   International   Q1 2018
               Growth vs. 2017                       +5.5%            (4.0%)          +19.3%         +3.1%

                                                                                      Constant      Constant
1 Aggregatestore and eCommerce comparable sales
                                                                                      Currency      Currency
2Local currency                                                                        +15.7%        +2.8%
Note: Results may not be additive due to rounding.                                                             4
First Quarter 2018 Business Update - April 26, 2018
First Quarter 2018 Adjusted Results*

                                                                                $ in millions, except EPS

                                                                                         Q1               % of      Q1     % of     Increase /
                                                                                        2018             Sales     2017    Sales   (Decrease)
          Net sales                                                                     $756                       $733                3%

          Gross profit                                                                     332           44.0%      316    43.1%       5%

          Royalty income                                                                       8           1.1%      11     1.4%     (24%)

          Adjusted SG&A*                                                                   268           35.4%      246    33.6%       9%

          Adjusted operating income*                                                         73            9.6%      80    11.0%      (9%)

          Interest and other, net                                                              7           1.0%       7     0.9%      10%

          Income before taxes                                                                65            8.6%      74    10.0%     (11%)

          Income taxes                                                                       13                      26              (48%)

          Adjusted net income*                                                             $52             6.9%     $48     6.5%       9%

          Adjusted diluted EPS*                                                        $1.09                       $0.97              12%

          Weighted average shares outstanding                                                47                      49               (3%)

          Adjusted EBITDA*                                                                 $95           12.6%     $100    13.7%      (5%)
* Results are stated on an adjusted basis, a non-GAAP presentation; see reconciliation to GAAP on pages 25 – 27.
 Note: Results may not be additive due to rounding.                                                                                              5
First Quarter 2018 Business Update - April 26, 2018
Balance Sheet and Cash Flow
                                                         $ in millions

                                                                     2018          2017
                                                                                            •   Inventory +10% vs. LY, primarily driven by
                              Cash                                        $180     $154
                                                                                                growth initiatives (Retail, Amazon, Skip Hop,
    Balance Sheet             Accounts Receivable                          221      207         and Mexico)
     (at Q1 end)
                              Inventory                                    479      435
                                                                                            •   Increase in short term borrowings to support
                              Accounts Payable                             116      101
                                                                                                working capital needs and return of
                              Long-Term Debt                               618      582         capital initiatives

                                                                                            •   Decline in operating cash flow reflects
                                                                         2018      2017         change in working capital
       Cash Flow               Operating Cash Flow                         $64       $84        - Forecasting full year operating cash flow
         (Q1)                                                                                     of approximately $350 to $375 million
                               Capital Expenditures                         (15)     (18)
                                                     1
                               Free Cash Flow                              $49       $66
                                                                                            •   Returned $46 million to shareholders through
                                                                                                share repurchases and dividends in Q1 2018
                                                                         2018      2017

         Return of             Share Repurchases                           $25       $47
          Capital
                               Dividends                                    21        18
           (Q1)
                               Total                                       $46       $65

1 Non-GAAP  measure.
                                                                                                                                                6
Note: Results may not be additive due to rounding.
First Quarter 2018 Business Update - April 26, 2018
Business Segment
  Performance

                   7
First Quarter 2018 Business Update - April 26, 2018
First Quarter 2018
   Adjusted Business Segment Performance*
                                                                                        $ in millions

                                                                                                                                              Adjusted
                                                                                                              Adjusted Operating             Operating
                                                                           Net Sales                                  Income*                 Margin*

                                                                                                   $                              $
                                                               2018            2017          Growth          2018      2017     Growth      2018     2017

U.S. Retail (a)                                                 $384             $364              $20        $29        $30       ($1)      7.6%     8.2%

U.S. Wholesale                                                    281              293              (12)       63         70          (7)   22.4%    23.8%

International (b)                                                   91               76                15       4          4           –     4.1%     4.8%

Total before corporate expenses                                   756              733                 23      96        103          (7)   12.7%    14.1%

Corporate expenses                                                                                             (23)      (23)          –    (3.1%)   (3.1%)

Total                                                           $756             $733              $23        $73        $80       ($8)      9.6%    11.0%

 (a) Results include U.S. stores and eCommerce.
 (b) Results include international stores, eCommerce, and wholesale.
* Results are stated on an adjusted basis, a non-GAAP presentation; see reconciliation to GAAP on page 26.
 Note: Results may not be additive due to rounding.                                                                                                         8
First Quarter 2018 Business Update - April 26, 2018
First Quarter Highlights – U.S. Retail
                                    $ in millions
                          Segment Net Sales                                 Total                                   Q1 Highlights
                                                                           Sales
                                                         $384              +5.5%           •   Q1 Retail comp +3.0%
                        $364
                                                                                                - Driven by double-digit eCommerce growth
                                                                           Retail               - Winter weather negatively affected comparable
                                                                           Comp                   traffic and sales
                                                                           +3.0%
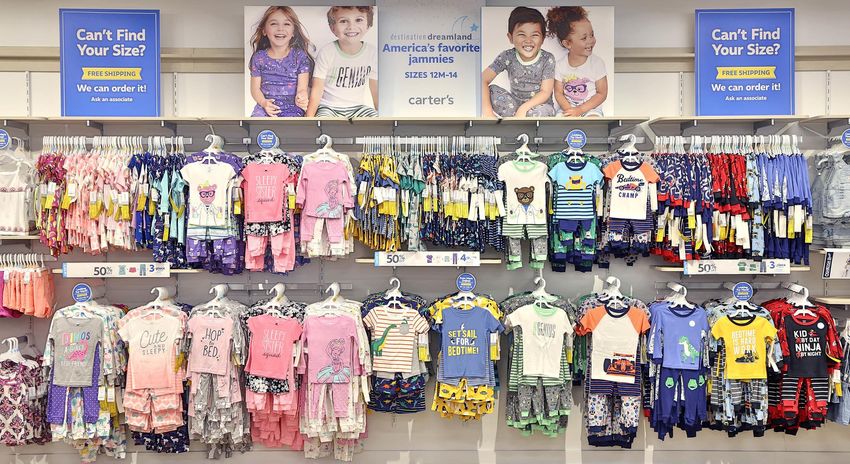
                                                                                           •   Co-branded format remains best performing store model
                                                                                               (comp +4%)

                                                                                           •   Good progress with portfolio optimization initiative –
                                                                                               encouraging initial sales transfer from closed doors
                                                                                                - Opened 9, closed 21 stores in Q1; Q1 store count 818*
                      Q1 2017                         Q1 2018                                   - 2018 outlook: ~50 openings, ~35 closings

                    Segment Operating Income1                                              •   Segment operating margin 7.6% vs. 8.2% LY
                          $30                                                                   - Margin reflects planned investments in marketing,
                                                          $29
                                                                                                  eCommerce fulfillment and technology, partially offset
                                                                                                  by lower product costs

                       8.2%                            7.6%                                •   Key initiatives for 2018
                        of                              of                                      - Store productivity (portfolio optimization,
                     Net Sales                       Net Sales                                    technology enhancements)
                                                                                                - eCommerce shipping speed
                                                                                                - Carter’s extended sizing (increase from NB-8 to NB-14)
                      Q1 2017                         Q1 2018                                   - Toys “R” Us / Bon-Ton sales recapture

1 Results are stated on an adjusted basis, a non-GAAP presentation; see reconciliation to GAAP on page 26.
                                                                                                                                                           9
* See store count reconciliation on page 30.
First Quarter 2018 Business Update - April 26, 2018
Co-branded Store – Santa Maria, CA
(Opened Q1 2018)

                                     10
Co-branded Store – Tustin, CA
(Converted Q1 2018)

                                11
Carter’s Brand Marketing Campaign

                                                      •   Launched mid-March

                                                      •   Digital focus

                                                      •   Meaningful initial
                                                          consumer reach:
                                                            - Impressions: 263M
                                                            - Video views: 49M

                                                           Click here to view video

Note: Consumer reach metrics through April 23, 2018                                   12
Carter’s Continues to Lead in Consumer Following
   and Engagement in Social Media

              Carter’s achieves milestone of 1 million                                          Carter’s earned 20 of the top 25 engagement scores
                       followers on Instagram                                                                among peers on Instagram

                         Instagram Followers
           Carter's                                                              1M
         Gap Kids                                                         893K
     Disney Baby                               418K
 Children's Place                            372K
         OshKosh                            355K
         Skip Hop                        296K
      Gymboree                          262K
 Janie and Jack                        246K
           Crazy 8            89K
      Garanimals            49K
        Stride Rite         40K

                          Facebook Followers
           Carter's                                                          3.8M
     Disney Baby                                                 2.9M
 Children's Place                                       2.2M
      Garanimals                              1.4M
         OshKosh                       972K
      Gymboree                        892K
        Stride Rite           439K
           Crazy 8           325K
         Skip Hop            301K
 Janie and Jack             277K
         Gap Kids         27K

Source: Instagram and Facebook (followers as of 4/25/18). Third-party engagement scoring from 12/31/17 through 3/31/18.                              13
First Quarter Highlights – U.S. Wholesale

                                    $ in millions
                          Segment Net Sales                             Total
                                                                        Sales                                         Q1 Highlights
                                                                        (4%)
                        $293                            $281
                                                                                              •   U.S. Wholesale segment net sales -4%
                                                                                                   - Reflects timing of shipments, partially offset by
                                                                                                     contribution from Skip Hop and higher replenishment /
                                                                                                     Little Baby Basics demand

                                                                                              •   Segment operating margin 22.4% vs. 23.8% LY
                                                                                                   - Principally reflects addition of Skip Hop (lower margin
                                                                                                     business in Q1)
                                                                                                   - Margin in core business relatively consistent vs. LY
                      Q1 2017                         Q1 2018
                                                                                              •   Full year 2018 segment net sales outlook
                    Segment Operating Income*                                                      - Down low-single digits (previously low-single digit
                                                                                                      growth) due to customer bankruptcies
                          $70
                                                         $63                                       - Includes recapturing 50% of lost sales across
                                                                                                      wholesale and retail channels
                                                                                                   - Planning mid-single digit growth in Little Baby Basics,
                      23.8%                           22.4%                                           ex-Toys “R” Us
                        of                              of
                     Net Sales                       Net Sales

                      Q1 2017                         Q1 2018

* Results are stated on an adjusted basis, a non-GAAP presentation; see reconciliation to GAAP on page 26.                                                     14
15
16
17
Skidaddle by Skip Hop Developed For Walmart

                                              18
First Quarter Highlights – International
                                    $ in millions
                             Segment Net Sales
                                                                           Total                                                 Q1 Highlights
                                                         $91
                                                                           Sales             •   International segment net sales +19%
                                                                           +19%                  (+16% constant currency)
                         $76
                                                                                                  - Meaningful contributions from Skip Hop and
                                                                                                     Mexico acquisitions

                                                                                             •   Canada
                                                         $91                                      - Double-digit sales growth; retail comp sales +3.6%
                         $76
                                                                                                  - Winter weather negatively affected comparable store
                                                                                                    traffic and sales
                                                                                                  - Skip Hop launched in stores in Q1;
                                                                                                    early results encouraging

                     Q1 2017                         Q1 2018                                 •   Mexico
                                                                                                 - Integration off to a good start
                                                                                                 - Performance in line with expectations
                  Segment Operating Income*
                          $4                             $4                                  •   China net sales comparable to LY

                                                                                             •   Segment operating margin
                      4.8%                            4.1%                                        − Margin reflects channel mix and lower margin Skip Hop
                       of                              of                                           business, partially offset by net benefit of
                    Net Sales                       Net Sales                                       Mexico acquisition

                     Q1 2017                         Q1 2018
* Results are stated on an adjusted basis, a non-GAAP presentation; see reconciliation to GAAP on page 26. Results may not be additive due to rounding.   19
International Store – Mexico City

                                    20
Skip Hop – Canada Retail Presence

                                    21
2018 Outlook
      (Adjusted Basis)

                            •   Net sales growth of approximately 3%
                                 - Growth assumes ~50% recapture of lost sales
                                   related to wholesale customer bankruptcies
                                 - Good second half growth planned in U.S. Retail
                                   and International segments
       Fiscal Year
           2018
                            •   EPS growth of approximately 12% (vs. $5.77 in 20171)
                                 - Reflects ~50% recapture of lost wholesale sales
                                   and reduction in discretionary spending

                            •   CapEx approximately $100 million

                            •   Net sales of approximately $680 million
                                (vs. $692 million Q2 2017)
                                 - Absence of planned wholesale volume from
                                   bankrupt customers
                                 - U.S. Retail sales affected by Easter shift and
         Q2 2018                   continued cold weather pattern

                            •   EPS of approximately $0.53 (vs. $0.79 Q2 20171)
                                 - Adverse impact of customer bankruptcies
                                 - U.S. Retail expense deleverage

1   Results are stated on an adjusted basis, a non-GAAP presentation; see reconciliation to GAAP on pages 28 and 29.   22
thank you.

         23
appendix

           24
First Quarter Reconciliation of Net Income
   Allocable to Common Shareholders
                                                                                                                                         Fiscal Quarter Ended

                                                                                                                                 March 31, 2018             April 1, 2017
   Weighted-av erage number of common and common equiv alent shares outstanding:
    Basic number of common shares outstanding                                                                                            46,772,737                48,322,692
    Dilutiv e effect of equity awards                                                                                                       618,678                   554,994
      Diluted number of common and common equiv alent shares outstanding                                                                 47,391,415                48,877,686

                                                                                                                   Fiscal Quarter Ended
                                                                                   As reported on a GAAP Basis                                  As adjusted (a)

$ in thousands, except EPS                                                     March 31, 2018                  April 1, 2017         March 31, 2018              April 1, 2017
Basic net income per common share:
   Net income                                                                  $          42,469           $          46,595         $          51,956       $          47,774
   I ncome allocated to participating securities                                            (325)                       (369)                     (400)                   (379)
     Net income av ailable to common shareholders                              $          42,144           $          46,226         $          51,556       $          47,395
Basic net income per common share                                                            $0.90                      $0.96                      $1.10                  $0.98

Diluted net income per common share:
   Net income                                                                  $          42,469           $          46,595         $          51,956       $          47,774
   I ncome allocated to participating securities                                            (323)                       (367)                     (397)                   (376)
     Net income av ailable to common shareholders                              $          42,146           $          46,228         $          51,559       $          47,398

Diluted net income per common share                                                          $0.89                      $0.95                      $1.09                  $0.97

(a) In addition to the results provided in this earnings release in accordance with GAAP, the Company has provided adjusted, non-GAAP financial measurements that present per
    share data excluding the adjustments discussed above. The Company has excluded $9.5 million and $1.2 million in after-tax expenses from these results for the fiscal quarters
    ended March 31, 2018, and April 1, 2017, respectively.

Note: Results may not be additive due to rounding.                                                                                                                               25
First Quarter Reconciliation of
     Reported to Adjusted Earnings
                                                                                                  $ in millions, except EPS
                                                                                                                                                                       Segment Reporting

                                                                                                                              U.S. Retail       % of    U.S. Wholesale   % of      International     % of      Corporate      % of
                                     Gross       % of                  % of    Operating % of              Net     Diluted    Operating       segment     Operating    segment       Operating     segment     Operating     total
First Quarter of Fiscal 2018         Margin    net sales   SG&A      net sales  Income net sales         Income      EPS       Income         net sales     Income     net sales      Income       net sales   Expenses    net sales

As reported (GAAP) (a)                $332.5      44.0%    $280.2       37.1%       $60.3        8.0%     $42.5       0.89           $29.5         7.7%        $50.3       17.9%           $3.8         4.1%     ($23.2)       (3.1%)
Customer bankruptcy
charges (c) (d)                           -                 (12.8)                   12.8                   9.8       0.20             -                        12.8                        -                       -
Store restructuring costs (c) (e)         -                   0.4                    (0.4)                 (0.3)     (0.01)           (0.4)                      -                          -                       -
As adjusted (b)                       $332.5      44.0%    $267.8       35.4%       $72.7        9.6%     $52.0       1.09           $29.1         7.6%        $63.0       22.4%           $3.8         4.1%     ($23.2)       (3.1%)

                                                                                                                               Segment Reporting

                                                                                                                              Corporate         % of
                                     Gross       % of                  % of      Operating     % of       Net      Diluted    Operating        total
First Quarter of Fiscal 2017         Margin    net sales   SG&A      net sales    Income     net sales   Income     EPS       Expenses        net sales

As reported (GAAP) (a)                $315.7      43.1%    $247.8       33.8%       $78.5       10.7%     $46.6       0.95          ($24.7)      (3.4%)

Acquisition costs (f)                    -                   (1.6)                    1.6                   1.1       0.02             1.6
Direct sourcing initiative (c) (g)       -                   (0.2)                    0.2                   0.1        -               0.2
As adjusted (b)                       $315.7      43.1%    $245.9       33.6%       $80.3       11.0%     $47.8       0.97          ($22.8)      (3.1%)

(a) Beginning in fiscal 2018, the Company adopted the Financial Accounting Standards Board’s Accounting Standards Codification No. 606, Revenue from Contracts with
    Customers, and related amendments (“ASC 606”) using the full retrospective adoption method. All periods in fiscal 2017 and fiscal 2016 were amended to reflect these
    provisions, and retained earnings at January 2, 2016 (beginning of fiscal 2016) were adjusted for the cumulative effect of periods prior to fiscal 2016. The adoption of ASC
    606 had no material effect on the Company’s consolidated financial position, results of operations, and cash flows.
(b) In addition to the results provided in this earnings release in accordance with GAAP, the Company has provided adjusted, non-GAAP financial measurements that present
    gross margin, SG&A, operating income, net income, and net income on a diluted share basis excluding the adjustments discussed above. The Company believes these
    adjustments provide a meaningful comparison of the Company’s results and affords investors a view of what management considers to be the Company's core
    performance. The adjusted, non-GAAP financial measurements included in this earnings release should not be considered as an alternative to net income or as any other
    measurement of performance derived in accordance with GAAP. The adjusted, non-GAAP financial measurements are presented for informational purposes only and are
    not necessarily indicative of the Company’s future condition or results of operations.
(c) The difference between the impacts on operating income and net income represents the income taxes related to the adjustment item (calculated using the applicable
    tax rate of the underlying jurisdiction).
(d) Related to the Toys "R" Us bankruptcy.
(e) Insurance recovery associated with unusual storm-related store closures.
(f) Non-recurring costs related to the Skip Hop and Mexico acquisitions. SG&A and operating income include approximately $0.4 million of costs incurred during the first
    quarter of fiscal 2017 that were not originally reported as acquisition-related costs.
(g) Costs associated with the Company's direct sourcing initiative, which include severance and relocation.

Note: Results may not be additive due to rounding.                                                                                                                                                                               26
Reconciliation of Net Income
   to Adjusted EBITDA
                                                                                   $ in millions
                                                                                                                                                     Four Fiscal
                                                                                                      Fiscal Quarter Ended                         Quarters Ended

                                                                                             March 31, 2018               April 1, 2017            March 31, 2018

            Net income                                                                       $               42.5        $              46.6        $            298.6
            Interest expense                                                                                  8.0                         7.1                      30.9
            Interest income                                                                                  (0.2)                      (0.1)                       (0.4)
            Tax expense                                                                                      10.4                       25.1                       73.4
            Depreciation and amortization                                                                   22.1                        19.8                      86.7
            EBITDA                                                                           $              82.7         $              98.4        $            489.2

            Adjustments to EBITDA
            Special employee compensation provision (a)                                      $               -           $              -           $             21.2
            Customer bankruptcy charges (b)                                                                 12.8                        -                         12.8
            Acquisition-related costs (c)                                                                    -                          1.6                        3.0
            Store restructuring costs (d)                                                                   (0.4)                       -                          2.3
            Direct sourcing initiative (e)                                                                   -                          0.2                        0.1
            Acquisition contingency fair value adjustment (f)                                                -                          -                         (3.6)
            Adjusted EBITDA                                                                  $              95.2         $            100.3         $            524.9

(a) Special employee compensation provision related to significant benefit related to the enactment of the Tax Cuts and Jobs Act of 2017; includes $1.2 million in related
    payroll taxes.
(b) Related to the Toys "R" Us bankruptcy.
(c) Non-recurring costs incurred in connection with the Skip Hop and Mexico business acquisitions. SG&A and operating income include approximately $0.4 million of costs
    incurred during the first quarter of fiscal 2017 that were not originally reported as acquisition-related costs.
(d) Net costs arising from unusual storm damage and related store closures.
(e) Costs associated with the Company's direct sourcing initiative, which include severance and relocation.
(f) Revaluation of the contingent consideration liability associated with the Company's acquisition of Skip Hop.
Note: Results may not be additive due to rounding.                                                                                                                           27
2017 Second Quarter Reconciliation of
     Reported to Adjusted Earnings
                                                                                           $ in millions, except EPS

                                                                                                                                                             Segment Reporting

                                                                                                                      U.S. Retail     % of    U.S. Wholesale   % of      International     % of      Corporate      % of
                                     Gross       % of                  % of    Operating % of        Net    Diluted   Operating     segment     Operating    segment       Operating     segment     Operating     total
Second Quarter of Fiscal 2017        Margin    net sales   SG&A      net sales  Income net sales   Income     EPS      Income       net sales     Income     net sales      Income       net sales   Expenses    net sales

As reported (GAAP) (a)                $303.2      43.8%    $250.1      36.2%     $64.3      9.3%    $37.8     $0.77        $42.1       10.8%         $35.8      16.4%            $7.6         9.2%     ($21.2)       (3.1%)
Acquisition related costs (c)            0.4                 (0.8)                 1.2                0.8      0.01          0.0                       0.2                        0.1                     0.8
Direct sourcing initiative (c) (d)        -                  (0.1)                 0.1                 -         -            -                         -                          -                      0.0
As adjusted (b)                       $303.6      43.9%    $249.3      36.0%     $65.6      9.5%    $38.6     $0.79        $42.1       10.8%         $36.0      16.6%            $7.7         9.4%     ($20.4)       (2.9%)

(a) In addition to the results provided in this presentation in accordance with GAAP, the Company has provided adjusted, non-GAAP financial measurements that present
    gross margin, SG&A expenses, operating income, net income, and diluted EPS excluding the adjustment items noted above and discussed above. The Company believes
    these non-GAAP measurements provide investors with a meaningful view of the Company’s core operating results, and are the same measurements used by the
    Company's executive management to assess the Company's performance. The adjusted, non-GAAP financial measurements included in this presentation should not be
    considered as an alternative to net income or as any other measurement of performance derived in accordance with GAAP. The adjusted, non-GAAP financial
    measurements are presented for informational purposes only and are not necessarily indicative of the Company’s future condition or results of operations.
(b) In addition to the results provided in this earnings release in accordance with GAAP, the Company has provided adjusted, non-GAAP financial measurements that present
    gross margin, SG&A, operating income, net income, and net income on a diluted share basis excluding the adjustments discussed above. The Company believes these
    adjustments provide a meaningful comparison of the Company’s results and affords investors a view of what management considers to be the Company's core
    performance. The adjusted, non-GAAP financial measurements included in this earnings release should not be considered as an alternative to net income or as any other
    measurement of performance derived in accordance with GAAP. The adjusted, non-GAAP financial measurements are presented for informational purposes only and are
    not necessarily indicative of the Company’s future condition or results of operations.
(c) The difference between the impacts on Operating Income and Net Income represents the income taxes related to the adjustment item (calculated using the applicable
    tax rate of the underlying jurisdiction).
(d) Costs associated with the Company's direct sourcing initiative, which include severance and relocation.

Note: Results may not be additive due to rounding.                                                                                                                                                                     28
2017 Full Year Reconciliation of
      Reported to Adjusted Earnings
                                                                                              $ in millions, except EPS

                                                                                                                                                                   Segment Reporting

                                                                                                                            U.S. Retail     % of    U.S. Wholesale   % of      International     % of      Corporate      % of
                                     Gross        % of                    % of    Operating % of        Net      Diluted    Operating     segment     Operating    segment       Operating     segment     Operating     total
Fiscal 2017                          Margin     net sales   SG&A        net sales  Income net sales   Income       EPS       Income       net sales     Income     net sales      Income       net sales   Expenses    net sales

As reported (GAAP) (a)               $1,483.4      43.6%    $1,106.9      32.6%    $419.6     12.3%    $302.8      $6.24        $215.6       12.1%        $252.1      20.8%          $46.4         11.2%     ($94.5)       (2.8%)
Special employee compensation
  provision (c) (d)                       -                    (21.2)                21.2                15.1       0.31          12.7                       3.3                        2.3                     2.9
Store restructuring costs (c)             -                     (2.7)                 2.7                 1.5       0.03           2.7                       -                          -                       -
Acquisition costs (c)                     1.2                    0.2                  1.0                 0.2        -             0.1                       0.7                        0.4                    (0.2)
Direct sourcing initiative (c) (e)        -                     (0.3)                 0.3                 0.2        -             -                         -                          -                        0.3
Tax reform (f)                            -                      -                    -                 (40.0)     (0.83)          -                         -                          -                       -
As adjusted (b)                      $1,484.6      43.7%    $1,082.9      31.8%    $444.8     13.1%    $279.8      $5.77        $231.2       13.0%        $256.0      21.2%          $49.1         11.8%     ($91.5)       (2.7%)

  (a) Beginning in fiscal 2018, the Company adopted the Financial Accounting Standards Board’s Accounting Standards Codification No. 606, Revenue from Contracts with
      Customers, and related amendments (“ASC 606”) using the full retrospective adoption method. All periods in fiscal 2017 and fiscal 2016 were amended to reflect these
      provisions, and retained earnings at January 2, 2016 (beginning of fiscal 2016) were adjusted for the cumulative effect of periods prior to fiscal 2016. The adoption of ASC 606
      had no material effect on the Company’s consolidated financial position, results of operations, and cash flows.
  (b) In addition to the results provided in this earnings release in accordance with GAAP, the Company has provided adjusted, non-GAAP financial measurements that present
      gross margin, SG&A, operating income, net income, and net income on a diluted share basis excluding the adjustments discussed above. The Company believes these
      adjustments provide a meaningful comparison of the Company’s results and affords investors a view of what management considers to be the Company's core performance.
      The adjusted, non-GAAP financial measurements included in this earnings release should not be considered as an alternative to net income or as any other measurement of
      performance derived in accordance with GAAP. The adjusted, non-GAAP financial measurements are presented for informational purposes only and are not necessarily
      indicative of the Company’s future condition or results of operations.
  (c) The difference between the impacts on operating income and net income represents the income taxes related to the adjustment item (calculated using the applicable tax
      rate of the underlying jurisdiction).
  (d) Special employee compensation provision related to significant benefit related to the enactment of the Tax Cuts and Jobs Act of 2017.
  (e) Costs associated with the Company's direct sourcing initiative, which include severance and relocation.
  (f) Reflects the $40 million net benefit of the Tax Cuts and Jobs Act of 2017.
 Note: Results may not be additive due to rounding.                                                                                                                                                                          29
Store Count Data

                                            Single-brand             Dual-brand                      Dual-brand
                                                 U.S.           U.S.            U.S.                  Canada                                      Total
                                            Stand-alone    Side-by-Side Co-branded     Total U.S.    Co-branded                    Total      Consolidated
                                               Format         Format          Format     Retail        Format     Mexico 1    International    Retail Stores

Store count at April 1, 2017                        622           145            35           802          163         N/A            163               965
Openings                                              9            12            30            51           17           3             17                68
Closings                                            (35)             -             -          (35)          (1)           -            (1)              (36)
Conversions to dual-brand formats                   (43)            2            41              -            -           -              -                 -
Acquired                                               -             -             -             -            -         39             39                39
Store count at March 31, 2018                       553           159           106           818          179          42            221             1,039

1   Includes single brand and co-branded formats                                                                                                         30
Forward-looking Statements
and Other Information
Results provided in this presentation are preliminary and unaudited. This presentation should be read in conjunction with the audio
broadcast or transcript of the Company’s earnings call, held on April 26, 2018 which is available at www.carters.com. This
presentation contains forward-looking statements within the meaning of the safe harbor provisions of the Private Securities Litigation
Reform Act of 1995 relating to the Company’s future performance, including, without limitation, statements with respect to the
Company’s anticipated financial results for the second quarter of fiscal 2018 and fiscal year 2018, or any other future period,
assessments of the Company’s performance and financial position, and drivers of the Company’s sales and earnings growth. Such
statements are based on current expectations only, and are subject to certain risks, uncertainties, and assumptions. Should one or
more of these risks or uncertainties materialize or not materialize, or should underlying assumptions prove incorrect, actual results may
vary materially from those anticipated, estimated, or projected. Certain of the risks and uncertainties that could cause actual results
and performance to differ materially are described in the Company’s most recently filed Annual Report on Form 10-K and other
reports filed with the Securities and Exchange Commission from time to time under the headings “Risk Factors”. Included among the
risks and uncertainties that may impact future results are the risks of: losing one or more major customers, vendors, or licensees due to
competition, inadequate quality of the Company’s products, or otherwise; financial difficulties for one or more of the Company’s
major customers, vendors, or licensees, or an overall decrease in consumer spending; our products not being accepted in the
marketplace due to quality concerns, changes in consumer preference and fashion trends, or otherwise; a failure to meet regulatory
requirements, including those relating to product quality and safety; negative publicity, including as a result of product recalls or
otherwise; a failure to protect the Company’s intellectual property; various types of litigation, including class action litigation brought
under various consumer protection, employment, and privacy and information security laws; a breach of the Company’s consumer
databases, systems, or processes; slow-downs, disruptions, or strikes in the Company’s supply chain, including disruptions resulting from
foreign supply sources, the Company’s distribution centers, or in-sourcing capabilities; unsuccessful expansion into international
markets or failure to successfully manage legal, regulatory, political and economic risks of the Company’s existing international
operations, including maintaining compliance with worldwide anti-bribery laws; failure to successfully integrate acquired businesses;
fluctuations in foreign currency exchange rates; and an inability to obtain additional financing on favorable terms. The Company
does not undertake any obligation to publicly update or revise any forward-looking statements, whether as a result of new
information, future events, or otherwise.                                                                                                     31
You can also read