THE LEADING ACCELERATED COMPUTING PLATFORM - April 2020 - Amazon AWS
←
→
Page content transcription
If your browser does not render page correctly, please read the page content below
THE LEADING ACCELERATED
COMPUTING PLATFORM
April 2020
Except for the historical information contained herein, certain matters in this presentation including, but not limited to, statements as to: our financial
position; our markets; the TAM for our products; demand for computing power growing; growth drivers, including, but not limited to, gaming, data center, pro
visualization and automotive; our design applications benefiting from GPU acceleration; sustained growth in our profitability and businesses; future revenue
growth; increase in developers; the growing number of professional designers and creators; the number of end users for our products; our share of
supercomputing accelerators; our customer diversification and customer EBITDA; performance in our financial metrics such as operating cash flow, cash flow
and adjusted EBITDA; our opportunities in existing or new markets, such as autonomous vehicles; and our financial policy are forward-looking statements
within the meaning of the Private Securities Litigation Reform Act of 1995. These forward-looking statements and any other forward-looking statements that
go beyond historical facts that are made in this presentation are subject to risks and uncertainties that may cause actual results to differ materially.
Important factors that could cause actual results to differ materially include: global economic conditions; our reliance on third parties to manufacture,
assemble, package and test our products; the impact of technological development and competition; development of new products and technologies or
enhancements to our existing product and technologies; market acceptance of our products or our partners' products; design, manufacturing or software
defects; changes in consumer preferences and demands; changes in industry standards and interfaces; unexpected loss of performance of our products or
technologies when integrated into systems and other factors.

NVIDIA has based these forward-looking statements largely on its current expectations and projections about future events and trends that it believes may
affect its financial condition, results of operations, business strategy, short-term and long-term business operations and objectives, and financial needs. These
forward-looking statements are subject to a number of risks and uncertainties, and you should not rely upon the forward-looking statements as predictions of
future events. The future events and trends discussed in this presentation may not occur and actual results could differ materially and adversely from those
anticipated or implied in the forward-looking statements. Although NVIDIA believes that the expectations reflected in the forward-looking statements are
reasonable, the company cannot guarantee that future results, levels of activity, performance, achievements or events and circumstances reflected in the
forward-looking statements will occur. Except as required by law, NVIDIA disclaims any obligation to update these forward-looking statements to reflect future
events or circumstances. For a complete discussion of factors that could materially affect our financial results and operations, please refer to the reports we
file from time to time with the SEC, including our Annual Report on Form 10-K for the fiscal year ended January 26, 2020. Copies of reports we file with the
SEC are posted on our website and are available from NVIDIA without charge.

NVIDIA Corporation has filed a registration statement on Form S-3 (including a base prospectus) with the Securities and Exchange Commission (the "SEC").
Before you invest in any offering pursuant to such registration statement, you should read the applicable prospectus supplement, the accompanying
prospectus and the information incorporated therein by reference, including the sections titled “Risk Factors” set forth in those documents. When available,
you may obtain these documents for free by visiting EDGAR on the SEC website at www.sec.gov or from Goldman Sachs & Co. LLC, Attention: Prospectus
Department, 200 West Street, New York, NY 10282, or by telephone: 1-866-471-2526, by facsimile: 212-902-9316, or by emailing prospectus-
ny@ny.email.gs.com.

NVIDIA uses certain non-GAAP measures in this presentation including non-GAAP gross margin, non-GAAP operating margin, non-GAAP net income, free cash
flow, and adjusted EBITDA. NVIDIA believes the presentation of its non-GAAP financial measures enhances investors' overall understanding of the company's
historical financial performance. The presentation of the company's non-GAAP financial measures is not meant to be considered in isolation or as a substitute
for the company's financial results prepared in accordance with GAAP, and the company's non-GAAP measures may be different from non-GAAP measures used
by other companies. Further information relevant to the interpretation of non-GAAP financial measures, and reconciliations of these non-GAAP financial
measures to the most comparable GAAP measures, may be found in the slide titled “Reconciliation of Non-GAAP to GAAP Financial Measures.                  2

NVIDIA — A COMPUTING PLATFORM COMPANY
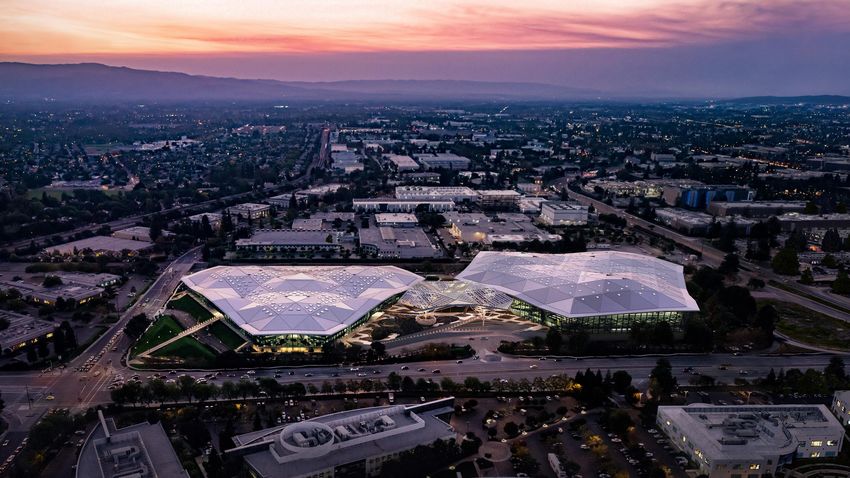
Headquarters: Santa Clara, CA
Headcount: 13,775
NVIDIA pioneered accelerated computing to help solve the most challenging computational problems. The approach is broadly recognized as
the way to advance computing as Moore’s law ends and AI lifts off. NVIDIA’s platform is installed in several hundred million computers, is
available in every cloud and from every server maker, powers 136 of the TOP500 supercomputers, and boasts 1.6 million developers.
3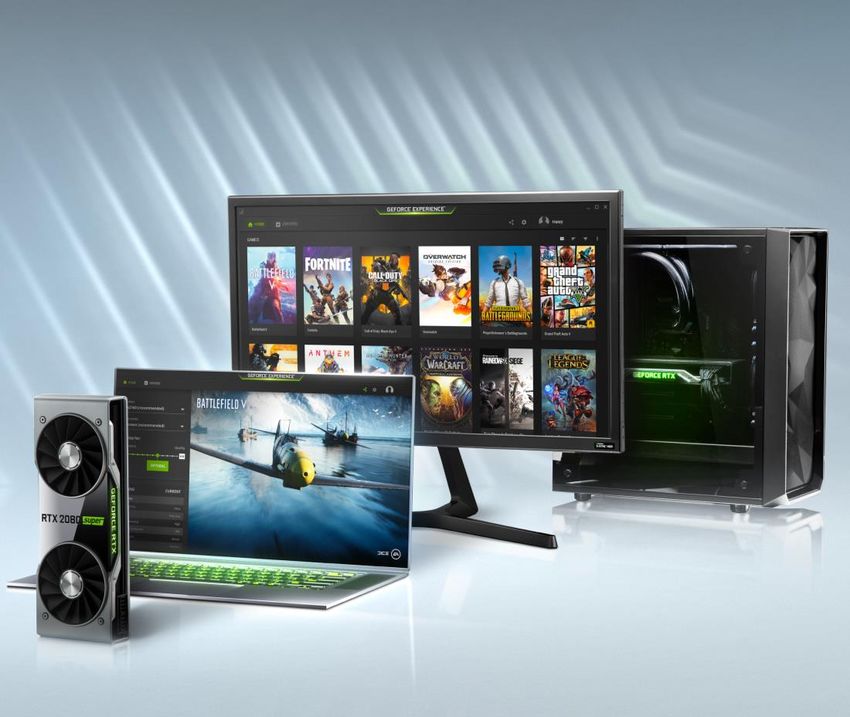
NVIDIA AT A GLANCE
                                               Accelerated Computing Pioneer
                           Brief History                                            Revenue by Market Platform

1993: Founded by Jensen Huang, Chris Malachowsky, and Curtis Priem                                 $11.7B
                                                                                                                $10.9B                 Gaming
                                                                                          $9.7B
1999: IPO on NASDAQ at $12 (prior to 4 stock splits, now 12:1)
                                                                                                                                       Data Center
                                                                                 $6.9B
2001: Xbox win; fastest semiconductor company to reach $1B in sales
                                                                      $5.0B                                                            ProViz
2006: Unveils CUDA architecture, expanding to scientific computing                                                                     Auto
2009: Inaugural GPU Technology Conference (GTC)                                                                                        OEM/IP
2016: Introduces first products for AI and autonomous driving         FY16       FY17      FY18    FY19              FY20         Fiscal Year End Jan

                           Recognitions                                       From Chip Vendor to Computing Platform
                                                                                                                                   Health-        Smart
                                                                                                      GAMING           HPC
            Harvard Business Review’s The CEO 100                                                                                   care         City/IOT
                                                                                                                                   Trans-
                                                                                                      PRO VIZ          AI                        Robotics
                  Fortune’s Best Places to Work                                                                                   portation
                                                                                                                             CUDA-X
                                                                                                                              CUDA
           MIT Tech Review’s 50 Smartest Companies
          Fortune’s World’s Most Admired Companies                                                    ARCHITECTURE           SYSTEMS          DATA CENTER

           Forbes JUST 100 Best Corporate Citizens                     1999               2014                               2019
                                                                      GM 30%+            GM 50%+                            GM 60%+
                 Dow Jones Sustainability Index
                                                                                                                                                            4
GROWTH DRIVERS

Gaming   AI         AR/VR   Self-driving Cars

                                                5
OUR CORE BUSINESSES

FY20 Revenue $5.52B,                           FY20 Revenue of $2.98B,                          FY20 Revenue of $1.21B,                           FY20 Revenue of $700M,
3-year CAGR of 11%                             3-year CAGR of 53%                               3-year CAGR of 13%                                3-year CAGR of 13%
Strong market position and                     Leader in deep learning/AI –                     90%+ market share in                              Current revenue driven
technology leadership                          used by all major cloud                          graphics for workstations                         largely by infotainment
                                               computing providers and
Compounded long-term unit                      thousands of enterprises                         Diversified end markets,                          Future growth expected to
and ASP growth                                                                                  e.g. media & entertainment,                       be driven largely by
                                               Leader in HPC - in 5 of the                      architecture, engineering &                       Autonomous Vehicle (AV)
200M+ gamers on our                            top 10 and 136 of the top                        construction, public sector                       solution offering full
platform                                       500 fastest supercomputers                                                                         hardware & software stack
                                                                                                Strong software ecosystem
Strong Gaming ecosystem                        Multiple secular growth                                                                            Large secular growth
                                               drivers: fast growing                            Multiple secular growth                           opportunity: autonomous
Multiple secular growth                                                                         drivers: expanding creative
drivers: expanding population                  adoption of AI in every major                                                                      vehicles estimated to drive
                                               industry; rising compute                         & design workflows, mobile                        a $25B TAM for the AV
of gamers, eSports, VR, rising                                                                  workstations, rising adoption
production value of games,                     needs unmet by conventional                                                                        computing stack by 2025
                                               approaches such as x86 CPUs                      of AR/VR across industries
gaming and prosumer laptops

           Gaming                                        Data Center                             Professional Visualization                                 Automotive
       51% of FY20 Rev                                  27% of FY20 Rev                                   11% of FY20 Rev                                   6% of FY20 Rev

     ASP = Average Selling Price. Gamers are defined as consumers who purchase our GPUs to play video games. 200M+ gamers on our platform as of March 2020. FY20 ending 1/26/2020.   6
STRONG, PROFITABLE GROWTH

         FY16                    FY20             Gaming    Data Center   ProViz    Auto   OEM/IP             Revenue    Gross Margin    Operating Margin

                                                                                                     12,000                                             80%
                                 5
     16                      6
                                                                               $11.7B
                        11                                                                 $10.9B    10,000                                             70%
6                                                                                                                                                63%
                                                                    $9.7B                                                       60%
                                                                                                                                         62%
                                                                                                                        59%
                                           51                                                         8,000     57%                                     60%
                   56
15
                                                           $6.9B
                        27                                                                            6,000                                             50%
     7                                          $5.0B
                                                                                                      4,000                     37%      38%            40%
                                                                                                                                                 34%
                             Gaming                                                                                     32%
     Gaming
     Data Center             Data Center                                                              2,000                                             30%
     ProViz                  ProViz                                                                             22%
     Auto                    Auto                                                                         0                                             20%
     OEM / IP                OEM / IP           FY16       FY17      FY18          FY19     FY20               FY16     FY17   FY18     FY19    FY20

            Business Mix (%)                               Broad-based Growth                                   Sustained Profitability
                                                                                                                 (showing non-GAAP margins)

                                                                                                    Refer to Appendix for reconciliation of Non-GAAP measures

                                                                                                                                                        7
WHY ACCELERATED COMPUTING?
                           Advancing Computing in the Post-Moore’s Law Era

The world’s demand for computing power              107
continues to grow exponentially, yet CPUs are
no longer keeping up as Moore’s Law has ended.
                                                                    GPU PERFORMANCE
NVIDIA pioneered GPU-accelerated computing          105
to solve this challenge.

Optimizing across the entire stack — from silicon                                     CPU PERFORMANCE
to software — allows NVIDIA to advance computing
in the post-Moore’s Law era for large and           103
important markets:

Gaming, Pro Viz, High Performance Computing
(HPC), AI, Cloud, Transportation, Healthcare,
Robotics, and the Internet of Things (IOT).
                                                      1980   1990        2000         2010          2020

                                                                                                        8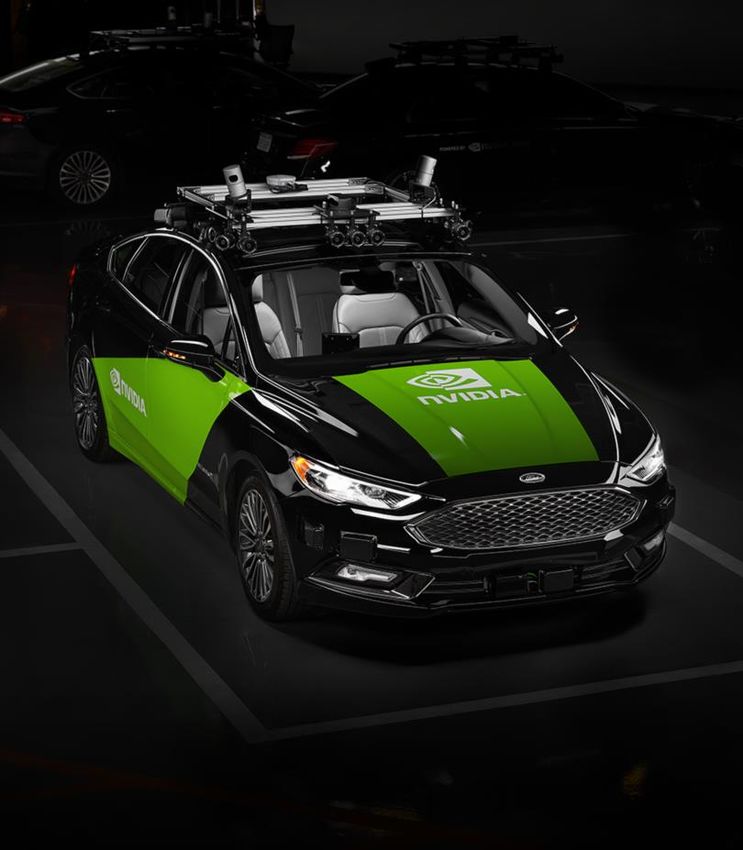
WORLD LEADER IN ACCELERATED COMPUTING
                             Our Four Market Platforms & Key Brands

        Gaming                  Data Center        Professional Visualization              Auto
GeForce GPUs for PC Gamers     Tesla for HPC/AI      Quadro for Workstations    DRIVE for Autonomous Vehicles

                                                                                                          9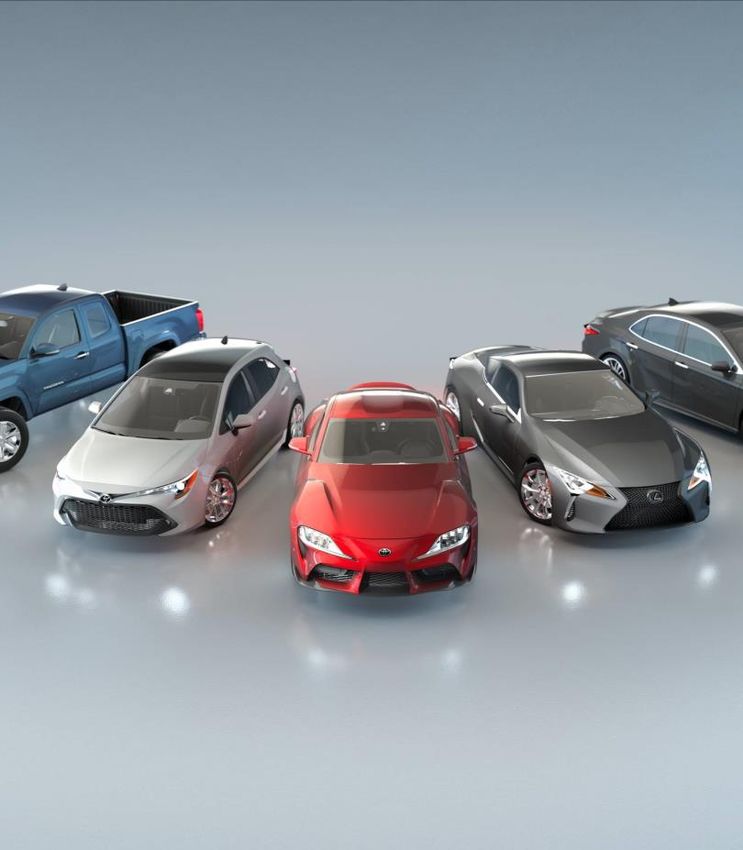
GAMING
GeForce - The World’s Largest Gaming Platform
$1,491
$6,246 56% Y/Y #1 in PC gaming with more
18%
CAGR $5,513 $5,518
Growth
than 3X the revenue of the
other major GPU vendor
$4,060
Expanding the market with
$2,818 gaming laptops and cloud
$954
gaming
Powering the Nintendo
Switch console
FY16 FY17 FY18 FY19 FY20 Q4FY19 Q4FY20
Revenue ($mm) Highlights 200M+ Gamers on GeForce
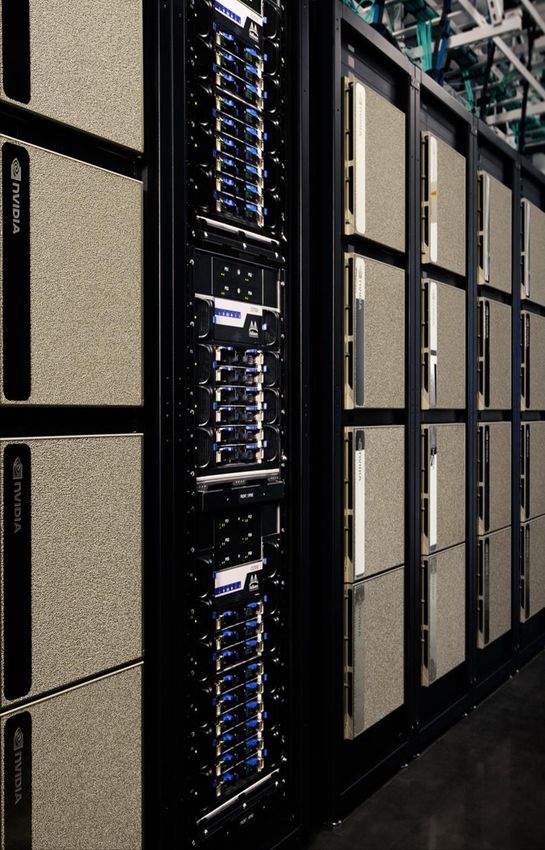
10DATA CENTER
High Performance Computing (HPC) and AI
NVIDIA Share of New Top
$968
43% Y/Y 2.0M 500 Systems
Growth
$2,932 $2,983
50%
41%
1.5M
$679 40% 34%
72%
CAGR $1,932
30% 24%
1M
20%
10% 6%
$830
500K
$339
0%
SC16 SC17 SC18 SC19
0
FY16 FY17 FY18 FY19 FY20 Q4FY19 Q4FY20 2005 2010 2015 2020 #1 and #2 Supercomputers Worldwide;
#1 in Europe; #1 in Japan
Revenue ($mm) Registered NVIDIA Developers Every Major Cloud Provider 90%+ Share of Accelerators
in Supercomputing
11PROFESSIONAL VISUALIZATION
Workstation Graphics
Accelerated AR/VR Data
$1,212 Rendering Science
13% CAGR
$1,130 Virtual
Simulation
and Sci Viz Workstations
$934 Foundry
$835
$750
Remington
FY16 FY17 FY18 FY19 FY20
Revenue ($mm) 40+ Applications 40M Designers and Creatives
Unlocking New Markets
12AUTO
Infotainment and Autonomous Vehicles
80 76
$700 TOYOTA MERCEDES-BENZ
22% CAGR 70
$641
$558 60
$487 50
42
VOLVO KOMATSU
40
$320 33
30 26 24
20 15
DIDI ZF
10 7
0
Robo
FY16 FY17 FY18 FY19 FY20 Cars Trucks Tier 1s taxis Mapping Sensors Software
XPENG SINGULATO
Revenue ($mm) NVIDIA DRIVE Partners Strong Partnership / Ecosystem
13LARGE AND DIVERSE CUSTOMER BASE
Reaching Hundreds of Millions of End Users Through Hundreds of Customers
Reaching 200M+ PC gamers Cloud
40M Designers/Creatives
Every Major PC OEM/ODM HPC
ORNL LLNL Piz
ABCI
Summit Sierra Daint
Every Major Graphics Card Vertical Industry
Manufacturer
20M Enterprise Users
Gaming Data Center Pro Visualization Auto
Largest Customer 11% of Total Revenue Over Past 3 Fiscal Years
14FINANCIALS
15REVENUE BY MARKET PLATFORMS
Gaming Data Center
$2,932 $2,983
$6,246
$5,513 $5,518
$mm
$mm
$4,060 $1,932
$2,818
$830
$339
FY16
FY2016 FY17
FY2017 FY18
FY2018 FY19
FY2019 FY20
FY2020 FY16
FY2016 FY17
FY2017 FY18
FY2018 FY19
FY2019 FY20
FY2020
Pro Visualization Auto
$1,212 $700
$1,130
$641
$934 $558
$835 $487
$750
$mm
$mm
$320
FY2016
FY16 FY2017
FY17 FY2018
FY18 FY2019
FY19 FY2020
FY20 FY16
FY2016
FY2016 FY17
FY2017 FY18
FY2018 FY19
FY2019 FY20
FY2020
16EBITDA (NON-GAAP)
$4,662
$4,110
$3,803
$mm
$2,392
$1,305
FY2016
FY16 FY2017
FY17 FY2018
FY18 FY2019
FY19 FY2020
FY20
Refer to Appendix for reconciliation of Non-GAAP measures
17OPERATING CASH FLOW
$4,761
$3,743
$3,502
$mm
$1,672
$1,175
FY2016
FY16 FY2017
FY17 FY2018
FY18 FY2019
FY19 FY2020
FY20
18CASH BALANCE
$10,897
$7,422
$6,798 $7,108
$mm
$5,037
FY2016
FY16 FY2017
FY17 FY2018
FY18 FY2019
FY19 FY2020
FY20
As of fiscal year end.
19CONSERVATIVE FINANCIAL POLICY
FY20
1.4
Commitment to maintain our
Revenue $10.92B
historically modest leverage, 1.2
Adjusted EBITDA $4.11B consistent with investment grade
1
credit ratings
Free Cash Flow $4.27B 0.8
Disciplined capital return policy
Cash & Cash Equivalents and 0.6
$10.90B
Marketable Securities
Solid balance sheet with 0.4
Principal Value of Debt $2.00B substantial liquidity, and positive
0.2
net cash position
Net Cash $8.90B 0
Disciplined approach to M&A FY16 FY17 FY18 FY19 FY20
Principal Value of Debt / Adjusted EBITDA 0.5x
Key Credit Metrics Financial Policy Highlights Historical Debt / Adjusted EBITDA
Source: SEC filings and public disclosures
1 Adjusted EBITDA and Free Cash Flow are Non-GAAP measures. Refer to Appendix for reconciliation of
Non-GAAP measures
2 Net Cash is defined as Cash & Cash Equivalents and Marketable Securities less principal value of debt
20RECONCILIATION OF GAAP VS
NON-GAAP FINANCIAL MEASURES
21RECONCILIATION OF NON-GAAP TO GAAP FINANCIAL
MEASURES
AMORTIZATION OF
NON-GAAP
GAAP DEPRECIATION ACQUISITION-
($ IN MILLIONS) OPERATING INCOME ADJUSTED EBITDA
& AMORTIZATION RELATED
(A)
INTANGIBLES
FY 2016 $1,125 197 (17) $1,305
FY 2017 $2,221 187 (16) $2,392
FY 2018 $3,617 199 (13) $3,803
FY 2019 $4,407 262 (7) $4,662
FY 2020 $3,735 381 (6) $4,110
A. Refer to Appendix herein for reconciliation of Non-GAAP operating income to GAAP operating income
22RECONCILIATION OF NON-GAAP TO GAAP FINANCIAL
MEASURES (CONTD.)
ACQUISITION-
NON-GAAP STOCK-BASED PRODUCT GAAP
($ IN RELATED AND OTHER
OPERATING COMPENSATIO WARRANTY OPERATING
MILLIONS) OTHER COSTS (D)
INCOME N (A) (B) INCOME
(C)
FY 2016 $1,125 (205) (20) (22) (131) $747
FY 2017 $2,221 (248) — (16) (23) $1,934
FY 2018 $3,617 (391) — (13) (3) $3,210
FY 2019 $4,407 (557) — (2) (44) $3,804
FY 2020 $3,735 (844) — (30) (15) $2,846
A. Stock-based compensation charge was allocated to cost of goods sold, research and development expense, and sales, general and administrative expense.
B. Consists of warranty charge associated with a product recall.
C. Consists of amortization of acquisition-related intangible assets, transaction costs, compensation charges, other credits related to acquisitions, and other costs.
D. Comprises of legal settlement costs, contributions, and restructuring and other charges.
23RECONCILIATION OF NON-GAAP TO GAAP FINANCIAL
MEASURES (CONTD.)
ACQUISITION-
STOCK-BASED
RELATED ITEMS OTHER TAX IMPACT OF
($ IN MILLIONS) NON-GAAP COMPENSATION GAAP
AND OTHER (C) ADJUSTMENTS
(A)
COSTS (B)
FY 2020
Revenue $10,918 — — — — $10,918
Gross profit $6,821 (39) — (14) — $6,768
Gross margin 62.5% (0.4) — (0.1) — 62.0%
Operating expense $3,086 805 30 1 — $3,922
Operating income $3,735 (844) (30) (15) — $2,846
Operating margin 34.2% (7.7) (0.3) (0.1) — 26.1%
Net income $3,580 (844) (30) (16) 106 $2,796
A. Stock-based compensation charge was allocated to cost of goods sold, research and development expense, and sales, general and administrative expense.
B. Consists of amortization of acquisition-related intangible assets, transaction costs, compensation charges, other credits related to acquisitions, and other costs.
C. Other comprises of legal settlements, losses from non-affiliated investments, and interest expense related to amortization of debt discount
24RECONCILIATION OF NON-GAAP TO GAAP FINANCIAL
MEASURES (CONTD.)
STOCK-BASED
NON-GAAP GROSS PRODUCT OTHER GAAP GROSS
COMPENSATION
MARGIN WARRANTY (B) (C) MARGIN
(A)
FY 2016 56.8% (0.3) (0.4) — 56.1%
FY 2017 59.2% (0.2) — (0.2) 58.8%
FY 2018 60.2% (0.3) — — 59.9%
FY 2019 61.7% (0.2) — (0.3) 61.2%
FY 2020 62.5% (0.4) — (0.1) 62.0%
A. Stock-based compensation charge was allocated to cost of goods sold.
B. Consists of warranty charge associated with a product recall.
C. Consists of legal settlement costs.
25RECONCILIATION OF NON-GAAP TO GAAP FINANCIAL
MEASURES (CONTD.)
ACQUISITION-
NON-GAAP STOCK-BASED PRODUCT GAAP
RELATED AND OTHER
OPERATING COMPENSATION WARRANTY OPERATING
OTHER COSTS (D)
MARGIN (A) (B) MARGIN
(C)
FY 2016 22.5% (4.2) (0.4) (0.4) (2.6) 14.9%
FY 2017 32.1% (3.6) — (0.2) (0.3) 28.0%
FY 2018 37.2% (4.0) — (0.2) — 33.0%
FY 2019 37.6% (4.7) — — (0.4) 32.5%
FY 2020 34.2% (7.7) — (0.3) (0.1) 26.1%
A. Stock-based compensation charge was allocated to cost of goods sold, research and development expense, and sales, general and administrative expense.
B. Consists of warranty charge associated with a product recall.
C. Consists of amortization of acquisition-related intangible assets, transaction costs, compensation charges, other credits related to acquisitions, and other costs.
D. Comprises of legal settlement costs, contributions, and restructuring and other charges.
26RECONCILIATION OF NON-GAAP TO GAAP FINANCIAL
MEASURES (CONTD.)
PURCHASES OF PROPERTY AND
NET CASH PROVIDED BY
($ IN MILLIONS) EQUIPMENT AND INTANGIBLE FREE CASH FLOW
OPERATING ACTIVITIES
ASSETS
FY 2020 $4,761 (489) $4,272
27You can also read