2nd QUARTER 2019 EARNINGS WEBCAST - AUGUST 9TH, 2019 - YPF

Page created by Lynn Wang
 
CONTINUE READING
2nd QUARTER 2019 EARNINGS WEBCAST - AUGUST 9TH, 2019 - YPF
2nd QUARTER 2019
EARNINGS WEBCAST

AUGUST 9TH, 2019
2nd QUARTER 2019 EARNINGS WEBCAST - AUGUST 9TH, 2019 - YPF
IMPORTANT NOTICE

Safe harbor statement under the US Private Securities Litigation Reform Act of 1995.
This document contains statements that YPF believes constitute forward-looking statements within the meaning of the US Private Securities Litigation Reform Act of 1995.
These forward-looking statements may include statements regarding the intent, belief, plans, current expectations or objectives of YPF and its management, including statements with respect to YPF’s
future financial condition, financial, operating, reserve replacement and other ratios, results of operations, business strategy, geographic concentration, business concentration, production and
marketed volumes and reserves, as well as YPF’s plans, expectations or objectives with respect to future capital expenditures, investments, expansion and other projects, exploration activities,
ownership interests, divestments, cost savings and dividend payout policies. These forward-looking statements may also include assumptions regarding future economic and other conditions, such as
future crude oil and other prices, refining and marketing margins and exchange rates. These statements are not guarantees of future performance, prices, margins, exchange rates or other events and
are subject to material risks, uncertainties, changes and other factors which may be beyond YPF’s control or may be difficult to predict.
YPF’s actual future financial condition, financial, operating, reserve replacement and other ratios, results of operations, business strategy, geographic concentration, business concentration, production
and marketed volumes, reserves, capital expenditures, investments, expansion and other projects, exploration activities, ownership interests, divestments, cost savings and dividend payout policies,
as well as actual future economic and other conditions, such as future crude oil and other prices, refining margins and exchange rates, could differ materially from those expressed or implied in any
such forward-looking statements. Important factors that could cause such differences include, but are not limited to, oil, gas and other price fluctuations, supply and demand levels, currency
fluctuations, exploration, drilling and production results, changes in reserves estimates, success in partnering with third parties, loss of market share, industry competition, environmental risks, physical
risks, the risks of doing business in developing countries, legislative, tax, legal and regulatory developments, economic and financial market conditions in various countries and regions, political risks,
wars and acts of terrorism, natural disasters, project delays or advancements and lack of approvals, as well as those factors described in the filings made by YPF and its affiliates with the Securities
and Exchange Commission, in particular, those described in “Item 3. Key Information—Risk Factors” and “Item 5. Operating and Financial Review and Prospects” in YPF’s Annual Report on Form 20-
F for the fiscal year ended December 31, 2018 filed with the US Securities and Exchange Commission. In light of the foregoing, the forward-looking statements included in this document may not
occur.
Except as required by law, YPF does not undertake to publicly update or revise these forward-looking statements even if experience or future changes make it clear that the projected performance,
conditions or events expressed or implied therein will not be realized.
These materials do not constitute an offer to sell or the solicitation of any offer to buy any securities of YPF S.A. in any jurisdiction. Securities may not be offered or sold in the United States absent
registration with the U.S. Securities and Exchange Commission or an exemption from such registration.
Cautionary Note to U.S. Investors — The United States Securities and Exchange Commission permits oil and gas companies, in their filings with the SEC, to separately disclose proved, probable and
possible reserves that a company has determined in accordance with the SEC rules. We may use certain terms in this presentation, such as resources, that the SEC’s guidelines strictly prohibit us
from including in filings with the SEC. U.S. Investors are urged to consider closely the disclosure in our Form 20-F, File No. 1-12102 available on the SEC website www.sec.gov.
Our estimates of EURs, included in our Development Costs, are by their nature more speculative than estimates of proved, probable and possible reserves and accordingly are subject to substantially
greater risk of being actually realized, particularly in areas or zones where there has been limited history. Actual locations drilled and quantities that may be ultimately recovered from our concessions
will differ substantially. Ultimate recoveries will be dependent upon numerous factors including actual encountered geological conditions and the impact of future oil and gas pricing.
Unless otherwise indicated the calculation of the main financial figures in U.S. dollars for Q2 2018 is derived from the calculation of the consolidated financial results expressed in Argentine pesos
using the average exchange rate for each period. For Q1 and Q2 of 2019, the calculation of the main financial figures in U.S. dollars is derived from the sum of: (1) YPF S.A. individual financial results
expressed in Argentine pesos divided by the average exchange rate of the period and (2) the financial results of YPF S.A.’s subsidiaries expressed in Argentine pesos divided by the exchange rate at
the end of period.
                                                                                                                                                                                                                 2
2nd QUARTER 2019 EARNINGS WEBCAST - AUGUST 9TH, 2019 - YPF
SAFETY AND SUSTAINABILITY ARE EMBEDDED IN OUR DAILY ACTIVITY AND CORPORATE STRATEGY

TOTAL IFR
# of people injured for each million hours worked
2009 – 1H 2019

                            1.89
                                                                               ESG REPORTING

                                                                               • 2018 Sustainability Report available by end of August
                                                                               • Continue tracking ESG score under Dow Jones
1.27                                                                             Sustainability Index
                                    1.05
                1.05
       0.82                                0.91
              0.72                                0.74                         RENEWABLES AND NEW ENERGY SOLUTIONS
                                                         0.60          0.57    • Renewables energy consumption representing 17%
                                                                0.51
                                                                                 of total energy consumed
                                                                               • Research in Y-TEC
                                                                               • Launched YPF ventures to focus on new energy and mobility
2009   2010   2011   2012   2013   2014   2015    2016   2017   2018 1H 2019   • First peer to invest in micromobility

                                                                                                                                         3
2nd QUARTER 2019 EARNINGS WEBCAST - AUGUST 9TH, 2019 - YPF
2nd QUARTER 2019
            Financial
            highlights                                                                                Revenues of Ps 160.3 billion (+72.3%)

                                                                                                      Adjusted EBITDA(1) of Ps 41.6 billion (+67.8%)

                                                                                                      Operating cash flow of Ps 40.7 billion (+47.6%)

                                                                                                      CAPEX(2) of Ps 48.8 billion (+152.4%)

                                                                                                      Hydrocarbon production down 5.3%

                                                                                                      Net shale oil production up 57.5%
(1)   See description of Adjusted EBITDA in footnote (2) on page 5                                                                                      4
(2)   Q2 2019 capex includes Ps 8.4 BN from Ensenada de Barragán and Aguada del Chañar acquisitions
2nd QUARTER 2019 EARNINGS WEBCAST - AUGUST 9TH, 2019 - YPF
REVENUES DECLINED 7% IN USD MAINLY DUE TO LOWER NATURAL GAS
      AND DOWNSTREAM SALES WHILE MARGINS REMAINED FAIRLY STABLE

      REVENUES (1)                                                         ADJUSTED EBITDA (1) (2)                                                       CAPEX          (1) (3)
      (In Millions of USD)                                                 (In Millions of USD)                                                          (In Millions of USD)

                        -7.3%                                                                   -10.2%                                                                            +35.2%

          3,963                                                                                                                                                                                  1,114
                                      3,672                                          1,056
                                                                                                                                                                                                    199
                                                                                                                  948
                                                                                                                                                                      824
                                                                                                                                                                                                    915
                                                                                                                                                                                  +11.0%

         Q2 2018                     Q2 2019                                       Q2 2018                     Q2 2019                                             Q2 2018                       Q2 2019

(1)    YPF financial statement based on IFRS converted to USD using average exchange rate of Ps 43.86 and Ps 23.48 per U.S $1.00 for Q2 2019 and Q2 2018, respectively.
(2)    Adjusted EBITDA = Operating income + Depreciation and impairment of property, plant and equipment + Depreciation of assets for own use + Amortization of intangible assets + unproductive exploratory drillings.
       Excludes IFRS 16 effects.                                                                                                                                                                                          5
(3)    Q2 2019 capex of USD 1,114mn includes USD 199mn from M&A activities
2nd QUARTER 2019 EARNINGS WEBCAST - AUGUST 9TH, 2019 - YPF
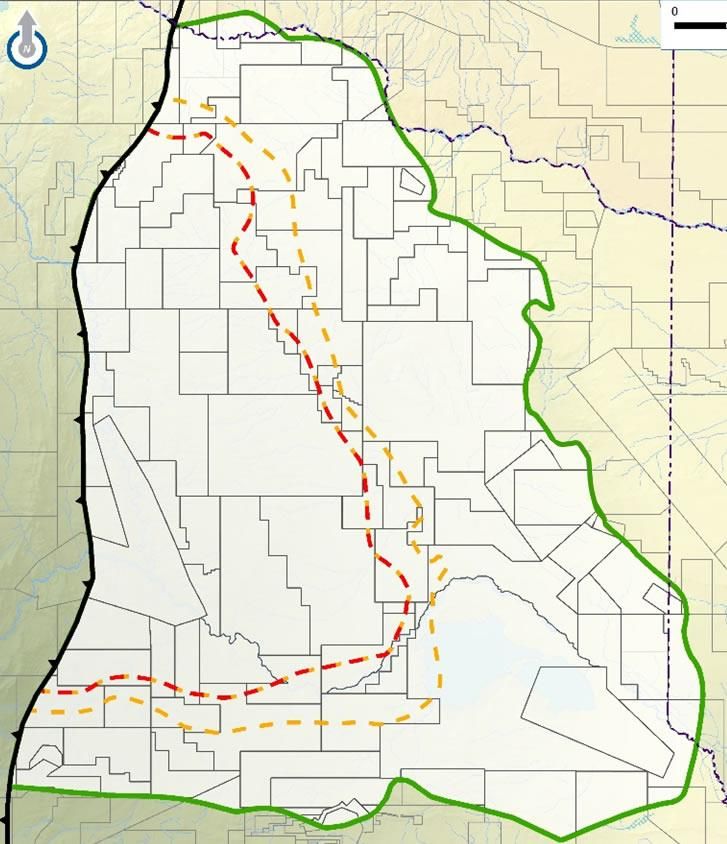
ADJ. EBITDA INCREASED IN Q2 2019 MAINLY DRIVEN BY THE UPSTREAM BUSINESS

      ADJUSTED EBITDA
      (In Billions of PS)                                                                                                                  1.1                  41.6
                                                                                                                       2.7
                                                                                                 3.2
                                                                           9.8

                                23.1                  24.8

                                                                                                                                                                                                           7.2

            1.7                                                                                                                                                                      -34.4

         Operating            Non-cash     Adj. EBITDA Q2               Upstream            Downstream           Corporate &              G&E            Adj. EBITDA Q2            Non-cash             Operating
        Income Q2             expenses (1)       2018                                                            Eliminations                                  2019                expenses     (1)
                                                                                                                                                                                                       Income Q2
           2018                                                                                                                                                                                           2019

(1)     Includes depreciation and impairment of property, plant and equipment, depreciation of assets for own use and amortization of intangible assets and unproductive exploratory drillings. Excludes IFRS 16 effects.
                                                                                                                                                                                                                            6
2nd QUARTER 2019 EARNINGS WEBCAST - AUGUST 9TH, 2019 - YPF
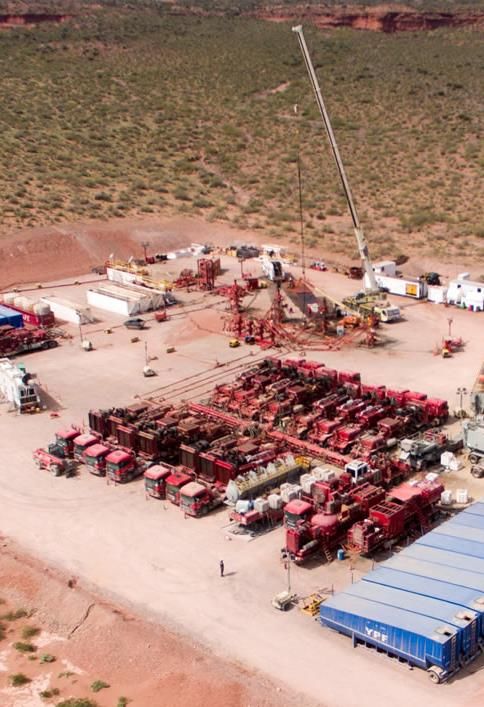
POSITIVE FREE CASH FLOW BEFORE ACQUISITIONS

   CONSOLIDATED STATEMENT OF ADJUSTED CASH FLOW (1)                                                  Q2 2019 FREE CASH FLOW (2)
   (In Billions of PS)                                                                               (In Billions of PS)

                                     18.4
                    40.7                                                                                    40.7

   68.2                                              -48.5                             67.2
                                                                -8.4       -3.2

                                                                                                                                1.0
                                                                                                                    -39.7
                                                                                                                                          -4.3

    Cash &        Cash flow      Net financing       Capex      Interest   Others      Cash &
                                                                                                                                                    -4.1      -0.4      -7.8
                                                                                                            CFO     Capex FCF pre         Ens.    A. del Others          FCF
 equivalents at     from                                       payments             equivalents at
the begining of   operations                                                        the end of Q2                          acq.           Bar.    Chañar
   Q2 2019                                                                              2019

  (1)   Q2 2019 capex includes Ps 8.8 BN from M&A activities                                         ( 2)    Free Cash Flow = Cash Flow from Operations minus CAPEX – M&A.     7
2nd QUARTER 2019 EARNINGS WEBCAST - AUGUST 9TH, 2019 - YPF
BACK TO GLOBAL MARKETS; SOLID CASH POSITION

      PRINCIPAL DEBT AMORTIZATION SCHEDULE (1) (2)                                                                         USD denominated debt
                                                                                                                           Peso denominated debt
                                                                                                                                                    DETAILS
      (In Millions of USD)
                                                                                                                                          2,265     92% denominated in USD
                                                                                                                                                    and 8% in Argentine Pesos

      1,587                                                                                                                                         Average interest rates
                                                                                                                          1,491                     of 7.54% in USD
                                                       1,450
                                                                                                                                                    and 44.76% in Pesos
                                       1,082
                       961
                                                                                                                                                    Average life of 6.14 years
                                                                         747
                                                                                                          625
                                                                                          490                                                       Net Debt /LTM Adj.
                                                                                                                                                    EBITDA 1.9x (3)(4)

    Cash &             2019             2020            2021             2022            2023             2024             2025           2026+
  Equivalents(3)

(1)    As of June 30, 2019. Excludes IFRS 16 effects.
(2)    Converted to USD using the June 30, 2019 exchange rate of Ps 42.36 to U.S $1.00.
(3)    Includes cash & equivalents, including Argentine sovereign bonds BONAR 2020 and BONAR 2021.
(4)    Net debt is calculated as total debt less cash & equivalents and financial derivatives. Net debt to LTM Adj. EBITDA calculated in USD. Net
       debt at period end exchange rate of Ps 42.36 to U.S $1.00 and LTM Adj. EBITDA calculated as sum of quarters.
                                                                                                                                                                                 8
LOWER NATURAL GAS DEMAND AND ARGENTINA’S BLACKOUT IMPACTED TOTAL PRODUCTION

TOTAL PRODUCTION                                   PRODUCTION BREAKDOWN
(KBOE/D)                             NGL           (KBOE/D)                                   Conventionals
                                                                                              Shale + Tight
                                     Natural Gas
                   -5.3%             Crude Oil
                                                              26.7
           544.6                                     544.6
                   -5.3%    515.7                                                                 515.7
                                                                          -36.5
                                                                                      -19.1
                                                      28%
                                                                                                  31%
                   -8.8%                   +6.0%
                                            QoQ

                                                      72%
                                                                                                  69%
                   -1.0%

       Q2 2018             Q2 2019                  Q2 2018   Shale   Conventionals   Tight      Q2 2019

                                                                                                              9
CONTINUE INCREASING NET SHALE PRODUCTION AND REDUCING COSTS

    NET SHALE O&G PRODUCTION(1)                                                   NGL
                                                                                                         SHALE OIL DEVELOPMENT COST - LOMA CAMPANA(2)
    (KBOE/D)                                                                                             (USD/BOE)
                                                                                  Natural Gas
                                    +47.9%                   82.4                 Crude Oil                    18.0
                                                                                                                                     15.0
                                                                                                                                                          11.0
                   55.7                                                                                                                                                          ~9
                                                                                  +15.8%
                                                                                   QoQ

                                                                                                               2016                  2017                  2018               H1 2019
                                     +57.5%

                                                                                                         SHALE OIL OPEX COST - LOMA CAMPANA
                                                                                                         (USD/BOE)
                  Q2 2018                                 Q2 2019                                               12.0
                                                                                                                                      9.1
                       NEW WELLS                    ACTIVE
                       IN Q2 2019                   RIGS
                                                                                                                                                          6.0                 ~5.5
                       39                          19
(1) Total production (Loma Campana + El Orejano + Bandurria Sur + La Amarga Chica + Bajada de
    Añelo + Aguada Pichana Este + Rincón del Mangrullo + Loma La Lata – Sierra Barrosa + Aguada
    de la Arena + Lindero Atravesado + San Roque + La Ribera Blocks I & II + La Calera + Pampa                   2016                2017                 2018               H1 2019
    de las Yeguas Block I + Al Norte de la Dorsal + Bajo del Toro + Chihuido de la Sierra Negra
    + Filo Morado + Las Manadas).                                                                 ( 2)    Loma Campana development costs have been recalculated based on new expected EUR   10
PBN
                                   CLUSTER OIL N°2                                             UNLOCKING VALUE OF
                               ChSN                                                            SHALE OIL ACREAGE
                                           PH
           FMo

                                                  N
                                                                                               CLUSTER OIL N° 1
                                              BDT                                              DEVELOPMENT                                                                       EXPANSION
            LdM                                                                                Loma Campana, La Amarga                                                           Aguada del Chañar
SDH
                                                                                               Chica & Bandurria Sur                                                             acquisition
            CLMi
                                                                                                                                                                                                 BdT Curve Type 2018
                                                    LaMa                                                                                                             1.800                       Qo BdT.x-6(h)
                                                                                               CLUSTER OIL N° 2

                                                                                                                     Normalized Oil Production (bbl/d per 2,000 m)
                                                                                                                                                                                                 Qo BdT.x-7(h)
                                                                                                                                                                     1.600
      CA                                              San
                                                      Roque                                                                                                          1.400
                             EOR
                                                                                               PILOTS
                                         PY
                                         II                                                    • Bajo del Toro                                                       1.200

                                                                        LACh
                                                                        LACh
                                                                               AdCh            • Narambuena                                                          1.000
                                     CLUSTER OIL N°1
                                                                                               • Chihuido de                                                          800
                                              BA
             AdC                         ADLA
                                              ñ               BS                                 la Sierra Negra                                                      600

                                                                                                                                                                      400
                               APE
                                                                LC
                                                  LCa                                          EXPLORATION                                                            200
                       APO
                                                LRi I         LLL Sur                          Las Manadas                                                              0
                                                                                                                                                                             0            2               4   Months

                                                              Embalse
                             RDM         LRi II
                                                        LLL
                                                                                                                     EUR 933 kboe                                                             IP60 1,800 boe/d
                                                                              Embalse
                                                        O
           Cha                       MBE
                                                                                  Lindero
                   LTa
                                                                   LLL-SB         Atravesado   CLUSTER OIL N° 3
                         AVi
                                                                                               EXPLORATION
                                   AND                                      CLUSTER OIL N°3
                 CBN                                                                           Sierra Barrosa-Loma La Lata, Loma La Lata Oeste &
                                                                                                                                                                                                                       11
                                                                                               Al Norte de la Dorsal
CRUDE PROCESSED VOLUMES AFFECTED BY ARGENTINA’S BLACKOUT;
DECREASE IN DOMESTIC SALES WERE PARTIALLY OFFSET BY HIGHER EXPORTS

CRUDE PROCESSED                                   SALES OF REFINED PRODUCTS
(KBBL/D)                                          (KM 3)

                     -4.4%                                           -3.5%
                                                           4,440
                                                                             4,285
           275.0
                             262.8

                                                                                       Exports
                                                                     -2.1%             Others
                                                                                       GLP
                                                                                       Fuel Oil
                                                                                       JP1
                                                                                       Gasoline
                                                                     -2.1%             Diesel

           Q2 2018           Q2 2019                       Q2 2018           Q2 2019
                                                                                                  12
FUEL DEMAND DROPPED DURING Q2 2019 DUE TO MARKET CONTRACTION

   MONTHLY GASOLINE SALES                                                                        MONTHLY DIESEL SALES
   (KM3)                                                                                         (KM3)

   500                          -2.1%                                                            750                   -2.1%
                                                                                          2018
                                 YoY                                                                                    YoY
   480
                                                                                          2017   700                                                            2018
   460
                                                                                                 650                                                            2017
   440                                                                                                                           2019
                                                                                                 600
   420
                                                  2019
   400                                                                                           550

   380                                                                                           500
           Jan   Feb Mar       Apr May Jun          Jul    Aug Sep      Oct    Nov Dec                 Jan   Feb Mar   Apr May Jun   Jul   Aug Sep   Oct   Nov Dec

                                     Q2 2017              Q2 2018          Q2 2019                                           Q2 2017        Q2 2018        Q2 2019
    Gasoline                                                                                     Diesel
    Market Share (1)                  55.3%               55.4%               56.4%              Market Share (1)              57.0%         59.0%          56.9%

(1) YPF volumes exclude bunker sales to the foreign market and sales to other companies                                                                                13
LOWER DOWNSTREAM MARGINS; EXPECT MARGINS RECOVERY IN 2H19

   DOWNSTREAM ADJUSTED EBITDA(1)                                                                       F.O.B. REFINERY/TERMINAL PRICE (2)
   Excluding inventory revaluation                                                                     (USD/BBL)
                                                                                                                                                         Gasoline       Diesel
   (USD per refined barrel)
                                                                                                          96                                96
                                                                                                                              88                             93          92
                                              16.5               16.6
                                                                                                          92                               92
                                                                                                                          86                                 86          85

                                                                                                        Q2 2018         Q3 2018          Q4 2018          Q1 2019      Q2 2019

         7.3                                                                        7.2

                            4.7                                                                        CRUDE OIL PRICES
                                                                                                       (USD/BBL)

                                                                                                            75                  76
                                                                                                                                              68                           68
                                                                                                                          66                                   64
                                                                                                          67
                                                                                                                                                    62                           62
       Q2 2018           Q3 2018            Q4 2018            Q1 2019            Q2 2019                                                                    55
                                                                                                            64                  65                                         60
                                                                                                                                                60            53
                                                                                                                   Medanito             Escalante             Brent
(1) Amounts in Argentine Pesos converted to USD using the applicable FX rate on the date in which
    revenues and expenses were recognized. Please note that these figures may differ from the EBITDA
    expressed in USD that is disclosed in table 5.5 of YPF’s Quarterly Consolidated Results report.       Q2 2018             Q3 2018      Q4 2018           Q1 2019    Q2 2019
(2) Net of commissions, deductions, freights, turnover tax and other taxes.
                                                                                                                                                                                      14
GRADUAL ADJUSTMENTS IN FUEL PRICES TO BRIDGE GAP WITH IMPORT PARITY

FUELS BLENDED PRICE VS IMPORT PARITY(1)
(% VARIATION)

  Jan-18 Feb-18 Mar-18 Apr-18 May-18 Jun-18 Jul-18 Aug-18 Sep-18 Oct-18 Nov-18 Dec-18 Jan-19 Feb-19 Mar-19 Apr-19 May-19 Jun-19 Jul-19 *

                                                                                     Fuels Blended Price                      Import Parity

(1)   Import parity includes international reference price for heating oil, RBOB and biofuels, each of them weighted by sales volumes of our regular and premium diesel and gasoline. Fuels blended prices
      and Import Parity prices based on monthly average prices. (*) July 2019: preliminary data as of July 30th 2019. January 2018 = base 0.
                                                                                                                                                                                                             15
SUMMARY   Maintaining safety and sustainability efforts

          Increasing focus on shale oil developments
          and preparing new wave of developments

          Shale oil production offsetting conventional oil decline

          Activating levers to generate natural gas demand

          Adj. EBITDA in USD decreased due to lower natural gas
          revenues and lower sales in downstream

          Return to Global Debt Markets maintaining
          a strong cash position

          Reaffirming our 2019 Guidance

                                                                     16
2nd Quarter Earnings Webcast

QUESTIONS
AND ANSWERS

                               17
You can also read