2021 Canadian Nonprofit Sector Salary & Benefits Study Highlights Webinar - January 28, 2021
←
→
Page content transcription
If your browser does not render page correctly, please read the page content below

2021 Canadian Nonprofit
Sector Salary & Benefits Study

Highlights Webinar

January 28, 2021
Today’s Agenda

    About The Portage Group

    Study Overview

    Who Participated?

    Study Highlights

    How to Use the Compensation Benchmarks

    Making the Case in 2021!

    Q&A

                                 ©2021 The Portage Group Inc. & CharityVillage
About The Portage Group
■ Full-service management consulting company focused on the not-for-profit
  sector.

■ Core Services:

■Extensive experience conducting compensation studies.

                              ©2021 The Portage Group Inc. & CharityVillage
About the Presenters
Geoffrey Thacker, Executive Partner                                           Jack Shand, Executive Partner
■ Senior consulting roles with                                               ■ Founder/senior consulting roles
  Association Resource Centre                                                  with Association Resource
  and co-founder of The Portage                                                Centre, Leader Quest and, since
  Group                                                                        2015, The Portage Group
■ Leads TPG’s research practice.
                                                                             ■ Practice focus includes
■ Over 25 years experience                                                     executive search & leadership
  leading, designing and                                                       consulting (e.g., strategy) for
  conducting market research –                                                 many types of NFPs –
  the last 18 years have been                                                  associations, charities,
  focused on associations and                                                  regulators, unions, etc.
  nonprofits
■ Has lead over 30 compensation studies in the                               ■ Fellow of the management consulting profession
  nonprofit sector including all six of CharityVillage’s                       (FCMC)
  studies                                                                    ■ CEO of three national organizations in the NFP sector
                                                                               prior to consulting
■ Served in a management role in
  PricewaterhouseCoopers’ Measurement & Market                               ■ Volunteer roles have included management
  Research practice                                                            education (university committee chair), health
                                                                               charity (national fundraising chair), to community
                                                                               level (board director)

                                                 ©2021 The Portage Group Inc. & CharityVillage
Study Overview
■ 892 not-for-profit organizations participated in November 2020

■ Total of 3,566 staff position profiles in six levels:
 • 595 - Level 1: Chief Executive
 • 236 - Level 2: Senior Executive
 • 466 - Level 3: Senior Management
 • 669 - Level 4: Management/Supervisory Staff
 • 1,076 - Level 5: Functional & Program Staff
 • 524 - Level 6: Support Staff

■ Total of 10,726 individual staff represented

■ Study covers both compensation and benefits

                                   ©2021 The Portage Group Inc. & CharityVillage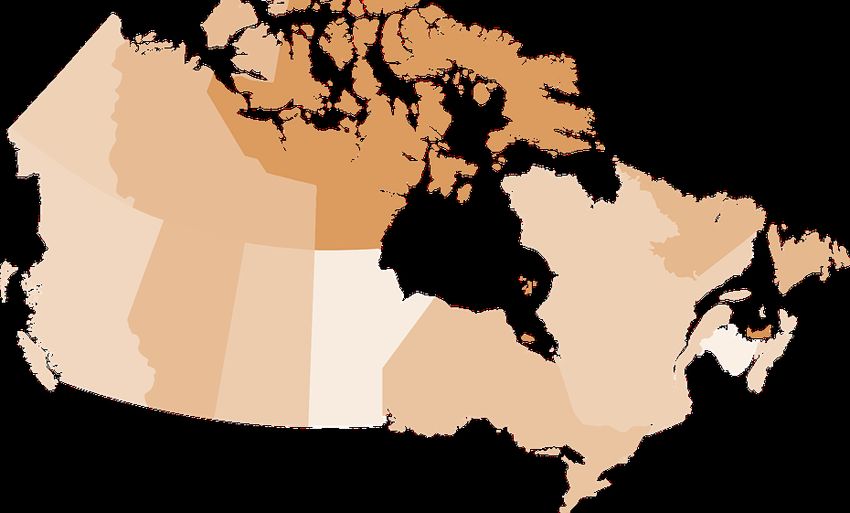
Study Limitations
■ Compensation figures are as of December 2020.

■ Results are based on survey responses and are only as accurate as the data
  provided by survey participants.

■ Survey was not random. Accordingly, it may or may not be an accurate
  representation of the total of the nonprofit sector in Canada.

■ Interpret smaller segment data with caution due to small sample sizes.

                               ©2021 The Portage Group Inc. & CharityVillage
Who Participated?
                                                                                                               Jurisdiction
                                                                                                                                       Regional
                                                                                                                                         19%
                                                                                                                                       Provincial
                                         Quebec                                                                                           18%
  BC
  24%
                                          3%                                        Local/
                                                          Atlantic
                                                            3%                     municipal                                            Multi-province
                    Prairies
                      5%                                                             40%                                                      2%
        Alberta
         9%                    Ontario                                                                                                 National
                                56%                                                                                                       18%
                                                                                                                                       International
                                                                                                                                            3%

                  Organization Type                                            Number of Staff                                Budget
                                                                              24%
    Other                                                                              19% 19%                                31%
                                                                                                                     17%
  Nonprofit,
    31%                                                                                                 11% 10%                                     18%   19%
                                                                                                                                       16%   16%

                                                  Registere
                                                  d Charity,
                                                     69%

                                                               ©2021 The Portage Group Inc. & CharityVillage
Study Highlights
©2021 The Portage Group Inc. & CharityVillageCash Compensation by Level
$120,000 $99,349 $101,122 $81,290 $62,947 $45,765 $43,344
$1,576 $507
$100,000
$461
$80,000
$161
$60,000
$97,773 $100,615 $31 $27
$40,000 $80,829
$62,787
$20,000 $45,734 $43,317
$0
Level 1: Level 2: Level 3: Level 4: Level 5: Level 6: Support
Chief Executives Senior Senior Management/ Functional & Staff
Executives Management Supervisory Program Staff
Staff
Base compensation Bonus or additional compensation
©2021 The Portage Group Inc. & CharityVillageBonus Compensation by Level
Percent of Staff Who Received Bonus Compensation
30%
20%
15%
11%
9%
10% 6%
2% 2%
0%
Level 1: Level 2: Level 3: Level 4: Level 5: Level 6: Support
Chief Executives Senior Executives Senior Management/ Functional & Staff
Management Supervisory Staff Program Staff
Average Amount of Bonus Cash Compensation (% of base compensation)
Level 1 Level 2 Level 3 Level 4 Level 5 Level 6
Among all staff 1.2% 0.5% 0.5% 0.3% 0.1% 0.1%
Among those who receive bonus pay 8.3% 6.1% 4.9% 4.4% 3.0% 3.8%
©2021 The Portage Group Inc. & CharityVillageChange in Cash Compensation by Level 2011 to 2020
$110,000
$101,122
$100,000 $90,981 $94,874 $94,225
$89,575 $99,349
$91,388
$90,000 $94,522
$88,740 $90,315 $91,498
$80,000 $86,461 $81,290
$75,072 $80,306 $82,474
$78,832
$70,000
$73,922 $62,475
$58,876 $62,947
$60,000 $54,447 $54,409
$53,745
$50,000 $43,436 $44,740 $44,280 $45,165
$45,765
$43,401
$40,000 $43,344
$36,938 $41,871
$38,839 $38,914 $38,118
$30,000
2011 2012 2013 2016 2018 2020
Level 1: Chief Executives Level 2: Senior Executives
Level 3: Senior Management Level 4: Management/Supervisory Staff
Level 5: Functional & Program Staff Level 6: Support Staff
©2021 The Portage Group Inc. & CharityVillageDeterminants of Compensation
Organization Characteristics Personal Characteristics
■ Region: Compensation for 5 of 6 staff levels ■ Age: Strong link between age and
is highest in Ottawa compensation at all levels except support
staff
■ Community Size: Working in a larger
community generally equals higher pay ■ Experience: Strong correlation between
experience and compensation, especially
■ Budget: Higher budgets correlate to higher years working in the current discipline
compensation for management levels
■ Education: Higher education correlates to
■ Number of Staff: Larger staff size correlates higher compensation
to higher compensation for management
levels
■ Jurisdiction: A broader geographic scope
correlates to higher compensation for 5 of 6
staff levels
©2021 The Portage Group Inc. & CharityVillageHow to Use the Benchmarks
©2021 The Portage Group Inc. & CharityVillageHow to Use the Benchmarks
Step 1: Establish the Position Profile
Organization Characteristics Personal Characteristics
■ Organization Type = Registered ■ Position = CEO
Charity
■ Status = Full-time
■ Location = BC
■ Age = 42
■ Jurisdiction = Local
■ Education = Bachelor’s Degree
■ Budget = $750,000
■ Number of Staff = 3
■ Affiliation = None
©2021 The Portage Group Inc. & CharityVillageHow to Use the Benchmarks
Step 2: Identify Your Benchmark Categories – Organization Type
■ Type: Registered Charity
■ Region: BC (Vancouver)
■ Jurisdiction: Local
N/A
■ Affiliation Status: Stand-alone
N/A
■ Budget: $500K to $1M N/A
N/A
■ Number of Staff: 1 to 5 N/A
■ Employment Status: Full-time
N/A
■ Age: 36 to 45
N/A
N/A
■ Education: Undergrad N/A
Degree/College N/A
N/A
©2021 The Portage Group Inc. & CharityVillageHow to Use the Benchmarks
Step 2: Identify Your Benchmark Categories - Region
■ Region: BC (Vancouver)
■ Type: Registered Charity
■ Jurisdiction: Local
N/A
N/A
■ Affiliation Status: Stand-alone N/A
■ Budget: $500K to $1M
N/A
N/A
■ Number of Staff: 1 to 5
N/A
■ Employment Status: Full-time
N/A
■ Age: 36 to 45
N/A
N/A
■ Education: Undergrad
N/A
N/A
Degree/College
©2021 The Portage Group Inc. & CharityVillageHow to Use the Benchmarks
Step 3: Summarize Your Benchmarks
Registered Charity Benchmarks
Base Salary Bonus Total Cash Avg. Bonus % N
2020 Total Registered Charity $95,315 $1,321 $96,636 1.1 432
British Columbia $93,775 $879 $94,655 0.8 109
Local/Municipal $86,550 $897 $87,447 0.8 179
Stand-alone $94,956 $1,285 $96,241 1.0 358
$500,001 to $1M $76,266 $1,255 $77,521 1.4 86
1 to 5 $72,826 $353 $73,179 0.5 99
36 to 45 $86,992 $914 $87,905 1.0 101
Undergrad Degree/College $85,971 $1,194 $87,165 0.9 194
BC Benchmarks
Base Salary Bonus Total Cash Avg. Bonus % N
2020 Total BC $96,706 $999 $97,705 0.8 143
Registered Charity $93,775 $879 $94,655 0.8 109
Local/Municipal $86,126 $346 $86,471 0.4 55
Stand-alone $93,942 $718 $94,660 0.6 119
$500,001 to $1M $79,272 $961 $80,233 1.0 23
1 to 5 $79,908 $648 $80,557 0.8 33
36 to 45 $87,505 $118 $87,623 0.1 39
Undergrad Degree/College $83,203 $777 $83,980 0.8 48
©2021 The Portage Group Inc. & CharityVillageHow to Use the Benchmarks
Step 4: Consider Quartiles and Choose Data Points
Registered Charity Benchmarks
Base Salary Bonus Total Cash Avg. Bonus % N
2020 Total Registered Charity $95,315 $1,321 $96,636 1.1 432
British Columbia $93,775 $879 $94,655 0.8 109
Local/Municipal $86,550 $897 $87,447 0.8 179
Stand-alone $94,956 $1,285 $96,241 1.0 358
$500,001 to $1M $76,266 $1,255 $77,521 1.4 86
1 to 5 $72,826 $353 $73,179 0.5 99
36 to 45 $86,992 $914 $87,905 1.0 101
Undergrad Degree/College $85,971 $1,194 $87,165 0.9 194
1st Quartile 2nd Quartile 3rd Quartile 4th Quartile 95th Percentile
< $68,300 $68,300 to $87,700 $87,700 to $114,900 $114,900 < $180,000
©2021 The Portage Group Inc. & CharityVillageHow to Use the Benchmarks
Step 4: Consider Quartiles and Choose Data Points
BC Benchmarks
Base Salary Bonus Total Cash Avg. Bonus % N
2020 Total BC $96,706 $999 $97,705 0.8 143
Registered Charity $93,775 $879 $94,655 0.8 109
Local/Municipal $86,126 $346 $86,471 0.4 55
Stand-alone $93,942 $718 $94,660 0.6 119
$500,001 to $1M $79,272 $961 $80,233 1.0 23
1 to 5 $79,908 $648 $80,557 0.8 33
36 to 45 $87,505 $118 $87,623 0.1 39
Undergrad Degree/College $83,203 $777 $83,980 0.8 48
1st Quartile 2nd Quartile 3rd Quartile 4th Quartile 95th Percentile
< $70,000 $70,000 to $89,700 $89,700 to $113,100 $113,100 < $173,000
©2021 The Portage Group Inc. & CharityVillageHow to Use the Benchmarks
Step 5: Set Range
■ Note:
• There is no one correct approach.
• The report data is a guideline only.
• You should consider other factors such as the cost to replace staff and the
current labour market.
• The greatest weight should be given to the closest or most relevant
comparables.
©2021 The Portage Group Inc. & CharityVillageHow to Use the Benchmarks
Step 5: Set Range
Registered Charity Benchmarks
■ Common Approach 1: Select High
Total Cash
and Low
2020 Total Registered Charity $96,636 ALT. HIGH
British Columbia $94,655
• High = Total BC - $97,705 Local/Municipal $87,447
• Low = Staff of 1 to 5 - $73,179 Stand-alone $96,241
$500,001 to $1M $77,521 ALT. LOW
■ Range would be $73,200 to 1 to 5 $73,179 LOW
$97,700
■ Mid point is $85,450
((73,200+$97,700)/2) BC Benchmarks
Total Cash
2020 Total BC $97,705 HIGH
Registered Charity $94,655
Local/Municipal $86,471
Alternate Approach (drop high and low) Stand-alone $94,660
Range: $77,500 to $96,600
$500,001 to $1M $80,233
Mid point: $87,050
1 to 5 $80,557
©2021 The Portage Group Inc. & CharityVillageHow to Use the Benchmarks
Step 5: Set Range
Registered Charity Benchmarks
■ Common Approach 2: Benchmark Average
±X% Total Cash
2020 Total Registered Charity $96,636
• Assume desired range variance is 10% British Columbia $94,655
Local/Municipal $87,447
• Average of benchmarks is $88,300 (rounded) Stand-alone $96,241
• Desired variance is ± $8,830 ($88,300 X 10%) $500,001 to $1M $77,521
1 to 5 $73,179
• Upper Limit = $97,130 ($88,300 + $8,830) 36 to 45 $87,905
• Lower Limit = $79,470 ($88,300 - $8,830) Undergrad Degree/College $87,165
■ Range would be $79,500 to $97,100 BC Benchmarks
■ Mid point is $88,300 Total Cash
2020 Total BC $97,705
Registered Charity $94,655
Local/Municipal $86,471
Stand-alone $94,660
$500,001 to $1M $80,233
1 to 5 $80,557
36 to 45 $87,623
Undergrad Degree/College $83,980
©2021 The Portage Group Inc. & CharityVillageHow to Use the Benchmarks
Step 5: Set Range Avg. Reg. Charity $87,613
Registered Charity Benchmarks
■ Common Approach 3: Average of Category
Averages ±X% Total Cash
2020 Total Registered Charity $96,636
• Assume desired range variance is 10% British Columbia $94,655
Local/Municipal $87,447
• Average of category benchmarks is $88,300 Stand-alone $96,241
(rounded [($87,613+$88,330)/2]) $500,001 to $1M $77,521
• Variance is ± $8,830 ($88,300 X 10%) 1 to 5 $73,179
• Upper Limit = $96,690 ($88,300 + $8,830)
• Lower Limit = $79,110 ($88,300 - $8,830) BC Benchmarks
■ Range would be $79,500 to $97,100
Total Cash
■ Mid point is $88,300 2020 Total BC $97,705
Registered Charity $94,655
Local/Municipal $86,471
Stand-alone $94,660
Average of Category $500,001 to $1M $80,233
1 to 5 $80,557
Benchmark $88,330
Avg. BC $89,047
©2021 The Portage Group Inc. & CharityVillageMAKING THE CASE
in 2021
©2021 The Portage Group Inc. & CharityVillage2020 IN BRIEF
This has been the most
severe crisis for the world of
work since The Great
Depression of the 1930s.
Its impact is far greater than
that of the global financial
crisis of 2009.
Guy Rider, Director-General
International Labour Organization
January 2021
©2021 The Portage Group Inc. & CharityVillageSECTOR IMPACT
■ May 2020: Charity revenues declining steeper than 2009
recession (Imagine Canada)
■ Early in the pandemic, most charities [69%] had revenue
drops and staff cuts [30%] (Imagine)
■ Update November-December: “Significant” decline had
remained constant
■ Giving levels during the holiday season/end of 2020 were
on track to be 40% lower than previous levels per
Statistics Canada data (Imagine)
■ Some good news! ‘Giving Tuesday’ (Dec. 1, 2020) saw
online donations jump from $5M to $11M (Canada
Helps)
■ Demand for charitable services also increasing by ↑45%
■ Bottom line: Doing more with less (incl. fewer
volunteers)
©2021 The Portage Group Inc. & CharityVillageTrends in Compensation
■ Approximately half (43%) of
organizations reported in Fall 2020
that their salary plans for 2021
changed due to COVID (Gallagher)
■ Of these organizations:
⁃ 45% - reducing raises (less)
⁃ 35% - suspending raises (none)
⁃ 6% - reducing wages (cut)
■ Employers are generally reluctant
to cut wages due to the impact on
morale. Their approach is to reduce
expenses.
©2021 The Portage Group Inc. & CharityVillageTrends in Compensation
■ 36% of employers in Canada froze wages in 2020 (source: Morneau Shepell)
■ 13% of surveyed Canadian organizations planned a freeze in 2021 (on top of the
36% doing so in 2020)
■ For those receiving a salary increase, Morneau reports it was < 2% in 2020 and
will be less than 2% this year
©2021 The Portage Group Inc. & CharityVillageTrends in Compensation
■ Morneau Shepell’s forecast for 2021 among all Canadian
employers aligns with our results for the charitable/non-profit
sector
⁃ Those expecting a change in cash compensation in 2021
anticipate increases from 1% to 1.8% (across all staff levels)
AVERAGE ANTICIPATED CHANGE IN CASH COMPENSATION – NEXT 12 MONTHS
Level 1 Level 2 Level 3 Level 4 Level 5 Level 6
1.8% 1.4% 1.6% 1.8% 1.2% 1.0%
©2021 The Portage Group Inc. & CharityVillageTrends in Compensation
ANTICIPATED CHANGE IN CASH COMPENSATION – NEXT 12 MONTHS
1%
Level 1: Chief Executives (N=456) 52% 34% 8% 5%
Level 2: Senior Executives (N=172) 61% 28% 7% 4%
0.4%
Level 3: Senior Management
39% 49% 9% 3%
(N=362)
0.4%
Level 4: Management/Supervisory
42% 47% 7% 5%
Staff (N=516)
Level 5: Functional & Program
43% 52% 4% 1%
Staff (N=846)
Level 6: Support Staff (N=427) 52% 45% 2% 1%
0% 20% 40% 60% 80% 100%
Percentage of staff
Decrease No change Less than 3% 3.1% to 5% More than 5%
©2021 The Portage Group Inc. & CharityVillageEmployer Response
■ Consider officially approving increases,
then deferring implementation to
when conditions allow
■ Bonus if it’s affordable
(Willis Towers Watson
recommendation)
©2021 The Portage Group Inc. & CharityVillageEmployer Response
■ 68% of employers indicate they have increased their focus on employee
wellness in the pandemic
©2021 The Portage Group Inc. & CharityVillageEmployer Response
■ Six ideas from Forbes
1. Demonstrate genuine recognition and appreciation.
2. Leaders are visible and approachable (e.g., promptly respond).
3. Communicate with transparency.
4. Show empathy and leadership.
5. Support the complete well-being of employees: Physical. Mental.
Emotional. Relational. Financial.
6. Assist employees in preparing for the future (e.g., offer training).
©2021 The Portage Group Inc. & CharityVillageMAKING THE CASE
■ Some fundamentals:
• Keep your Board informed of how
your organization is performing in
areas of key success metrics; show
how you’re outperforming others
in the sector in positive ways.
• Where Boards cannot justify
increases at this time, arm them
with good data on compensation
trends and performance metrics. It
builds the case to make up lost
ground in future.
©2021 The Portage Group Inc. & CharityVillageMaking the Case for Change
1. It costs more to replace than retain good performers
⁃ Organizations have not stopped hiring for key positions
⁃ Hiring and training costs to replace a proven performer will be
many thousands of dollars
⁃ Know what value you have delivered in the past year
(e.g., extra work taken on; project ‘wins’)
⁃ Current environment presents extraordinary challenges for
outside hires – hold on to proven performers!
©2021 The Portage Group Inc. & CharityVillageMaking the Case for Change
2. The CharityVillage Report is your Ally
⁃ Evidence will bolster your case
⁃ Knowing your worth using objective
data
⁃ Remember, where increases can’t be
possible now, see if it can be approved
‘on paper’ and build on it when future
conditions allow
©2021 The Portage Group Inc. & CharityVillageMaking the Case for Change
3. Be Realistic
⁃ Know the health/status of your organization.
⁃ Don’t ask for 5% when the market suggests 1.5%.
⁃ “Art of the possible” e.g., if organization is in financial peril =
likely impossible ask.
⁃ Your employer knows your value and has told you. You also know
compensation has been on the agenda, considered, and rejected.
©2021 The Portage Group Inc. & CharityVillageMaking the Case for Change
4. Be Creative
IT’ S NOT ONLY THE $ € £
⁃ What else may be a non-salary reward?
⁃ Consider enhancements:
• Vacation
• Outside work (e.g., PT consulting)
• PD/Education
• Benefits (insurance, pension, etc.)
• Workplace policies (e.g., work from
home)
©2021 The Portage Group Inc. & CharityVillageMaking the Case for Change
5. Remember Larry King
⁃ Don’t put the other person on the defensive
⁃ Keep it simple
©2021 The Portage Group Inc. & CharityVillageMaking the Case for Change
6. Timing
“You don’t have to swing hard to hit a home run.
If you’ve got the timing, it will go.”
Credit: Yogi Berra Museum
©2021 The Portage Group Inc. & CharityVillageTiming
Not good timing Better timing
1. Despite difficult times, the Board has 1. When you over-delivered and the
worked hard to afford/approve an results are known.
increase. Don’t push for more.
2. You’re essential to a new project or
2. You’re in the queue with many others initiative.
with the same ask (e.g., performance
review time). 3. The tide turns and performance
indicators are improving.
3. Read your supervisor and bide your
time if they’re feeling upset,
overwhelmed, preoccupied, etc.
©2021 The Portage Group Inc. & CharityVillageThe Advocates
■ If you are the chief staff person, find a champion respected by the Board to be
your advocate, such as a Senior Officer
■ If you are the HR lead or other key employee, gather the data and patiently
present the case to decision-makers, e.g.,
• turnover rates
• exit interviews
• relevant research data
©2021 The Portage Group Inc. & CharityVillageGreener Pastures?
■ Reality
• Not all NFPs are created equally;
someone can always pay more
• If there is no prospect to move up
or learn more, and you are seeking
growth, move on
• There is no cost to exploring the
market other than a little time
■ Benefits to a change
• New challenge = new environment,
learning, new experiences, new
results that are marketable
• ↑ Compensation
©2021 The Portage Group Inc. & CharityVillageThank You!
Contact Info
Geoffrey Thacker
Executive Partner
gthacker@portagegroup.com
@geoffthacker
Jack Shand
Executive Partner
jshand@portagegoup.com
@associationhelp
www.portagegroup.com
https://www.linkedin.com/company/portagegroup
https://www.facebook.com/HelpingAssociations
@ThePortageGroup
©2021 The Portage Group Inc. & CharityVillageYou can also read