Understanding Ohio's State Tests Score Reports 2017-2018 5/25/2018 - Ohio Assessment ...
←
→
Page content transcription
If your browser does not render page correctly, please read the page content below
Understanding Ohio’s State Tests
         Score Reports
            2017-2018
              5/25/2018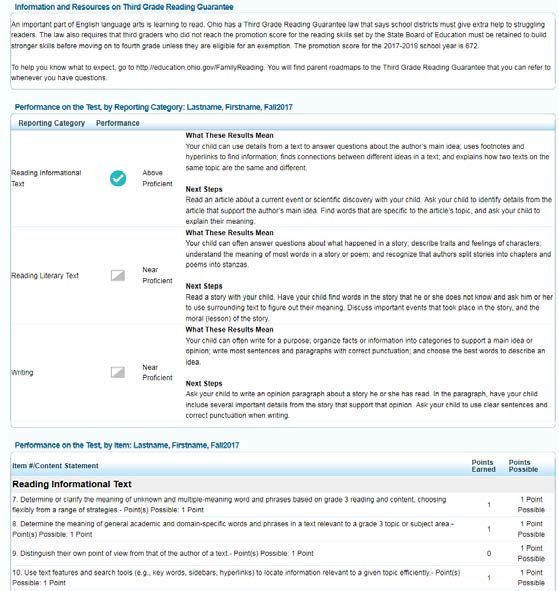
Table of Contents
Table of Contents
Introduction ................................................................................................................................... 2
   Purpose of Ohio’s State Tests........................................................................................................................... 2
   How were the tests developed? ........................................................................................................................ 2
   Subjects/Grade Levels Tested in Fall 2017 .................................................................................................... 2
   Subjects/Grade Levels Tested in Spring 2018 ............................................................................................... 3
   Subjects/Grade Levels Tested in Summer 2018 ............................................................................................ 3
   Testing Format ..................................................................................................................................................... 3
   Question Formats ................................................................................................................................................ 3
Ohio’s State Tests Scores ........................................................................................................... 4
   Scale Scores and Performance Levels ............................................................................................................ 4
   Reporting Category Indicators........................................................................................................................... 5
   Codes for No Data Reported ............................................................................................................................. 5
Ohio’s State Tests Reports ......................................................................................................... 6
   Family Score Reports ......................................................................................................................................... 6
   Online Score Reports ......................................................................................................................................... 6
     Online Reporting System ............................................................................................................................... 6
     Homepage Dashboard ................................................................................................................................... 6
     School Listing Report...................................................................................................................................... 7
     Reporting Categories Report ......................................................................................................................... 9
     Item Level Report .......................................................................................................................................... 10
     Student Listing Report .................................................................................................................................. 11
     Individual Student Report ............................................................................................................................. 12
Glossary....................................................................................................................................... 16

Table of Figures
Figure 1. Homepage Dashboard........................................................................................................................................ 7
Figure 2. School Listing Report .......................................................................................................................................... 8
Figure 3. Exploration Menu................................................................................................................................................. 8
Figure 4. Reporting Categories Report ............................................................................................................................. 9
Figure 5. Item Level Report .............................................................................................................................................. 10
Figure 6. Student Listing Report ...................................................................................................................................... 11
Figure 7. Individual Student Report for Grade 3 English language arts .................................................................... 12
Figure 8. Individual Student Report – All Other Subjects............................................................................................. 14

                           DISCLAIMER: All data included in the images and examples used throughout
                                this document are fictitious and for demonstration purposes only.

                                                                                              Page 1 │ Understanding Ohio’s State Tests Reports 2017-2018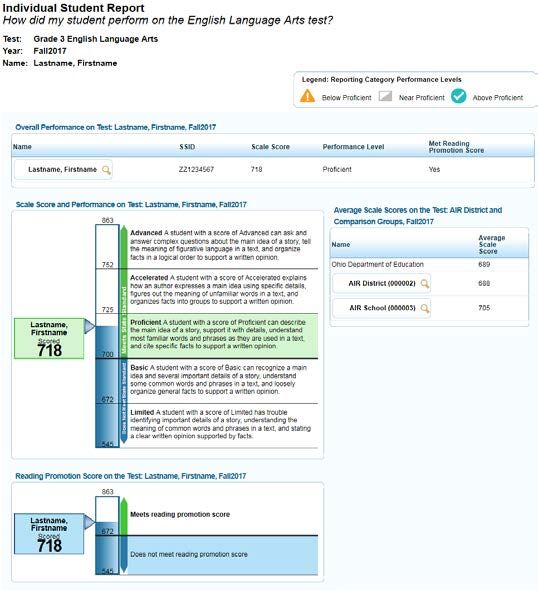
Understanding Ohio’s State Tests Reports
Introduction
This document has been prepared to help you understand the score reports for Ohio’s State Tests for the
2017-2018 school year. It includes explanations of the reports, information about the content assessed in
relation to Ohio’s Learning Standards and a glossary of the terms used in these reports.
Authorized district and school personnel can log in to the Online Reporting System to access and view their
score reports. Assistance with the reporting system is available in the Online Reporting System User Guide,
which is available on the Ohio’s State Tests Portal or by clicking the Help button within the system.
Purpose of Ohio’s State Tests
State achievement tests tell us how well our students are growing in the knowledge and skills outlined in Ohio’s
Learning Standards. These tests help guide and strengthen future teaching so we can be sure that we are
preparing our students for long-term success in school, college, careers and life. Test results also allow
citizens to know how their local schools are performing compared to others around the state.
How were the tests developed?
Test development is an extensive, ongoing process for ensuring that state tests are valid and appropriate
measures of student knowledge and skills.
The Ohio Department of Education worked with Ohio educators and the American Institutes for Research to
develop the state tests. Content advisory committees, as well as fairness and sensitivity committees discussed
whether test items were accurate and fair, were suitable for the course and measured an aspect of Ohio’s
Learning Standards.
After the tests were built, another group of educators serving on a standard-setting committee recommended
performance levels or cut scores for five levels of tests results. The State Board of Education approved these
recommendations. Additionally, the standard-setting committee prepared descriptions of what students should
know and be able to do at each of the five performance levels.
Subjects/Grade Levels Tested in Fall 2017
Districts and schools administer the grade 3 English language arts test in fall 2017.
In addition, districts and schools administer high school tests to students enrolled in first-semester courses,
needing to test for a previously completed course, or electing to retake a test in the following subjects:
Algebra I English language arts II
American government Geometry
American history Integrated mathematics I
Biology Integrated mathematics II
English language arts I Physical science (Class of 2018 only)
Page 2 │ Understanding Ohio’s State Tests Reports 2017-2018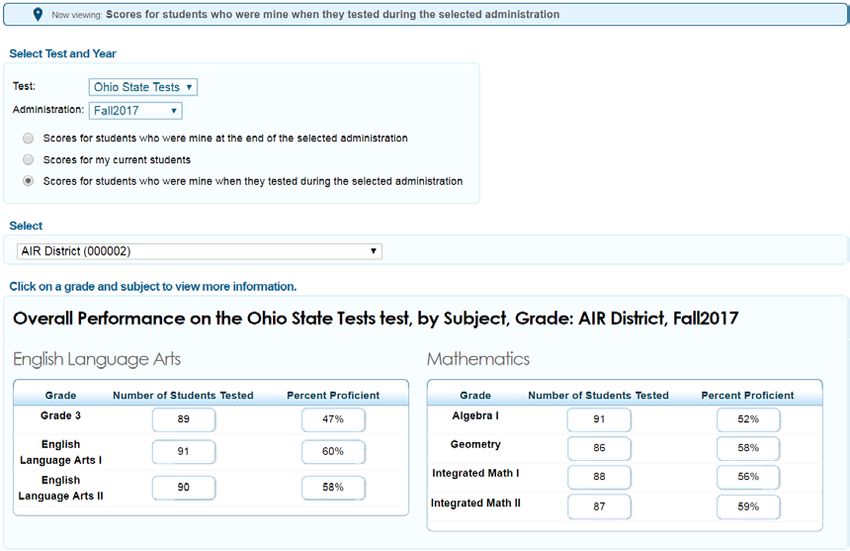
Subjects/Grade Levels Tested in Spring 2018
The following elementary-and middle-school tests are available for the spring 2018 administration:
Grade 3 English language arts Grade 6 English language arts
Grade 3 Mathematics Grade 6 Mathematics
Grade 4 English language arts Grade 7 English language arts
Grade 4 Mathematics Grade 7 Mathematics
Grade 5 English language arts Grade 8 English language arts
Grade 5 Mathematics Grade 8 Mathematics
Grade 5 Science Grade 8 Science
The following high school end-of-course tests are available for the spring 2018 administration:
Algebra I English language arts II
American government Geometry
American history Integrated mathematics I
Biology Integrated mathematics II
English language arts I Physical Science (Class of 2018 only)
Subjects/Grade Levels Tested in Summer 2018
Summer testing is optional. Students, schools and districts may elect to participate or not participate.
Participating schools and districts do not have to offer all tests.
The following elementary-school test is available for the summer 2018 administration:
Grade 3 English language arts
The following high school end-of course tests are available for the summer 2018 administration:
Algebra I English language arts II
American government Geometry
American history Integrated mathematics I
Biology Integrated mathematics II
English language arts I Physical science (Class of 2018 only)
Testing Format
Each test has two parts. Districts and schools may elect to administer both parts in one day, or they may
administer one part on one day and the other part on another day within their district test window. The test
contractor combines student responses for each part to produce one summative score. Please note, only test
parts of the same mode (online or paper) are combined into a summative score.
For the 2017-2018 school year, the test contractor has made the tests available in two formats: computer-
based testing (online) and paper-based testing. Ohio’s State Tests are online exams for all students, unless
schools demonstrate a need for paper forms, either due to limited technology capacity, or for students with
disabilities and certain religious beliefs. Paper tests also are also available in braille and large print for students
requiring specific accommodations. Bilingual English-Spanish test forms are available to students testing
online in one of the science, social studies or math courses.
Question Formats
Students respond to items in multiple ways, including by creating charts, writing extended responses and using
other interactive features. The various question types assess higher-order thinking skills and offer different
ways for students to show what they know and can do. Sample items, as well as descriptions and tutorials of
the item types, are available on the Ohio's State Tests Portal.
Page 3 │ Understanding Ohio’s State Tests Reports 2017-2018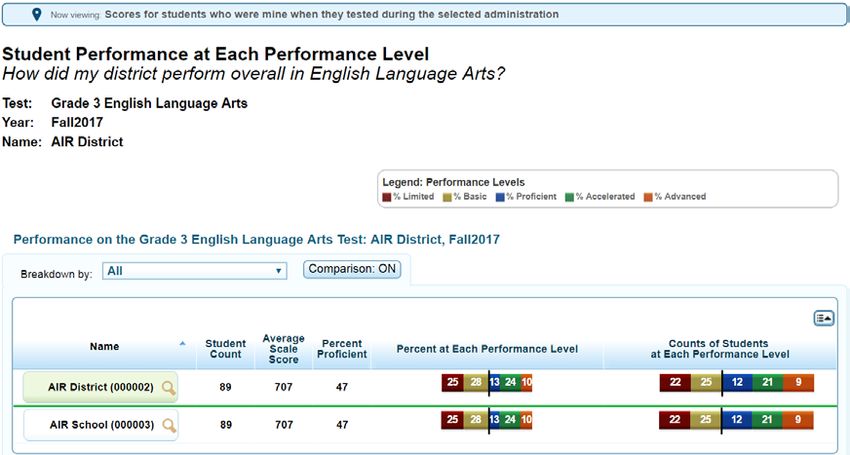
Ohio’s State Tests Scores

Scale Scores and Performance Levels
Ohio reports five performance standards: Limited, Basic, Proficient, Accelerated or Advanced. The scale score
ranges in the tables below define each level. The accelerated level of performance suggests that a student is
on track for college and career readiness. For accountability purposes, “passing” includes the Proficient,
Accelerated and Advanced levels.

                                   Table 1: Scale Score Ranges in Science
           Grade/Subject           Limited       Basic    Proficient   Accelerated           Advanced
               Grade 5             559-663     664-699      700-724          725-752           753-845
               Grade 8             575-673     674-699      700-724          725-765           766-868
          Physical science         634-683     684-699      700-724          725-748           749-815
               Biology             617-684     685-699      700-724          725-734           735-823

                              Table 2: Scale Score Ranges in Social Studies
           Grade/Subject          Limited      Basic    Proficient    Accelerated             Advanced
           American history       619-683     684-699    700-724        725-737                738-800
        American government        642-686     687-699      700-724          725-738           739-774

                       Table 3: Scale Score Ranges in English Language Arts
            Grade/Subject        Limited    Basic     Proficient  Accelerated                Advanced
                Grade 3             545-671    672-699      700-724          725-751           752-863
                Grade 4             549-673    674-699      700-724          725-752           753-846
                Grade 5             552-668    669-699      700-724          725-754           755-848
                Grade 6             555-667    668-699      700-724          725-750           751-851
                Grade 7             568-669    670-699      700-724          725-748           749-833
                Grade 8             586-681    682-699      700-724          725-743           744-805
        English language arts I     606-682    683-699      700-724          725-738           739-800
        English language arts II    597-678    679-699      700-724          725-741           742-808

In addition to the scale score ranges for grade 3 English language arts in Table 3 above, Table 4 below
summarizes the grade 3 reading promotion performance standard for the 2017-2018 school year. As indicated
in the table below, the 2017-2018 promotion score for the Third Grade Reading Guarantee is an English
language arts scale score of 672.

           Table 4. Third Grade Reading Guarantee Performance Level Scale Score Ranges
                                        Does Not Meet Promotion        Meets Promotion
                                                Standard                   Standard
        Grade 3 English language arts
                                               Below 672                At or Above 672
        Scale Score

                                                         Page 4 │ Understanding Ohio’s State Tests Reports 2017-2018
Table 5: Scale Score Ranges in Mathematics
             Grade/Subject           Limited     Basic    Proficient Accelerated                 Advanced
                 Grade 3              587-682      683-699       700-724         725-752           753-818
                 Grade 4              605-685      686-699       700-724         725-758           759-835
                 Grade 5              624-686      687-699       700-724         725-748           749-804
                 Grade 6              616-681      682-699       700-724         725-743           744-790
                 Grade 7              605-683      684-699       700-724         725-754           755-806
                 Grade 8              633-689      690-699       700-724         725-743           744-774
                Algebra I             618-681      682-699       700-724         725-753           754-814
                Geometry              604-677      678-699       700-724         725-755           756-810
            Integrated math I         618-681      682-699       700-724         725-753           754-814
            Integrated math II        594-676      677-699       700-724         725-757           758-813

For a summary of what Ohio’s Learning Standards expect students to know and do at each level, refer to the
Performance Level Descriptors available on the Ohio’s State Tests Portal.

Reporting Category Indicators
Each test has three to five reporting categories. Reporting categories represent groups of similar student skills
or learning standards assessed within each grade and subject. For example, a reporting category within grade
8 science would be life science.

Student performance on the subset of items associated with a reporting category is reported with an indicator,
rather than with scale scores. These indicators are:
    • Below proficient
    • Near proficient
    • Above proficient

Each test’s reporting categories are listed in the blueprints, which are in the General Resources folder on the
Ohio’s State Tests Portal.

Codes for No Data Reported
The following abbreviations may appear on some reports:
 • DNA — Did Not Attempt
 • INV — Invalidated

A student will receive a DNA if he or she answered at least one item but did not meet the Department’s criteria
for having attempted the test. The Department defines a test as attempted if the student responded to five
items or achieved five points.

A record will reflect INV if both parts of the student’s test were invalidated or if the student only took one part of
the test and that part was invalidated. If the student took both parts of the test and only one part of a test was
invalidated, the student will receive a score based on the non-invalidated test part.

If a student receives a condition code, the parent or student should consult the student’s designated guidance
counselor.

                                                             Page 5 │ Understanding Ohio’s State Tests Reports 2017-2018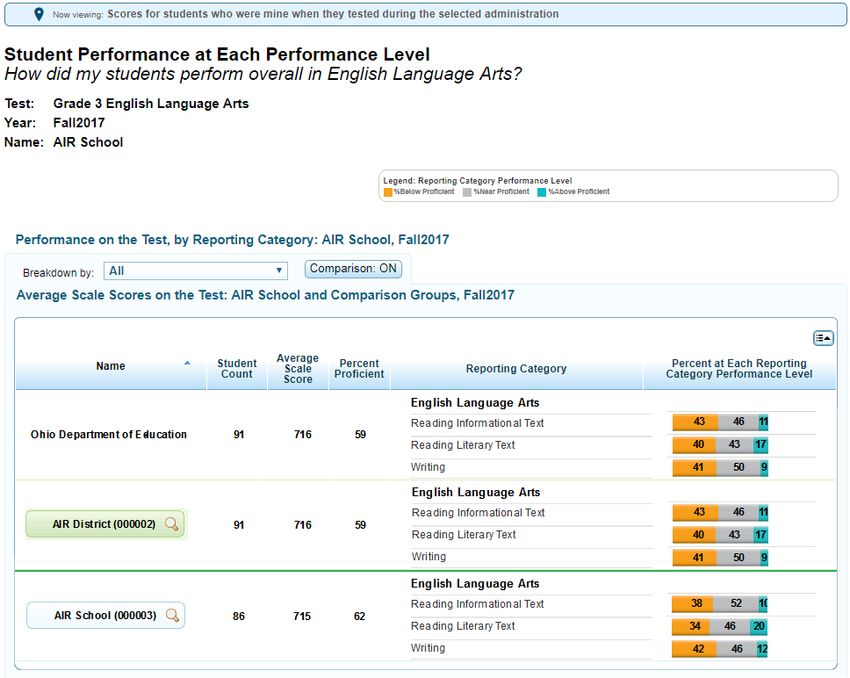
Ohio’s State Tests Reports
Ohio’s State Tests results are available in several formats.

Family Score Reports
The Ohio’s State Tests Family Score Report is a two-page color report. The first page provides resources for
families. The second page provides the student’s scale score and performance level, including the student’s
reporting category indicators and a summary of each reporting category.

Family-friendly interpretive guides for the family score reports can be found on the Ohio’s State Tests Portal on
the Reporting Resources page. Each guide walks through the elements of the family reports, as well as
definitions and frequently asked questions.

Online Score Reports
Online Reporting System
Authorized district and school personnel can log in to the Online Reporting System from the Ohio’s State Tests
Portal to access and view district and school-level Ohio’s State Tests reports of students. For more information
on accessing and navigating online score reports, readers should refer to the Accessing Score Reports section
of Online Reporting System User Guide. The user guide is available on the Ohio’s State Tests Portal or by
clicking the Help button in the Online Reporting System.

Homepage Dashboard
After logging into the Online Reporting System, district- and building-level users will first view district or school
aggregation tables on the Homepage Dashboard. The Homepage Dashboard displays the overall summary of
score data for your district or school and is the starting point for data analysis. You can navigate to more
detailed score reports from the Homepage Dashboard. The score data you see are dependent on your role; for
example, a building test coordinator only sees aggregate data for their associated school(s).

Aggregation tables that appear on the Homepage Dashboard display score data for students by grade and
subject and provide access to more detailed subject score reports. Click the corresponding grade or subject
cell that contains a value from the table. For example, if you want to view the Ohio’s State Tests subject detail
report for Grade 3 English language arts, click the “Number of Students Tested” or “Percent Proficient” buttons
in the Grade 3 English language arts row.

                                                             Page 6 │ Understanding Ohio’s State Tests Reports 2017-2018
Figure 1. Homepage Dashboard

Three radio buttons on the homepage dashboard allow district and school personnel to view reports for student
populations who fit any one of the three criteria based on enrollment. The enrollment used by this feature is
based on student information in TIDE.

   •   Scores for students who were mine at the end of the selected administration: Results for students
       who were enrolled in your school or district at the end of an administration, regardless of where that
       student is currently enrolled. This allows districts to see results for students that transferred to their
       district after testing.
   •   Scores for my current students: Results for students who are currently enrolled in your school or
       district, that tested in any school or district in Ohio for the administration. This is useful for Joint
       Vocational School Districts and Career Technology Centers that need to view scores for incoming
       students.
   •   Scores for students who were mine when they tested during the selected administration: Results
       for students who tested in your school or district for the administration, regardless of where that student
       is currently enrolled. This is the default option and is traditionally how reports are presented in Ohio.

More information is available in the ORS User Guide which is available on the portal.

School Listing Report
The School Listing Report is the default for district-level users and shows data for the grade and subject
selected on the Homepage Dashboard. A school’s performance data in the selected grade and subject
appears together with the associated district and state performances in the selected grade and subject for the
purpose of comparison. Authorized district-level users can view the data for each school in their district.

                                                           Page 7 │ Understanding Ohio’s State Tests Reports 2017-2018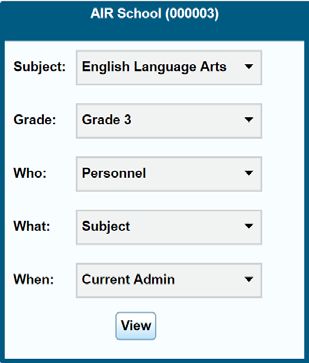
Figure 2. School Listing Report

                                         1

               2

   1. Top of Reports: The title of the report is printed here identifying the test, administration year, and
      district or school name.
   2. Bottom of Reports: This section displays the student count, average scale score, percent proficient,
      percent at each performance level and count of students at each performance level.
You can navigate from one score report to another using the exploration menu. Click the magnifying glass
symbol next to the school name to open the exploration menu. From the exploration menu drop-down lists,
select the report criteria that you wish to view.
                                             Figure 3. Exploration Menu

Using the exploration menu, you can navigate to any report by making different selections under the available
dimensions. However, the options that are available in the drop-down lists depend on your user role, the report
you are viewing and the entity level where you have opened the exploration menu. For more information
regarding the exploration menu, consult the Online Reporting System User Guide.

                                                           Page 8 │ Understanding Ohio’s State Tests Reports 2017-2018
Reporting Categories Report
The Reporting Categories Report shows the percentage of your students in each reporting category indicator.
To navigate to the Reporting Categories Report, click the magnifying glass symbol next to the school name in
the School Listing Report. The exploration menu appears. On the exploration menu, use the drop-down lists to
select the appropriate subject area, grade level, and report level. Then select Reporting Categories from the
What dropdown and Current Admin from the When dropdown. Click View.
Figure 4. Reporting Categories Report
1
2
1. Top of Reports: The title of the report is printed here identifying the test, administration year and
school name.
2. Bottom of Reports: This section displays the student count, average scale score, percent proficient
and percentage of students in each reporting category indicator. Refer to the legend on the top of the
report to understand the data represented.
Page 9 │ Understanding Ohio’s State Tests Reports 2017-2018Item Level Report
The Items Report show the performance on each operational item for the selected test. To navigate to the Item
Level Report, click the magnifying glass symbol next to the school name in the School Listing Report. The
exploration menu appears. On the exploration menu, use the drop-down lists to select the appropriate subject
area, grade level, and report level. Then select Items from the What dropdown and Current Admin from the
When dropdown. Click View.
Note: These reports are only available for Ohio’s State Tests for Mathematics, Science and Social Studies
beginning with the Spring 2017 administration and for English Language Arts beginning with the Fall 2017
administration. Students that have tested on paper, large print, braille or breach will not be included in the
percentages of this report.
Figure 5. Item Level Report
1
2
1. Top of Reports: The title of the report is printed here identifying the test, administration year and entity
name.
2. Bottom of Reports: This section displays the item number and content statement for each operational
item on the test and the percent [#] points earned for each item.
Note: The content statement may be repeated since a test may include more than one item associated
with the same standard. Also, the item numbers may not appear chronologically as they are organized on
the basis of the reporting categories with which they are associated.
Page 10 │ Understanding Ohio’s State Tests Reports 2017-2018Student Listing Report
From the School Listing Report, use the exploration menu to navigate to the Student Listing Report. On the
exploration menu, use the drop-down lists to select the appropriate subject area, grade level, and report level.
Then select Student from the Who dropdown and Current Admin from the When dropdown.
The Student Listing Report displays all the students associated with the selected school, personnel or roster
who have completed the selected test, in addition to any students who were assigned a condition code.
Figure 6. Student Listing Report
1
2
1. Top of Reports: The title of the report is printed here identifying the test, administration year and
school name.
2. Bottom of Reports: This section displays each individual student by name, SSID, scale score and
performance level.
Page 11 │ Understanding Ohio’s State Tests Reports 2017-2018Individual Student Report
The Individual Student Report displays the student’s scale score and performance level for the selected
subject. The report includes a graphical representation of a student's performance and text explaining what the
achieved performance level means and possible next steps. The report includes average scale scores for the
state, district and school for comparison purposes.
From the Student Listing Report, use the exploration menu to navigate to the Student Listing Report. On the
exploration menu, use the drop-down lists to select the appropriate subject area and grade level. Then select
Student from the Who dropdown, select a report type from the What dropdown and select Current Admin from
the When dropdown.
Figure 7. Individual Student Report for Grade 3 English language arts
5
1
2 3
6
4
1. Student Information — The table includes the student’s name, SSID, overall scale score and
performance level. For grade 3 ELA the reading promotion status will also be displayed.
2. Scale Score and Overall Performance — The barrel chart visually depicts the student’s performance
level based on his or her overall scale score. It also includes a brief description of the student’s
performance level.
3. Comparison Scores — The Comparison Scores table includes the average scale score for the state,
district and school with which the student is associated.
4. Third Grade Reading Guarantee — This table includes information about the Third Grade Reading
Guarantee requirements, including the reading promotion score. For more information for the reading
promotion score and status, please refer to the glossary in this document.
Page 12 │ Understanding Ohio’s State Tests Reports 2017-20185. Student Test Performance — The Student Test Performance by Reporting Category table includes
two elements. First, the table lists the student’s indicators for each reporting category. Refer to the
legend on the top of the report to understand the data represented. Second, the What These Results
Mean and Next Steps text provides a detailed explanation of the student’s skills based on the achieved
performance level and provides guidance on advancing the student’s capabilities.
6. Item Level Data – The Student Test Performance by Item table includes the student’s performance on
each operational item. To the left of the table the item number and description of the content statement
for each item included for the standard is shown. Item content is not included. To the right of the table is
the points earned and total points possible for each item. This data is only available for students that
tested with the regular online form. This report will display “N/A” for each item for students that tested
with a Breach, paper, or special version form. Students can earn between zero and ten points on
writing items. Per the writing rubric, students can earn zero to four points on the Purpose, Focus, and
Organization dimension; zero to four points on the Evidence and Elaboration dimension; and zero to
two points on the Conventions of Standard English dimension. Writing items have three rows on the
item level report – one for each of the writing dimensions. In some cases when a student receives no
points for a writing item, one of the condition codes listed below may appear for one or more of the
dimension scores. These codes help to better understand the reason the student received no points.
For more information on these condition codes, refer to the document How a student can earn a zero
on a written response on ODE’s website here.
• Blank Response
• Not Enough Data
• Not Enough Original text
• Repetitive Text
• Foreign Language Response
• Unreadable Response
• Off Topic Response
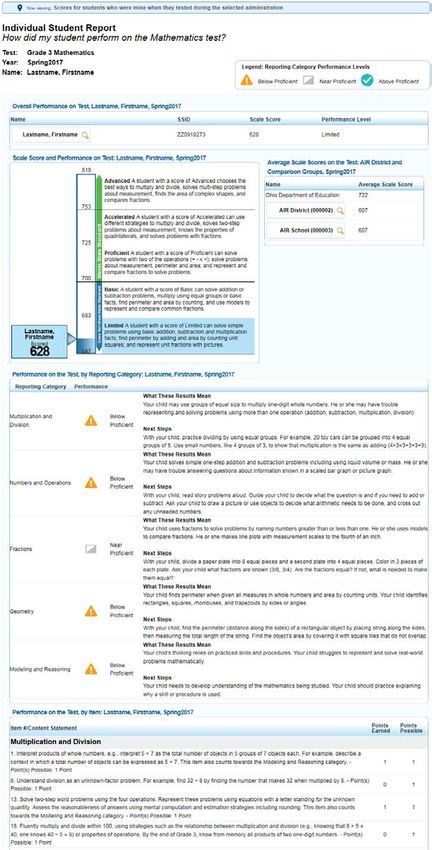
Page 13 │ Understanding Ohio’s State Tests Reports 2017-2018Figure 8. Individual Student Report – All Other Subjects
1
2 3
4
5
1. Student Information — The table includes the student’s name, SSID, overall scale score and
performance level.
2. Scale Score and Overall Performance — The barrel chart visually depicts the student’s performance
level based on his or her overall scale score. It also includes a brief description of the student’s
performance level.
Page 14 │ Understanding Ohio’s State Tests Reports 2017-20183. Comparison Scores — The Comparison Scores table includes the average scale score for the state,
district and school with which the student is associated.
4. Student Test Performance — The Student Test Performance by Reporting Category table includes
two elements. First, the table lists the student’s indicators for each reporting category. Refer to the
legend on the top of the report to understand the data represented. Second, the What These Results
Mean and Next Steps text provides a detailed explanation of the student’s skills based on the achieved
performance level and provides guidance on advancing the student’s capabilities.
5. Item Level Data – The Student Test Performance by Item table includes the student’s performance on
each operational item. To the left of the table the item number and description of the content statement
for each item included for the standard is shown. Item content is not included. To the right of the table is
the points earned and total points possible for each item. This data is only available for students that
tested with the regular online form. This report will display “N/A” for each item for students that tested
with a Breach, paper, or special version form. Students can earn between zero and ten points on
writing items. Per the writing rubric, students can earn zero to four points on the Purpose, Focus, and
Organization dimension; zero to four points on the Evidence and Elaboration dimension; and zero to
two points on the Conventions of Standard English dimension. Writing items have three rows on the
item level report – one for each of the writing dimensions. In some cases when a student receives no
points for a writing item, one of the condition codes listed below may appear for one or more of the
dimension scores. These codes help to better understand the reason the student received no points.
For more information on these condition codes, refer to the document How a student can earn a zero
on a written response on ODE’s website here.
1. Blank Response
2. Not Enough Data
3. Not Enough Original text
4. Repetitive Text
5. Foreign Language Response
6. Unreadable Response
7. Off Topic Response
Page 15 │ Understanding Ohio’s State Tests Reports 2017-2018Glossary
Computer-Based Testing — When taking the test on the computer or supported device, students make their
answer choices using the mouse or keyboard, and they may use various testing tools, such as the
strikethrough tool or the highlighter tool, as they work. Once they complete the test, they submit their answers
electronically. Before exiting the assessment and submitting their responses, the program takes students to a
screen that identifies questions that are answered, unanswered and marked for review.
Items — Test questions that students are required to answer.
Ohio’s Learning Standards — Ohio’s Learning Standards define expectations for student learning in Ohio’s
classrooms. Find information about Ohio’s Learning Standards on the Ohio Department of Education website
at education.ohio.gov.
Performance Level — Ohio reports five performance levels (or standards): Limited, Basic, Proficient,
Accelerated or Advanced.
Performance Level Descriptors — Each subject has its own specific descriptions of each performance level.
Performance Level Descriptors for all content areas may be found on the Reporting Resources page of the
Ohio’s State Tests portal.
Reading Promotion Score — The reading promotion score is used to determine if the student satisfied the
requirements of the Third Grade Reading Guarantee. This only applies to grade 3 English language arts.
Reading Promotion Status — Ohio has a Third Grade Reading Guarantee law that says school districts must
give extra help to struggling readers. The law also requires that third graders who do not reach the promotion
score set by the State Board of Education must be retained to build stronger skills before moving on to fourth
grade unless they are eligible for an exemption. The 2017-2018 promotion score for the Third Grade Reading
Guarantee is a grade 3 English language arts scale score of 672.
Reporting Category — Reporting categories represent groups of similar student skills or content standards
assessed within each grade and subject.
Reporting Category Indicators — The report shows student performance on the subset of items associated
with a reporting category with an indicator, rather than with scale scores. These indicators are below proficient,
near proficient and above proficient.
Scale Score — A scale score is a conversion of a student's raw score on a test to a common scale that allows
for a numerical comparison between students. For example, we can compare scale scores for students who
took the Algebra I test this year with those who will take this text next year. Scale scores are not comparable
across different subjects.
SSID — Statewide student identifier
Page 16 │ Understanding Ohio’s State Tests Reports 2017-2018You can also read