Results of Operations Three Months Ended June 30, 2021 - KOSÉ Corporation July 30, 2021

Page created by Lori Shelton
 
CONTINUE READING
Results of Operations Three Months Ended June 30, 2021 - KOSÉ Corporation July 30, 2021
Results of Operations
Three Months Ended June 30, 2021

           KOSÉ Corporation
            July 30, 2021
Results of Operations Three Months Ended June 30, 2021 - KOSÉ Corporation July 30, 2021
FY2021

          Fiscal year end change to December 31 beginning in FY2021
            The consolidated financial statements for the transitional fiscal period ending on
            December 31, 2021 will include the following periods:
              ・ KOSÉ and its consolidated subsidiaries in Japan with a March 31 fiscal year end:
                  April-December 2021
              ・ Consolidated subsidiaries with a December 31 fiscal year end:
                  January-December 2021

          The KOSÉ Group applies the Accounting Standard for Revenue Recognition (ASBJ
           Statement No. 29, March 30, 2020) and the Implementation Guidance on Accounting
           Standard for Revenue Recognition (ASBJ Guidance No. 30, March 30, 2020) from FY2021.

         * Adjusted results of operations and their changes
          The Accounting Standard for Revenue Recognition (ASBJ Statement No. 29, March 30, 2020) and the
          Implementation Guidance on Accounting Standard for Revenue Recognition (ASBJ Guidance No. 30,
          March 30, 2020) have been applied retrospectively.
          These comparisons have not been audited by the independent auditor and are provided solely for
          reference purposes.

                                                                                                            2
Results of Operations Three Months Ended June 30, 2021 - KOSÉ Corporation July 30, 2021
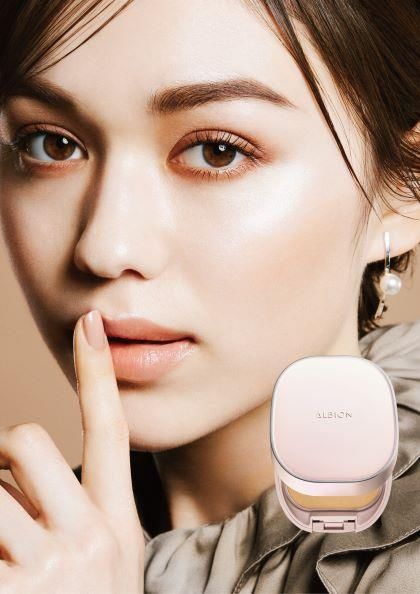
1Q FY2021 Financial Summary

   Small sales increase but strong earnings growth due to cost controls

    Net sales                         ¥58.7 billion (up 2.7% YoY; up 2.4% after excluding the effects of
                                       changes in foreign exchange rates)
                                        Sales in Japan and China increased following the 2020 downturn

    Operating profit                  ¥3.4 billion (up 211.6% YoY)
                                        A big increase due to sales growth and cost controls for all operations
                                                                                                                                                                      Valuation
                  Initial outlook                                                               Progress
                                                                                                                                                                     1Q FY2021

                 Mid-single-digit   Weak consumer sentiment as people stay home for safety but strong e-commerce sales growth. Expect a recovery in the
     Japan
                    increase        second half as more people are vaccinated.
                                                                                                                                                                        ▲
                                    Higher sales in all channels as the pandemic ended quickly in China. Aiming for more market share growth by using existing and
     China            +20%
                                    new stores, many promotions, and other activities.
                                                                                                                                                                        〇

   South Korea        +10%          Travel restrictions still in effect. Expect supply problems for some problems to end during the summer.                             ▲
  Europe & USA   Mid-single-digit   Economies are recovering along with vaccinations. e-commerce sales continue to increase and stores are reopening. But sales
     (Tarte)        increase        still weak at stores in urban locations.
                                                                                                                                                                        〇
                                                                                                                                                                                  3
Results of Operations Three Months Ended June 30, 2021 - KOSÉ Corporation July 30, 2021
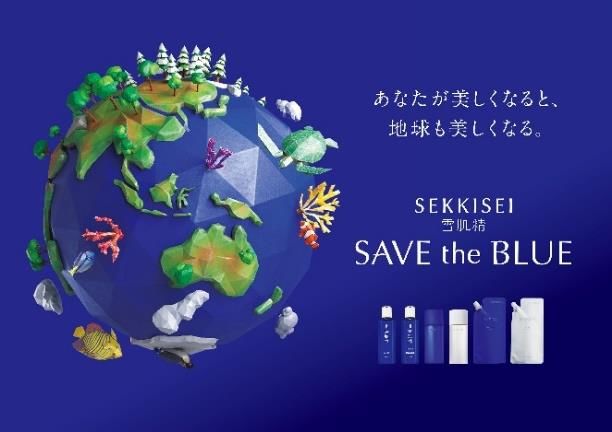
Consolidated Income Statement Highlights

                                                                   1Q

                                             Adjusted FY2020                      FY2021
                                                                                                          YoY change      YoY change
                                                          Ratio to net                     Ratio to net    (amount)         (ratio)
                                          Amount                         Amount
       (billion yen)                                         sales                            sales

       Net sales                                   57.2        100.0%         58.7             100.0%             +1.5         +2.7%

        Cost of sales                              16.1         28.3%         16.0               27.4%            (0.0)       (0.6)%

        SG&A expenses                              39.9         69.8%         39.2               66.7%            (0.7)       (1.8)%

       Operating profit                             1.1          1.9%             3.4             5.9%            +2.3       +211.6%

       Ordinary profit                              1.5          2.7%             3.7             6.4%            +2.1       +139.6%

       Profit before income taxes                   2.5          4.4%             3.6             6.3%            +1.1        +45.7%

       Profit attributable to owners of
                                                    1.5          2.8%             2.3             4.0%            +0.7        +49.8%
       parent

       Net income per share                    27.84 yen                      41.69 yen                         +13.85 yen

                                                                                                                                       4
Results of Operations Three Months Ended June 30, 2021 - KOSÉ Corporation July 30, 2021
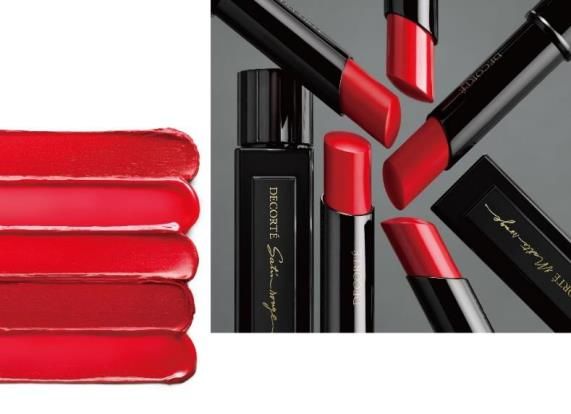
YoY Changes in Net Sales

                                                                      (billion yen)

                                  +1.2    (1.4)               (0.2)
                           +1.7                        +0.2

                                                                      58.7
         57.2

                                         Total= +1.5

                                                                                      5
Results of Operations Three Months Ended June 30, 2021 - KOSÉ Corporation July 30, 2021
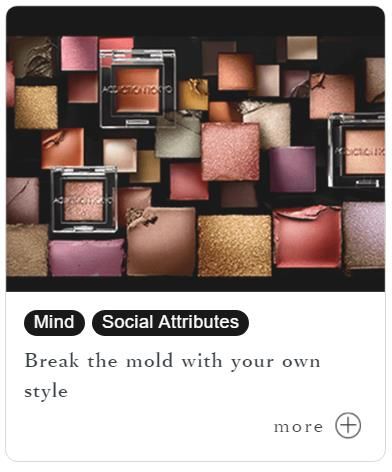
YoY Changes in Operating Profit

                                                                    (billion yen)

                                   +0.0                      +1.9
                                                     (1.2)
                            +1.5                                    3.4

            1.1                       Total = +2.3

                                                                                    6
Results of Operations Three Months Ended June 30, 2021 - KOSÉ Corporation July 30, 2021
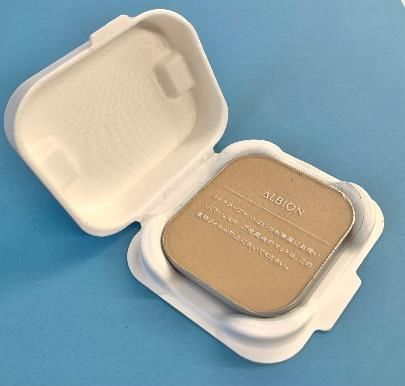
Sales and Operating Profit by Segment

   Cosmetics
     Net sales (billion yen)            Operating profit (billion yen)                             Higher sales in Japan/China following
                                                                                                    the 2020 downturn
                                                                                      Net sales
                                                                                                   Strong DECORTÉ sales in all channels
                               48.6                                                                SEKKISEI sales are recovering
              46.2                                5.9                         6.3
                                                                                                 Cost of sales ratio decreased because
                                                                                                  of strong DECORTÉ sales and a
                                                                                      Operating   recovery in SEKKISEI sales
         Adjusted FY2020       FY2021            FY2020                      FY2021    profit    SG&A expenses decreased due to cost
                                                          Operating margin                        controls and more efficient sales
                                                  13.0%                       13.0%
                                                                                                  promotion activities
   Cosmetaries

     Net sales (billion yen)            Operating profit (billion yen)                             Slow sales in Japan as people stayed
                                                                                      Net sales
                                                                                                    home due to the pandemic

               10.4                                                                              Cost of sales increased due to a
                                9.8                                                               negative change in product mix and
                                                 (2.5)                       (1.6)    Operating   an increase in discarded merchandise
                                                                                       profit    SG&A expenses decreased due to cost
                                                                                                  controls and more efficient sales
          Adjusted FY2020      FY2021            FY2020                      FY2021
                                                                                                  promotion activities
                                                          Operating margin
                                                    -                           -
                                                                                                                                            7
Results of Operations Three Months Ended June 30, 2021 - KOSÉ Corporation July 30, 2021
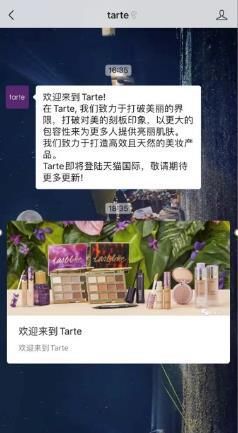
Global Sales of Major Brands   *The Accounting Standard for Revenue Recognition is not used.

                                                                                                                             (billion yen)

                          DECORTÉ                                                                       SEKKISEI

                                                                                                                   Japan     Overseas
                                                      20.6
             19.2
                           17.2

             10.5
                                                     15.8

                           13.5

                                                                                                4.9
                                                                                                                       3.2
              8.7                                                                               1.1         2.4
                                                      4.8                                                   0.7        0.8
                           3.7                                                                  3.8
                                                                                                            1.7        2.4

            FY2019        FY2020                   FY2021                                      FY2019     FY2020     FY2021

                                                                                                                                             8
Results of Operations Three Months Ended June 30, 2021 - KOSÉ Corporation July 30, 2021
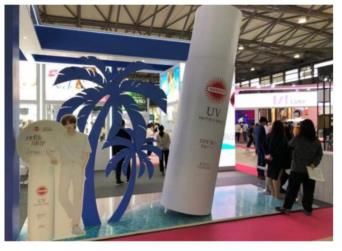
Global Sales of Major Group Companies (after adjustment)

                                                                                                  (billion yen)

           ALBION CO., LTD.                  KOSÉ Cosmeport Corp.            Tarte, Inc

                                                                                          Japan   Overseas

                        12.2
         10.3           1.8

         1.5
                                                            6.2
                                              5.7
                                                            0.2
                                              0.1
                        10.4
          8.8
                                                                      8.5
                                              5.6            6.0                          7.0

        FY2020        FY2021                 FY2020        FY2021   FY2020           FY2021

                                                                                                                  9
Results of Operations Three Months Ended June 30, 2021 - KOSÉ Corporation July 30, 2021
Net Sales by Region (after adjustment)

  Sales in China continue to increase and overseas sales were 42.5% of total sales.

                                    Adjusted FY2020                       FY2021
                                                                                                  YoY change     YoY change
                                                  Ratio to net                     Ratio to net    (amount)        (ratio)
                                  Amount                         Amount
   (billion yen)                                     sales                            sales

                   Japan                   32.0         56.0%              33.7          57.5%           +1.7         +5.4%

                   Asia                    16.6         29.1%              17.8          30.4%           +1.2         +7.4%

              North America                 7.6         13.4%               6.4          11.0%           (1.1)      (15.6)%

                   Other                    0.8          1.5%               0.6           1.1%           (0.2)      (26.6)%

                   Total                   57.2       100.0%               58.7        100.0%            +1.5         +2.7%

              Overseas sales               25.1         44.0%              24.9          42.5%           (0.2)        (0.8)%

                                                                                                                               10
Net Sales by Region: Japan

  Sales were higher year on year , e-commerce also contined to grow

                                                                                     Market Trends
                         Adjusted FY2020   FY2021
                                                       YoY change    YoY change       Return of economic activity restrictions due to the April state of
  (billion yen)                                         (amount)       (ratio)
                                                                                       emergency declaration and extension of measures to prevent the
            1Q                     32.0         33.7          +1.7         +5.4%       spread of COVID-19
                                                                                      A slow recovery of the skin care category; strong hair care product
                                                                                       sales despite the pandemic
 KOSÉ                                                                                 Diversification of procurement methods by stores, such as Online
                                                                                       Merge Online (merging of online and offline retailing)
                   Sales were higher following the 2020 downturn but still below
                    the pre-pandemic level                                            Expect consumer spending to start recovering slowly in the fall of 2021
   Overall                                                                             as more people are vaccinated
                   E-commerce sales continue to increase as people stay home
                    during the pandemic
                   Specialty store sales have almost recovered to the pre-
     High           pandemic level and department store sales are recovering, but    Strategies for FY2021
   prestige         sales are still below the 2019 level                                              Increase the use of distribution e-commerce
                   Existing DECORTÉ and ALBION customers are returning                               Start the DECORTÉ online boutique (official web
                   Skin care sales growth outpaced the market; point makeup sales                     shop)
   Prestige         were weak                                                           Overall       Start operation of the online counseling service,
                   Carté HD increased its market share                                                DECORTÉ Personal Beauty Concierge
                                                                                                      End sales activities for nine brands
                   Cleansing and sunscreen sales are recovering from the 2020
                                                                                                      Start providing online counseling (ALBION)
                    downturn
 Cosmetaries
                   Sales were affected by product returns associated with the
                    updated line of FASIO products
                                                                                                                                                                 11
Net Sales by Region: Asia

    Strong sales in all channels in China one year after the COVID-19 outbreak

                                                                                                                                   Market Trends
                                                                                 YoY change             YoY change
                                     Adjusted FY2020         FY2021
  (billion yen)                                                                   (amount)                (ratio)                                  Strong sales of cosmetics even though government
                                                                                                                                     China          restrictions on activities held down the economy early in
                     1Q                        16.6                  17.8                   +1.2                +7.4%                               2021

                   Online                        2.9                  3.1                   +0.2                +8.4%              South Korea     Tourists are still unable to travel to South Korea
   China *note

                   Offline                       1.0                  1.8                   +0.8              +77.2%                               January-March sales were higher following the 2020
                                                                                                                                     Taiwan
                                                                                                                                                    downturn but the outlook is unclear
                   Travel retail                 4.2                  8.2                   +4.0              +94.1%

                   Total                         8.1                 13.1                   +5.0              +61.3%               Strategies for FY2021
 Note: KOSÉ and ALBION. Before applying Accounting Standard for Revenue Recognition for China online, offline and Travel retail.
                                                                                                                                                  More stores selling KOSÉ products (50 department stores,
    KOSÉ                                                                                                                                           about 11 stores on Hainan Island*note)
                                                                                                                                                    Note: Plan to open DECORTÉ stores in 2021
                              Travel retail is driving sales growth; sales at department
                                                                                                                                                  Effectively use live commerce (streaming video + e-
                               stores are increasing too                                                                             China
                 China                                                                                                                             commerce)
                              Online demand is smaller than planned but continues to
                               increase                                                                                                           50th anniversary events for DECORTÉ
                                                                                                                                                  SEKKISEI activities targeting younger people, primarily
                 South        Travel retail sector was weak in January-February but                                                               generation Z
                 Korea         profitability remained steady
                                                                                                                                    South
                                                                                                                                                  Increase ability to supply popular products
                              Sales were higher than one year earlier and higher than                                              Korea
             Taiwan
                               planned
                                                                                                                                                                                                                12
Net Sales by Region: North America, Europe, Others

  USA is recovering because of progress with vaccines
                                                                                       Market Trends
                                                          YoY change     YoY change
                         Adjusted FY2020   FY2021
  (billion yen)                                            (amount)        (ratio)
                                                                                                    The makeup market is recovering and the skin care
                                                                                          USA
                                                                                                     market is growing during the pandemic
            1Q                       8.5            7.1          (1.4)       (16.8)%
                                                                                                    Clean beauty and personalization remain key themes
                                                                                                    Only a limited economic downturn despite lockdowns
                                                                                        Europe
                                                                                                     and other measures involving the pandemic

    Tarte                                                                              Strategies for FY2021
                   Stores are resuming normal operations and e-commerce                           Using Kohl’s, Target and other stores to enlarge the sales
                    continues to grow                                                               network
        USA
                   Sales still weak at urban stores, where tourists are a large         USA       Strengthening the concealer, mascara and other key
                    share of sales                                                      (Tarte)     product categories
                                                                                                   Strengthening activities for Awake by tarte skin care
     Europe,                                                                                        products
      others
                   Lockdowns are delaying the opening of new stores
                                                                                                   Expand operations to new regions (Tarte)
                                                                                                   Plan to start selling products on Tmall International in
                                                                                       Europe,      August (Tarte)
                                                                                        others     To raise awareness of the DECORTÉ brand, “Kimono”
                                                                                                    promotions are launched in the fragrance market in
                                                                                                    Europe
                                                                                                                                                                 13
Balance Sheet Highlights

   Total assets remain at over ¥300 billion and equity ratio above 70%; inventories increase
                                          As of March 31, 2021              As of June 30, 2021            Change

    (billion yen)                        Amount             Share         Amount              Share        Amount

    Current assets                                205.0           66.5%            201.0           65.8%            (3.9)
         Cash and deposits                        103.3           33.5%            100.2           32.8%            (3.1)
         Accounts receivable                       39.4           12.8%             32.5           10.6%            (6.8)
         Inventories                               57.3           18.6%             61.4           20.1%            +4.1
    Non-current assets                            103.3           33.5%            104.6           34.2%            +1.2
         Property, plant and equipment             62.8           20.4%             61.9           20.3%            (0.9)
         Intangible assets                         14.1            4.6%             14.3            4.7%            +0.1
    Total assets                                  308.3          100.0%            305.6          100.0%            (2.6)

    Current liabilities                            61.6           20.0%             55.7           18.2%            (5.9)
         Accounts payable                          20.2            6.6%             25.7            8.4%            +5.5
         Short-term borrowings                      7.6            2.5%              4.1            1.3%            (3.5)
    Non-current liabilities                         5.4            1.8%              6.4            2.1%            +0.9
    Total liabilities                              67.0           21.8%             62.1           20.3%            (4.9)
    Total net assets                              241.2           78.2%            243.5           79.7%            +2.2
       Shareholders’ equity                       225.5           73.1%            227.8           74.5%            +2.3
       Non-controlling interests                   15.7            5.1%             15.7            5.1%            (0.0)
    Total liabilities and net assets              308.3          100.0%            305.6          100.0%            (2.6)
                                                                                                                            14
Cash Flow Highlights

   Overall cash flow remained stable despite a decrease of ¥3.1 billion in cash
                                                                 FY2020            FY2021
                                                                                                    Change
   (billion yen)                                                 Amount            Amount

      Profit before income taxes                                           +2.5             +3.6              +1.1
      Depreciation                                                         +2.3             +2.6              +0.2
      Decrease (increase) in trade receivables                             +3.9             +6.8              +2.8
      Decrease (increase) in inventories                                   (7.4)            (4.1)             +3.3
      Increase (decrease) in trade payables                                +5.0             +5.5              +0.5
      Others                                                              (15.1)            (9.7)             +5.3
   Cash flows from operating activities                                    (8.6)            +4.9             +13.5
      Capital expenditures                                                 +3.8             +1.1              (2.6)
   Cash flows from investing activities                                    (0.7)            (1.7)             (1.0)
      Funds procured from external sources and repayments                  +7.0             (3.5)            (10.5)
      Cash dividends paid                                                  (5.6)            (3.6)             +2.0
      Acquisition of stock                                                 (4.9)                -             +4.9
   Cash flows from financing activities                                    (3.7)            (7.1)             (3.3)
   Effect of exchange rate change on cash and cash equivalents             (1.2)            +0.7              +2.0
   Change in cash and cash equivalents                                    (14.2)            (3.1)            +11.1
   Cash and cash equivalents at beginning of period                        70.2             80.0              +9.7
   Cash and cash equivalents at end of the quarterly period                56.0             76.9             +20.8
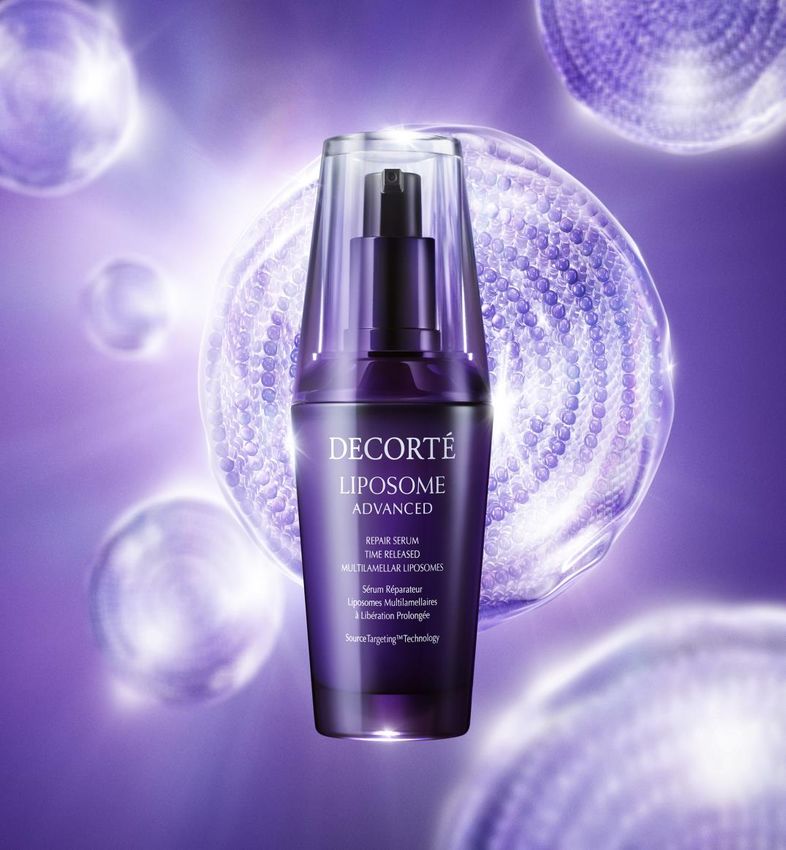
                                                                                                                      15
Activities in the Second Quarter and Afterward (1) DECORTÉ

                                                                            ◆First update of LIPOSOME since its launch 29 years ago
                                                                                • Online announcement for cosmetics retailers, journalists and others
                                                                                June 2021 on YouTube
                                                                                *Recorded the highest viewership ever for a DECORTÉ announcement
                                                                                • Start of sales
                                                                                 Sales of the revised LIPOSOME products will begin in September 2021
                                                                                    in Japan and in January 2022 worldwide.
                                                                                    2022 will be a year for making the LIPOSOME brand even stronger for
                                                                                    rapid growth of sales worldwide.

                                                                            ◆The first EC website for DECORTÉ
                                                                                • DECORTÉ online boutique (official web shop)
                                                                                 The DECORTÉ website will sell all DECORTÉ products. Trial operation is
                                                                                   scheduled to begin in September 2021.

                                                                            ◆A new channel for counseling

                                                                                ・DECORTÉ Personal Beauty Concierge
                                                                                 Plan to start providing online counseling by dedicated beauty
   LIPOSOME ADVANCED REPAIR SERUM is formulated as an aging care beauty serum      consultants via the specialized platform on September 16, 2021
                                                                                                                                                           16
Activities in the Second Quarter and Afterward (2) Tarte, SUNCUT

   Promotions on China’s big three SNS to prepare for                     Speeding up activities for worldwide sales of SUNCUT
    Tmall International launch                                              products
                                                                                                               • Cai Xukun, a well-known
                                   • Tarte plans to start selling products                                       Chinese singer, dancer and
                                     in China through Tmall International,                                       actor, will continue to be
                                     the company’s first use of a cross-                                         the global ambassador for
                                     border e-commerce sales channel.                                            SUNCUT.

                                   • Tarte has started distributing                                            • More activities for raising
                                     information on China’s big three SNS                                        awareness in many
                                     to prepare for the August start of                                          countries of the SUNCUT
                                     sales.                                                                      brand for sunscreen
                                                                                                                 products.

    Tarte starts selling products at Sephora stores in
                                                                             Participation in the China Beauty Expo 2021
     Canada and Italy
                                                                                                               • The 26th China Beauty Expo
                                   • Sales of Shape Tape Concealer                                               was held in Shanghai from
                                     started at Canada Sephora stores in                                         May 12 to 14.
                                     May.
                                                                                                               • For establishing globally
                                   • Sales of Tarte products started at                                          recognized brands, KOSÉ
                                     Italy Sephora stores in May.                                                displayed SUNCUT products
                                                                                                                 as well as skin care and hair
                                                                                                                 care products.
                                                                                                                                                 17
Activities in the Second Quarter and Afterward (3) Sustainability Activities

 Manufacturing and services centered on “adaptability”                           Use the theme of beauty to help solve environmental issues
                                                                                    The SEKKISEI “SAVE the BLUE” Project

 Use the perspective of “adaptability” for developing all products, using                                              This project, which started in
 products and experiences for the creation of value.                                                                   2009, uses a portion of sales of
 Announce information about activities concerning the three perspectives of                                            SEKKISEI products to fund
 adaptability: Physical, Mind and Social Attributes at the KOSÉ Sustainability                                         donations for the preservation of
 Website.                                                                                                              coral in Okinawa.

                                                                                    ◆ Sustainability-conscious design
                                                                                    ALBION will use a pulp container for ALBION PRIMP POWDERLESST
                                                                                    powder foundation, a new product to be introduced in August 2021.
                                                                                    Activities to develop safe and environmentally responsible containers
                                                                                    are continuing.

                                                                                                                                                            18
Supplementary Information

                            19
Cost of Sales and SG&A Expenses

                                                                        1Q

                                                 Adjusted FY2020                   FY2021
                                                                                                             Change           Change
                                                               Ratio to net                   Ratio to net   amount            ratio
                                               Amount                         Amount
    (billion yen)                                                 sales                          sales

    Cost of sales                                       16.1        28.3%              16.0        27.4%              (0.0)      (0.6)%

    SG&A expenses
                                                        39.9        69.8%              39.2        66.7%              (0.7)      (1.8)%
         
                             Sales promotion             9.4        16.5%               9.3        15.9%              (0.1)      (1.1)%

         Selling expenses    Advertising                 3.1          5.4%              3.8         6.5%              +0.7      +23.6%
                             Freightage and
                                                         3.1          5.5%              3.8         6.5%              +0.6      +20.2%
                             packing

                          Subtotal                      15.6        27.4%              16.9        28.9%              +1.2       +8.1%

                             Personnel                  14.8        25.9%              13.4        22.9%              (1.3)      (9.4)%

         General and         Others                      6.9        12.1%               6.3        10.8%              (0.5)      (8.5)%
         administrative
         expenses            R&D                         1.3          2.4%              1.3         2.3%              (0.0)      (1.7)%

                             Depreciation                1.0          1.9%              1.1         1.9%              +0.0       +2.7%

                          Subtotal                      24.2        42.4%              22.2        37.9%              (1.9)      (8.2)%

                                                                                                                                          20
Sales Growth by Business Segment

                                                FY2020                                                                                    FY2021

        YoY changes in sales, %   1Q            2Q            3Q                     4Q                      1Q-4Q                           1Q

    Consolidated sales *note           (26.5)        (21.1)         (5.6)                   (4.4)                   (14.7)                          +2.7

       Cosmetics *note                 (25.4)        (21.8)         (0.8)                   (3.1)                   (13.3)                          +5.1

          High prestige                 (22)          (19)            +1                       +1                      (10)                          +11

              DECORTÉ                   (10)            (5)          +21                     +39                       +10                           +20

              ALBION                    (34)          (24)            (7)                     (6)                      (19)                          +16

              Tarte                     (17)          (36)          (16)                     (42)                      (29)                          (17)

          Prestige                      (38)          (34)            (8)                    (21)                      (26)                            +6

       Cosmetaries *note               (29.7)        (17.9)        (22.3)                   (6.7)                   (18.7)                          (5.8)

            COSMEPORT                   (32)          (19)          (22)                      ±0                       (17)                            +4

            Other                       (26)          (17)          (23)                     (19)                      (21)                          (15)
                                                                            Note: Figures are after applying the Accounting Standard for Revenue Recognition.
                                                                                                                                                                21
E-commerce/Travel retail Sales

 ■E-commerce

                           Japan                         China                  Other Asian countries                 North America, others                          Total
                                                                                                                                                                                           YoY
                                       YoY                           YoY                               YoY                                    YoY                                        change
                  2020     2021                 2020     2021                2020          2021                     2020        2021                          2020           2021
  (billion yen)                      change                        change                            change                                 change

       1Q            2.1       1.5    (26.6)%      2.9       3.1     +8.4%       0.1          0.1      +76.3%           1.4          1.8     +24.9%                 6.5            6.6     +0.8%

 ■Travel retail

                           Japan                         China                         South Korea                    Other Asian countries                         Total
                                                                                                                                                                                           YoY
                                       YoY                           YoY                               YoY                                   YoY                                         change
                  2020     2021                 2020     2021                2020         2021                     2020         2021                         2020           2021
 (billion yen)                       change                        change                            change                                change

     1Q              0.1      0.1    (13.5)%       4.2      8.2    +94.1%       6.4          4.4      (30.7)%          0.1          0.1     (35.1)%             11.0          12.9       +17.5%

                                                                              Note: The Accounting Standard for Revenue Recognition is not used because this information is solely for reference.
                                                                                                                                                                                                    22
FY2021 Outlook (No change from the initial forecast)
                                                          FY03/2021                              Adjusted FY2020                               FY12/2021                              Adjusted                 Adjusted
                                                                                                                                                                                    comparisons              comparisons
                                                    Amount               Ratio to net          Amount               Ratio to net         Amount               Ratio to net               *note                  *note
   (billion yen)                                  (billion yen)             sales            (billion yen)             sales           (billion yen)             sales               (billion yen)              (ratio)
   Net sales                                                 279.3           100.0%                     213.4           100.0%                    238.0           100.0%                       +24.5             +11.5%
       Cosmetics                                             218.4            78.2%                     173.2            81.2%                    196.7            82.6%                       +23.4             +13.5%
       Cosmetaries                                                58.4        20.9%                          38.2        17.9%                         39.5        16.6%                         +1.2             +3.4%
       Other                                                       2.4          0.9%                          1.9          0.9%                         1.8          0.8%                       (0.1)             (8.0)%
   Operating profit                                               13.2          4.8%                         16.5          7.8%                        20.0          8.4%                        +3.4            +20.8%
   Ordinary profit                                                18.7          6.7%                         19.0          8.9%                        20.5          8.6%                        +1.4             +7.4%
   Profit attributable to owners of
                                                                  11.9          4.3%                         13.9          6.6%                        14.2          6.0%                        +0.2             +1.5%
   parent
   Net income per share                                   210.11 yen                                          -                                248.92 yen
   ROA                                                                          4.5%                          -                                                      6.8%           Foreign exchange rate (yen)
                                                                                                                                                                                   Currency      Actual       Estimate
   ROE                                                                          5.3%                          -                                                      6.5%
   3
                                                                                                                                                                                  US Dollar          106.8      103.0
   Capital expenditures                                                         10.1                          -                                                      15.4       Chinese yuan          15.5       15.5
   Depreciation                                                                 10.3                          -                                                        8.7      Korean won            0.09       0.09
                                                                             Note: Adjusted comparisons are the changes between FY03/2021 results of operations for consolidated subsidiaries with a March year end
                                                                                   that have been adjusted for the 2020 calendar year (January-December 2020) and the forecast for FY12/2021.
           Area                 Initial outlook
                                                           Expect a gradual recovery from the first half of the year, despite the decline in consumer awareness due to the refrain from going out due to
          Japan            Mid-single-digit increase
                                                           the COVID-19 disaster, but we expect a full-scale recovery from the second half.
          China                       +20%                 Continued high growth in all channels. Existing store growth and new stores are expected to drive earnings.
       South Korea                    +10%                 Ongoing travel restrictions due to COVID-19. Although there is a relationship with the China TR, expect an increase of about 10% in 2021.
                                                           Although the pace of the spread of the COVID-19 infection is slowing down, the situation remains severe. Expect growth through expanded
   Europe & USA (Tarte)    Mid-single-digit increase
                                                           distribution in the U.S. and new Sephora stores in Europe.
                                                                                                                                                                                                                           23
New Products and Promotional Activities in the Second Quarter of FY2021 and Afterward

                                                                                                August 2021
                                                       August 2021
                                                                                                   ALBION
                                                         DECORTÉ
                                                                                        Launch of PRIMP POWDERLESST
                                            Launch of ROUGE DECORTÉ (51 colors)                   (foundation)

                                                                                                     September 2021
                                                       August 2021
                                                                                                        Carté HD
                                                      ONE BY KOSE
                                                                                                 Launch of three products
                                               Launch of THE WATER MATE                      including all-in-one beauty serum
                                                 moisture-retention lotion

                                                                                                                                 24
These materials include estimates on the basis of the outlook on the future and plans as of
July 30, 2021, but are not promises by KOSÉ Corporation regarding future performance.
Actual results may differ from these forecasts due to risks associated with economic trends and
other items as well as to other uncertainties. KOSÉ Corporation accepts no responsibility
whatsoever with regard to any possible mistakes, missing information and other errors in the
data and text in these materials.

These materials were prepared for the purpose of providing information concerning the
finances, management strategies and other aspects of KOSÉ Corporation to assist in making
investment decisions. This is not a solicitation to purchase securities issued by KOSÉ
Corporation.
Investors are cautioned not to rely solely on these materials when making investment decisions.
Investors are asked to reach their own decisions regarding investments.

KOSÉ Corporation assumes no responsibility whatsoever for problems, losses and damages of
any type resulting from the use of these materials.

                                                                                                  25
You can also read