MACQUARIE CONFERENCE Wednesday 1 May, 2019 - AWS
←
→
Page content transcription
If your browser does not render page correctly, please read the page content below
MACQUARIE CONFERENCE Wednesday 1 May, 2019

WHAT DOES VISTA GROUP DO?

THE GLOBAL LEADER IN SOFTWARE
AND DATA SOLUTIONS FOR THE FILM
INDUSTRY.
•   Industry Backdrop
•   Vista Group
•   2018 Financial Highlights
•   Vista Cinema
•   Movio
•   Questions

                                3
INDUSTRY BACKDROP

                    4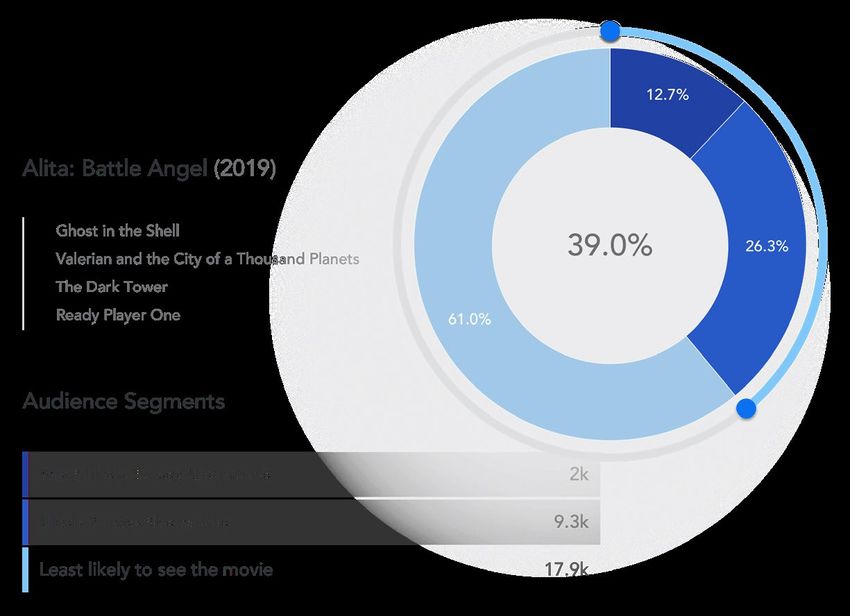
GLOBAL BOX OFFICE

                                      All Films (US Billions)
$45
                                                                                $40.6          $41.1
$40                                        $38.4             $38.8
          $35.9              $36.4
$35

$30

                                                                                 29.5           29.2
$25                                            27.3              27.4
              25.0            26.0
$20

$15

$10

$5            10.9            10.4             11.1              11.4            11.1           11.9

$0
              2013           2014              2015              2016            2017          2018

                                                 International
                                                                                   % Change      % Change    COURTESY OF THE MOTION PICTURES
                     2013     2014      2015          2016   2017       2018       18 vs. 17     18 vs. 14       ASSOCIATION OF AMERICA
 U.S./Canada         $10.9    $10.4    $11.1      $11.4      $11.1      $11.9           7%             15%

 International       $25.0    $26.0    $27.3      $27.4      $29.5      $29.2           -1%            12%

      Total          $35.9    $36.4    $38.4      $38.8      $40.6      $41.1           1%             13%
                                                                                                                                               5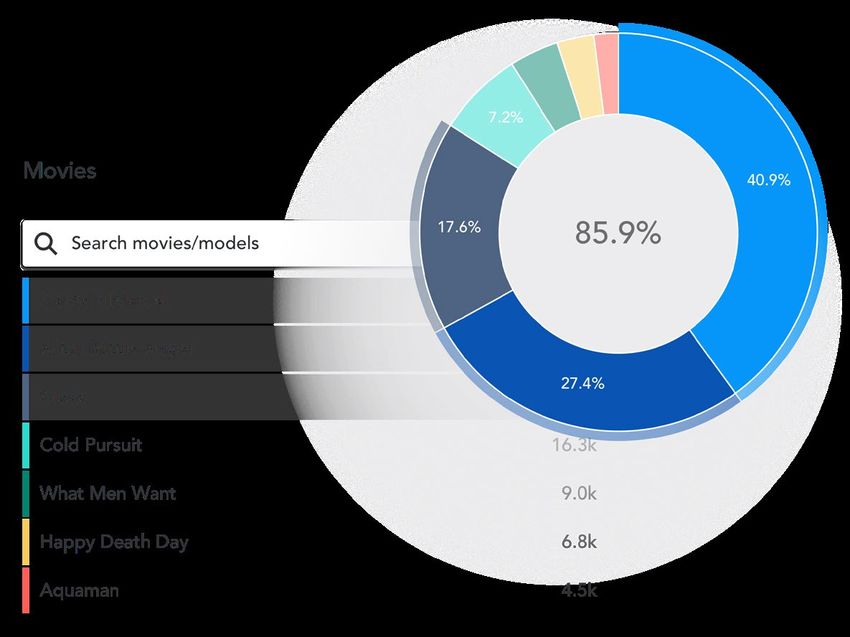
CINEMA SCREEN GROWTH

                        Cinema Screen Growth
200,000

180,000

160,000

140,000

120,000

100,000

 80,000

 60,000

 40,000

 20,000

     0
          2012   2013      2014    2015    2016   2017   2018

                                                                COURTESY OF THE MOTION PICTURES
                                                                    ASSOCIATION OF AMERICA

                                                                                                  6
VISTA GROUP

              7
VISTA GROUP COMPANIES WITHIN THE FILM INDUSTRY VALUE CHAIN
PRODUCTION            DISTRIBUTION               CINEMA EXHIBITION        MOVIEGOER
2018 FINANCIAL HIGHLIGHTS

                            9
2018 FINANCIAL HIGHLIGHTS

TOTAL REVENUE                                                RECURRING REVENUE                                                         OPERATING PROFIT

$130.7m                                                      $79.9m                                                                    $24.7m
(up 23%)                                                     (up 24%)                                                                  (up 21%)

EBITDA1                                                      OPERATING CASHFLOW                                                        FINAL DIVIDEND

$29.2m                                                       $27.6m                                                                    2.10
(up 17%)                                                     (up 150%)                                                                 CENTS P/SHARE

                                                                                                                                       (Total FY18 dividend up 27%)

                1EBITDA is a Non-GAAP measure and is defined as earnings before net finance expense, income tax, depreciation, amortisation, acquisition costs and equity-accounted

                results from associate companies. Expenses related to the VCL deferred consideration is also excluded. This is consistent with the measure used in the Prospectus
                dated 3 July 2014. Depreciation and amortisation in 2018 $4.2m (2017: $3.6m).
OPERATING SEGMENTS
2018
Additional Group Early Stage
NZ$M Vista Cinema Movio Corporate Total
Companies Investments
Revenue 82.4 22.8 15.0 4.5 5.9 130.7
EBITDA1 25.6 6.2 1.4 0.4 (4.5) 29.2
EBITDA % of revenue 31% 27% 9% 10% (76%) 22%
2017
Additional Group Early Stage
NZ$M Vista Cinema Movio Corporate Total
Companies Investments
Revenue 67.6 15.5 12.3 1.2 10.0 106.6
EBITDA1 19.8 3.6 0.6 (1.8) 2.7 25.0
EBITDA % of revenue 29% 23% 5% (150%) 27% 23%
Note: EBITDA1 is a Non-GAAP measure and is defined as earnings before net finance expense, income tax, depreciation, amortisation, acquisition costs and equity-accounted results from associate companies.
Expenses related to the VCL deferred consideration is also excluded. This is consistent with the measure used in the Prospectus dated 3 July 2014. Depreciation and amortisation in 2018 $4.2m (2017: $3.6m).
11KEY FOCUS - SUPER-CIRCUITS
CUSTOMER ACTIVITY IN 2018 / 2019
AMC / Odeon Signed for Vista Cinema and Movio for Odeon
Cineworld Signed extension for all sites for 5 years
Cinepolis Signed enterprise pricing agreement
Cinemex Signed USA circuit (ex-Cobb)
CJ CGV Signed for Vista Cinema in Russia JV
Cineplex Entertainment
Cinemark Signed for Movio across all Latam countries
Dadi Media Rolled out additional 90 sites for Vista Cinema
Pathe Signed for Vista Cinema for Pathe France
Vue Cinemas Completed implementation in Italy
12VISTA CINEMA
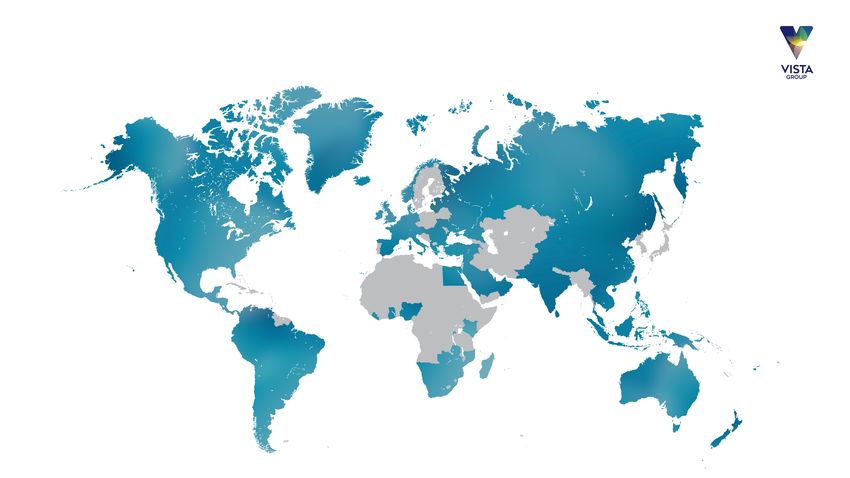
13Vista World Share
Vista Cinema percentage of the world market – for cinema exhibition companies with 20+ screens
85% CANADA
2,082/2,446 screens 29% EUROPE
6,014/20,497 screens
22% ASIA
48% USA 10,358/46,339 screens
16,505/34,230 screens
58% MIDDLE EAST
1,661/2,886 screens
98% CENTRAL AMERICA
7,217/7,387 screens
96% AFRICA 97% AUSTRALASIA
821/854 screens 1,849/1,910 screens
38% SOUTH AMERICA
2,433/6,378 screens
40% WORLD WIDE
48,940/122,927 screens
48% excluding China
14VISTA CINEMA
Vista Cinema provides cinema management software to the world’s largest
cinema exhibitors
• 1013 new sites in 2018 (including 199 sites in China).
• Total now 7,202. Total in China now 958.
• Vista Cinema now has customers in 97 countries.
• Market share globally of 20+ screen segment at 40%.
• Excluding China - market share of 20+ screen segment is 48.1%.
• First cloud deployed customers live and in production.
• Additional revenue stream from 3rd parties approaching $3.5m.
NEW SITES ADDED TOTAL SITE COUNT
1,200 8,000
900 6,000
600 4,000
300 2,000
13% 31%
GROWTH IN TOTAL EBITDA%
SITES TO 7,202 (UP BY 6%) '- 0
2013 2014 2015 2016 2017 2018 2013 2014 2015 2016 2017 2018
existing customers new customers acquisitions
15VISTA CINEMA – PRODUCT MODEL
16VEEZI
Provides cinema management software to the world’s independent cinema
exhibitors
• 258 new sites bring total site numbers to 901 – including China.
• China now with 93 sites, an increase of 72 over 2017.
• 14% increase in revenue per site compared to 2017.
• USA continues to be strongest market for Veezi with over 500 sites.
• Veezi now present in 36 countries.
VEEZI – TOTAL SITE COUNT AVERAGE REVENUE PER MONTH
1,000 750
14% 56%
INCREASE IN SITE REVENUE 600
REVENUE TO GROWTH 750
$588 P.MTH
450
500
300
59% 40% 250
150
INCREASE GROWTH IN
IN ARR TO CONTRACTED
0 0
$6.35M SITES TO 901
2013 2014 2015 2016 2017 2018 2013 2014 2015 2016 2017 2018
17ADDITIONAL GROUP COMPANIES SEGMENT
$15M $1.4M
REVENUE EBITDA
GROWTH +22% GROWTH +123%
World leading film marketing products Provides world leading theatrical distribution Movie and cinema review and showtime guide
• Excellent revenue growth (52%) delivered software • Unique visitors up 24% to 8.2m across
strong EBITDA • Pleasing improvement 2nd half over New Zealand and Australia
• Created 31% more movie destination sites 1st half – though full year result still • 2nd half 44% ahead of 1st half as impact of
(1,750) in 2018 not acceptable marketing spend and deployment of sales
• LA Studio well established – 12 people – • Stronger delivery performance enables resource in Sydney felt
Powster Labs offer to studios generating focus on new business with 3 new customer • 140% increase in advertising revenue in
good interest wins in 2nd half Australia
• Promising early signs with products on • Joined up customer propositions with • Extending the lead as the largest
Facebook Messenger – very good user Numero under development independent movie site in Australasia.
engagement, strong pipeline of prospects. • 6,000+ cinema sites delivering weekly
audited box office results to MACCSBox.
18EARLY STAGE INVESTMENTS SEGMENT
$4.5M $0.4M
REVENUE EBITDA
GROWTH +285% +$2.2M
Software to optimise film forecasting and A platform to share film digital assets & enable Social app to share video reaction to movies
scheduling new cinema ticketing sales channels to access and TV shows
• Excellent revenue growth (80%) reduces cinema exhibitors • Additional external investment moves
EBITDA loss close to break even for full year • MX Film good progress – servicing 8,000+ Stardust to Associate company status in
• Penetration of Vista customer base at 6% - screens with content – and integrating with 2019
big runway ahead group companies to deliver consistent film • 2nd half 2018 focus was to enhance app to
• Key integrations with Vista products in beta – database increase user engagement and retention
with Film Manager, and with MovieTeam • MX Tickets travelling steadily – boosted mid- • 1st half 2019 will see relaunch and
• Starting 2019 with pilots in 2 significant Vista year by one-off volume spike – now servicing marketing push
customers in APAC. 10 live ticketing partners worldwide • Positive signs of studio interest in quality
• MX collecting showtimes from key large and of users on Stardust.
small customers – millions of showtimes each
month.
19ASSOCIATE COMPANIES
Performance
• Revenue of $NZD20.6m, 19% increase over 2017.
• 199 new sites added – 41% from existing customers. Total now 958 sites.
• Vista China market share of 20+ screens segment estimated as 17%.
• Top 5 circuit Stellar now rolling out – Vista China will have 3 of the top 5 circuits as customers when rollout is complete.
• Total of 93 Veezi sites, 72 added in 2018.
• Impressive local product add-ons built by Vista China team – Wechat mini-programs, 3rd party integration products.
China film industry
• China box office revenue in 2018 grew 9% over 2017 – adding RMB5billion of ticket sales. Local productions accounted
for 61% of the box office.
• Government has proposed a funding plan to expand cinema building in tier 3 and 4 cities – in particular in the west of China.
• Continued domination by 3rd party ticket sellers – Maoyan and Tao Piaopiao remain the top 2.
• Cinema building continues apace in China – 18% increase in 2018.
Update on structure
• The transaction to acquire 7.9% of Vista China was completed in August – Vista Group and Weying now each hold 47.5%,
and staff the remaining 5%.
• As previously announced additional transactions are contemplated which will lead to Vista Group being able to consolidate.
• We will update on the status of these transactions during the first half of 2019.
20GROWTH FOCUS
New customers / Cloud / New products
new geographies Managed services
Scale smaller Integrated Group Continue focus
companies Agreements on super-circuits
21Macquarie Conference MAY 2019
ARTIFICIAL
INTELLIGENCE
Movie Insights

           • Most Likely   5x more likely

           • Likely        3 – 5x more likely

           • Less Likely   1 – 3x more likely

           • Unlikely      less than 1x likely
Audience Insights
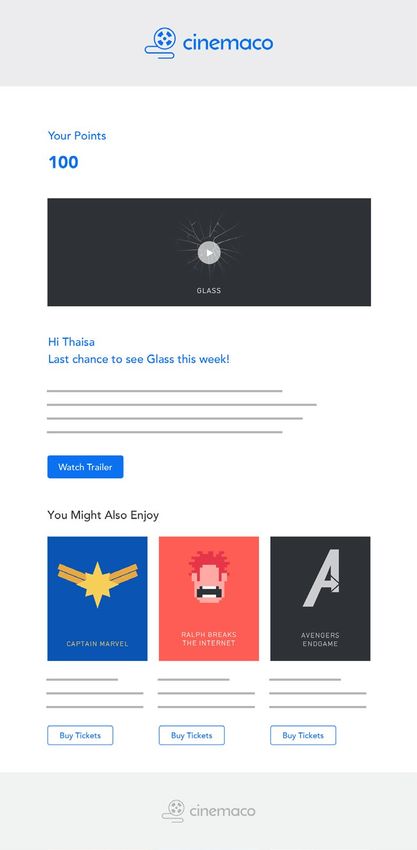
OMNI-CHANNEL
Advanced Personalisation
Omni-Channel Dynamic Content
Global
R E S U LT S
V I S I T & R E V E N U E U P L I F T: O v e r v i e w

Purpose                                    Process

To definitively calculate the admissions   • Built a model to stratify contactable members by similar
and revenue uplift generated by using        behavior and remove bias – the only difference between them
Movio Cinema                                 was whether they had been contacted using Movio Cinema or not

                                           • Calculated uplift in admissions and revenue attributed
                                             solely to Movio Cinema campaigns

                                           • Work endorsed by Prof. Donald B. Rubin,
                                             Emeritus Professor of Statistics, Harvard University
Visit & revenue uplift
Uplift * Global Uplift * Global
Visit uplift Total box office
per moviegoer
0.89 revenue per exhibitor
$12.1M
Admission uplift Total box office
per moviegoer
1.96 globally
$227M
Box office revenue Total box office and
uplift per moviegoer
$16.61 concession uplift
$324.8M
* Per year in USD$21.37*
Return for every $1 spent on
Movio
* USDS e r v i c e a b l e O B TA I N A B L E MARKET
S e r v i c e a b le O bta i n a b l e M a r ke t ( S O M ) fo r
            Movio Media Digital
                                                                                                                              2019       2021        2023

            Average marketing spend per release in North America ¹                                                           $28.5M     $29.7M      $30.8M

            Wide release films estimate – 12 per month                                                                         144        144         144
            Portion of film marketing budgets spent on digital marketing,
            increasing 15% annually 2                                                                                         14.0%      18.5%       24.5%

            Estimate of North American film industry digital marketing spend                                                 $575M      $790M       $1.0M

            Estimate of Global film industry digital marketing spend                                                          $2.0M     $2.7M       $3.8M

            Movio Media’s serviceable obtainable market ³                                                                    $69-86M   $133-167M   $234-293M

            1 Neustar December 2018 White Paper: Do Movie Marketing Budgets Need a Digital Reboot? Adjusted for inflation.
            2 Management estimate: Rest of World marketing spend scales in line with BO revenue, 251% of NA spend.
            3 Management estimate: Movio Media’s current SOM is 12 - 15% of TAM.

Quoted in USD
QUESTIONS?
IMPORTANT NOTICE

This presentation has been prepared by Vista Group International Limited (“Vista Group”).
Information in this presentation:
•    is provided for general information purposes only, does not purport to be complete or comprehensive, and is not an offer or invitation for
     subscription or purchase of, or solicitation of an offer to buy or subscribe for, financial products in Vista Group or any of its related
     companies;
•    does not constitute a recommendation or investment or any other type of advice, and may not be relied upon in connection with any
     purchase or sale of financial products in Vista Group or any of its related companies;
•    should be read in conjunction with, and is subject to, Vista Group’s financial statements, market releases and information available on
     Vista Group’s website (www.vistagroup.co.nz) and on NZX Limited’s website (www.nzx.com) under ticker code VGL;
•    may include projections or forward looking statements about Vista Group and its related companies and the environments in
     which they operate. Such forward-looking statements are based on significant assumptions and subjective judgements which are
     inherently subject to risks, uncertainties and contingencies outside of Vista Group’s control. Although Vista Group’s management may
     indicate and believe the assumptions underlying the forward looking statements are reasonable, any assumptions could prove inaccurate
     or incorrect and, therefore, there can be no assurance that the results contemplated in the forward looking statements will be
     realised. Vista Group’s actual results or performance may differ materially from any such forward looking statements; and
•    may include statements relating to the past performance of Vista Group and/or its related companies, which are not, and should not be
     regarded as, a reliable indicator of future performance.
While all reasonable care has been taken in compiling this presentation, Vista Group and its related companies, and their respective directors,
employees, agents and advisers accept no responsibility for any errors or omissions. None of Vista Group or its related companies, or
any of their respective directors, employees, agents or advisers makes any representation or warranty, express or implied, as to the accuracy
or completeness of the information in this presentation or as to the existence, substance or materiality of any information omitted from this
presentation.
Unless otherwise stated, all information in this presentation is expressed at the date of this presentation and all currency amounts are in NZ
dollars.
You can also read