Fiji Climate Summary - Fiji Meteorological Service
←
→
Page content transcription
If your browser does not render page correctly, please read the page content below
FIJI
METEOROLOGICAL
    SERVICE
      Private Mail Bag (NAP0351)
        Nadi Airport, Fiji
                                   Fiji Climate Summary                                           ISO 9001:2015
                                                                                                 certified Climate
                                                                                                      Services
        Ph: +679 6724888
        Fax: +679 6724050
     Email: climate@met.gov.fj
                                               January 2021
          Also online at:
      http://www.met.gov.fj

Issued: February 5, 2021
Next Issue: March 5, 2021                         Since : August 1980*                                Volume 42 : Issue 01

1.        IN BRIEF
A moderate strength La Niña event continued in the Pacif-       western Viti Levu. The highest 24-hour rainfall was record-
ic Ocean during January 2021. The South Pacific Conver-         ed at Dreketilailai with 392mm on the 31st. Consequently
gence Zone (SPCZ) was displaced south of its normal posi-       severe flooding were registered, especially in the Central
tion, closer and over the Fiji Group during the month. Con-     and Northern Divisions. Labasa recorded its worst flood
sequently, most parts of the country experienced wetter         since the flood associated with severe tropical cyclone Ami
than usual month.                                               in 2003.

Northern Viti Levu, stretching from Tavua to Dobuilevu,         An active convergence zone resulted in widespread rainfall
Seaqaqa and Lakeba recorded more than twice the normal          across the country on the 28th and 29th. Rainfall over the
monthly rainfall. Furthermore, Nadarivatu recorded an           Western Division in particular was heavy. The highest rain-
enormous 2160mm of rainfall during the month, with              fall during this event was recorded at Nadarivatu with a 24-
Monasavu, Seaqaqa, Penang Mill, and Ellington (Ra) re-          hour rainfall of 506mm on the 28th and with a 48-hour rain-
cording around 1000mm of total monthly rainfall.                fall of 942mm between 28th and 29th. All the major towns
                                                                from Rakiraki to Nadi were inundated with flood waters on
Tropical cyclone Ana was the major highlight of the             the 29th.
month. It made a landfall near Ra as a Category 2 system
on the 31st and then bisected through Viti Levu exiting near    Apart from rainfall, occasionally very warm and humid
Navua. It continued its journey south making a landfall         conditions were experienced over the country due to nor-
over eastern half of Kadavu at the same intensity. Most of      therly wind flow, especially from around 10th to the 21st.
the destructive winds around Ana were packed to the north       The highest maximum air temperature during the month
and east of its centre. Consequently, gale to storm force       was registered at Lomaivuna with 36.1°C on the 20th.
winds were recorded over Viti Levu, Kadvu, Lomaiviti
Group and as far as Vanua Levu. The highest recorded            Damaging heavy swells were experienced on the south-
wind was registered at Ellington, Ra with sustained wind        western parts of the country during the month due to an
of 96km/hr and gust of 134km/hr. Ana also resulted in           intense high pressure system to far southwest of the Fiji
very significant rainfall over the country, especially over     Group. There were reports of sea water crashing on the
the Northern and Central Divisions, and as well as north-       Queens Road at Vatukarasa, Nadaroga on the 22nd.

2.        WEATHER PATTERNS
Series of troughs of low pressure systems and moist nor-        and a northeasterly wind flow dominated the Group. A
therly wind flow dominated the Group. Meanwhile, the            ridge of high pressure gradually pushed in over the Group
highlight of the month was the development and devasta-         from the southeast and this directed northeast to northerly
tion brought by tropical cyclone Ana.                           wind flow over the Group till the 20th.

The month began with a weak trough of low pressure over      On the 21st, the trough gradually drifted north again just to
the Group. The trough then drifted just to the south of the  the southwest of Fiji and by the 24th it was over the Group.
Group on the 3rd which directed a moist north to northwest-  The trough intensified and remained active over the Group
erly wind flow over the country. Occasional rain with iso-   till the end of the month as series of embedded low-
lated heavy falls were experienced over most parts of the    pressure systems developed along the trough and affected
country.                                                     Fiji including tropical cyclone Ana. Tropical cyclone Ana
                                                             affected Fiji on the 30th and 31st with prolonged heavy rain,
The trough lingered over the southern parts of the Group severe flooding of rivers, and damaging and destructive
till the 5th, then gradually drifted north and affected the winds.
northern parts of the country till the 7th. The trough then
gradually drifted south again over the southern parts of the Rotuma was mainly affected by series of troughs of low
country and again directed a northerly wind flow over the pressure which brought about occasional rain and thunder-
Group till the 9th. During this period isolated heavy falls storms over the island during the month.
were experienced over parts of the country.

The trough then drifted further southwest of Fiji on the 10th
*Previously known as the Fiji Islands Weather Summary and Monthly Weather Summary                                         1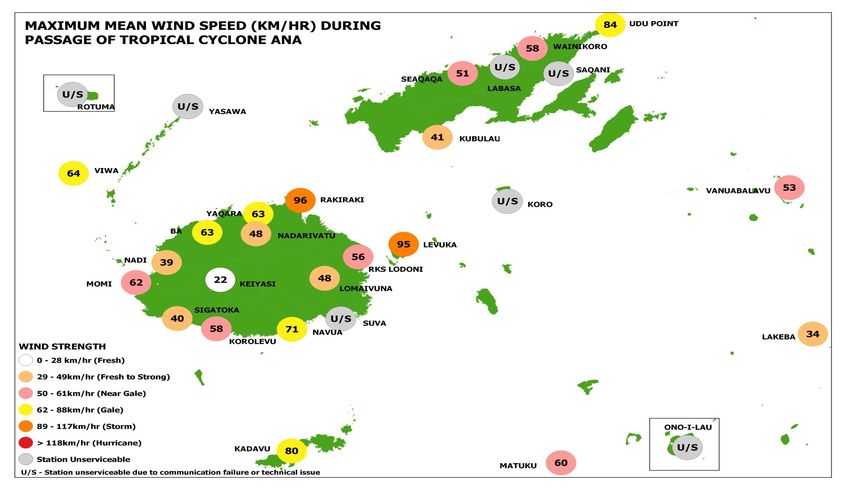
Fiji Climate Summary - January 2021                                                                               Volume 42 : Issue 01

3.          RAINFALL
The major southward shift of the South Pacific Convergence    of Viti Levu. Dreketilailai registered 392mm of rainfall
Zone (SPCZ), together with the passage of tropical cyclone    over a 24-hour period on the 31st, with 352mm a day earli-
Ana through the Fiji Group resulted in the above average to   er. Some of the other significant 24-hour rainfall during
well above average rainfall at majority of the stations.      this event was at Nadarivatu with 352mm, Seaqaqa with
Northern Viti Levu, stretching from Tavua to Dobuilevu,       350mm, Qawa with 300mm and Penang Mill with
Seaqaqa and Lakeba recorded more than twice the normal        287mm, all on the 30th. Over 48-hour period from 9am on
monthly rainfall. High intensity rainfall resulted in two ma- the January 30th to 9am on the February 1st, Dreketilailai
jor flooding events during the month. Overall, out of the 23  received 744mm of rainfall, followed by Nadarivatu with
rainfall stations, 6 stations received well above average rain-
                                                              563mm, Qawa with 542mm, Nayarabale with 519mm and
fall, 14 above average, while 3 stations registered near aver-Seaqaqa with 511mm. This led to widespread flooding on
age rainfall (Table 2, Figures 1-5).                          Vanua Levu, with the Labasa town inundated with flood
                                                              waters. Widespread flooding was also reported on eastern
Two major rainfall producing systems affected the Fiji half of Viti Levu.
Group during the last week of the month. An active conver-
gence zone on the 28th and 29th resulted in very heavy rain- The highest total monthly rainfall was recorded at Nada-
fall, especially over the Western Division and interior of rivatu with 2160mm, followed by Monasavu with
Viti Levu. During this rainfall episode, Nadarivatu recorded 1038mm, Seaqaqa with 1019mm, Penang Mill with
506mm of rainfall over a 24-hour period on the 28th, fol- 1008mm, and Ellington (Ra) with 991mm. On the other
lowed by 436mm a day later. Some of the other significant hand, the lowest total monthly rainfall was registered at
24-hour rainfall during this event was at Vatukacevaceva Vanuabalavu with 224mm, followed by Sigatoka with
with 330mm on the 28th, followed by Navala with 282mm 260mm, Ono-i-Lau with 295mm, Yasawa-i-Rara with
on the 29th and Bukuya with 245mm on the 29th. Over 48- 343mm and Korolevu with 349mm.
hour period from 9am on the 28th to 9am on the 30th, Nada-
rivatu registered 942mm, followed by Navala with 503mm,
Vatukacevaceva with 479mm, Toge with 430mm and Ono-i-Lau recorded the highest number of rain days
Nanoko with 426mm. This led to widespread flooding in the (rainfall ≥0.1mm) during the month with 27 days, fol-
Western Division, with all the towns from Rakiraki to Nadi lowed by Yasawa-i-Rara and Korolevu with both 26, and
inundated with flood waters.                                  RKS (Lodoni), Nacocolevu (Sigatoka), Viwa and Matuku
                                                              with all 25. On the other hand, Saqani experienced least
The second heavy rainfall on the 30th and 31st was associat- number of rain days with 15, followed by Vaturekuka
ed with tropical cyclone Ana. During this event, the rainfall (Labasa), Nadarivatu and Monasavu with all 18, and
was intense in particular over Vanua Levu and eastern half Seaqaqa with 19.

                Figure 1

Normal: Long term average from 1981 to 2010                   Average: Rainfall between 80 to 119%
Well Below Average: Rainfall less than 40% of normal          Above Average: Rainfall between 120 to 199%
Below Average: Rainfall between 40 to 79%                     Well Above Average: Rainfall greater than or equal to 200% of normal
Rain Day: Rainfall ≥ 0.1mm

                                                                                                                                     2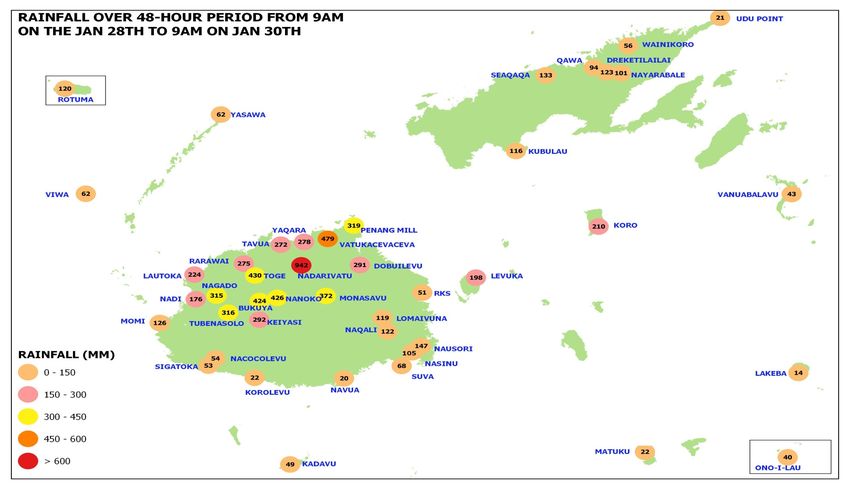
Fiji Climate Summary - January 2021                                                             Volume 42 : Issue 01

4.      AIR TEMPERATURES
A.   Maximum Day-time Air Temperatures                        B.    Minimum Night-time Air Temperatures

Generally near normal or above normal maximum air tem-        Near normal or above normal minimum air temperatures
peratures were observed over the Fiji Group during Janu-      were recorded over most parts of the country during the
ary. Out of the 19 climate stations, 10 recorded anomalies    month. Of the 19 stations, 9 recorded anomalies ≥+0.5°C
within ±0.5°C from the normal, 6 ≥0.5°C, while 3 recorded     from the normal, 8 within ±0.5°C, while Yasawa-i-Rara and
anomalies ≤-0.5°C (Table 2 & Figures 2-5).                    Penang Mill registered anomalies ≤ -0.5°C (Table 2 & Fig-
                                                              ures 2-5).
Warmest days on average during the month was at Levuka
with a mean monthly maximum air temperature of 32.8°C,        The coolest place on average during the month was Nada-
followed by Keiyasi with 32.2°C, Lomaivuna with 32.1°C,       rivatu with a mean monthly minimum air temperature of
Seaqaqa with 32.0°C, and Saqani and Tokotoko (Navua)          18.8°C, followed by Monasavu with 19.7°C, Lomaivuna
with both 31.9°C. On the other hand, the coolest day time     with 21.8°C, and Vaturekuka (Labasa) with 22.5°C. On the
temperatures on average was observed at Nadarivatu with       other hand, the warmest nights on average during the month
mean monthly maximum air temperature of 24.9°C, fol-          were at Levuka and Viwa with both registering mean
lowed by Monasavu with 25.7°C, Ellington (Ra) with 29.3°      monthly minimum air temperature of 25.3°C, followed by
C, Vaturekuka (Labasa) with 30.1°C and Udu Point with         Rotuma with 25.2°C and Matuku with 25.0°C .
30.2°C.
                                                              Occasionally cool nights were observed during the month.
A period of very warm condition was experienced across        Nadarivatu recorded the lowest daily minimum air tempera-
the country from around 10th to the 21st. Lomaivuna record-   ture during the month with 15.0°C, followed by Monasavu
ed maximum air temperature as high as 36.1°C (20th), fol-     with 17.5°C and Rarawai Mill (Ba) with 19.8°C, all on the
lowed by Levuka with 35.9°C (15th) and Tokotoko (Navua)       27th. On the other hand, the warmest daily minimum air
with 35.5°C (15th). On the other hand, the lowest maximum     temperature was recorded at Kubulau with 27.8°C on the
air temperature during the month was recorded at Nadariva-    9th, followed by Matuku with 27.3°C on the 17th and Ro-
tu with 21.4°C on the 3rd, followed by Monasavu with 22.1°    tuma and Viwa with both 27.0°C on the 19th and 21st, re-
C on the 29th, and Lomaivuna with 25.7°C on the 29th.         spectively.

There was no new record maximum air temperature set There was no new record minimum air temperature set dur-
during the month.                                   ing the month.

TABLE 1. CLIMATE RECORDS ESTABLISHED IN JANUARY 2021

There was no new record established during the month.

Note: All comparisons in this summary are with respect to “Climatic Normals”. This is defined to be the average climate
condition over a 30-year period. Fiji uses 1981-2010 period as its “climatic normal” period.

                                                                                                                      3
Fiji Climate Summary - January 2021                                                      Volume 42 : Issue 01

TABLE 2. DAILY CLIMATE REPORTING SITES: SUMMARY FOR JANUARY 2021
                         RAINFALL                AIR TEMPERATURES              SUNSHINE
                     TOTAL RAIN MAX.         AVERAGE DAILY        EXTREME       TOTAL
                          * DAYS FALL     MAX. #    MIN. #    MAX.     MIN.           *
                      MM   % +    MM ON     C     C    C    C     C ON    C ON HRS    %

NADI AIRPORT          539 158 22   90 28 31.0 -0.5   23.9 0.9    33.7   13   22.0   27   141 67
SUVA/LAUCALA BAY      578 163 24 130 30 31.7 0.6     24.7 0.5    35.1   21   23.5   31   155 80
NACOCOLEVU            379 136 26   46 12 31.7 0.3    23.4 1.1    34.1   16   22.1    7   109 60
ROTUMA                672 191 25 110 29 30.9 -0.1    25.2 0.3    33.1   21   23.4   30   201 120
VIWA                  372 138 22   71 21 31.4 -0.1   25.3 0.2    33.3   19   23.9   24
UDU POINT             582 154 21 111 30 30.2 -0.6    24.3 -0.1   32.1   21   22.0   25
SAVUSAVU AIRFIELD      STATION TEMPORARILY CLOSED
LABASA AIRFIELD        STATION TEMPORARILY CLOSED
NABOUWALU              STATION TEMPORARILY CLOSED
KORONIVIA             441 119 22 139 28 31.0 0.4     23.8 0.9    33.0   22   22.5    1
NAUSORI AIRPORT       554 156 22 120 30 31.5 1.0     23.7 0.4    34.5   21   22.0    2
NAVUA/TOKOTOKO        433 115 27   63 25 31.9 1.5    23.6 1.5    35.5   15   22.0   19
MONASAVU             1038 158 26 221 30 25.7 0.2     19.7 0.7    28.5   19   17.5   27
LAUTOKA AES           676 179 23 139 28 31.1 -0.2    23.9 0.1    34.0   19   22.5    3
BA/RARAWAI MILL       829 194 22 175 28 31.1 -1.1    22.6 0.2    34.1   19   19.8   27
PENANG MILL          1008 249 23 287 30 31.2 0.4     23.5 -0.5   34.0   19   21.2   27
MATEI AIRFIELD         STATION TEMPORARILY CLOSED
VANUABALAVU           224 92 21    54 31 30.5 0.4    24.6 -0.0 31.9 22 22.9 25
LAKEBA                488 201 22 218 27 31.6 1.3     24.0 0.0 33.5 17 21.6 27
YASAWA                343 145 19   74 30 31.4 0.4    23.4 -1.1 34.9 19 21.0 8
VUNISEA               447 182 24   83 2 30.7 0.6     24.7 1.2 32.7 15 23.2 22
MATUKU                379 163 20 161 30 30.3 0.1     25.0 0.7 32.5 18 22.1 31
ONO-I-LAU             295 167 25   81 31 30.5 0.8    24.8 0.6 32.6 17 22.5 2
YAQARA AWS            859 276 21 202 30 31.8         24.1      33.9 10 22.1 27
LEVUKA AWS            775     25 170 30 32.8         25.3      35.9 15 23.9 3
KEIYASI AWS           713     22 202 28 32.2         22.7      35.4 7 21.5 1
LOMAIVUNA AWS         546     18 162 30 32.1          21.8      36.1 20 20.8 1
NADARIVATU AWS       2160     25 506 28 24.9         18.8      27.2 19 15.0 27
RKS LODONI AWS        400     15 192 30 31.2         23.1      33.7 20 21.8 4
MOMI AWS              405     18   98 28 U/S         24.3      U/S      22.7 4
SIGATOKA AWS          260     24   44 29 31.0        23.1      34.0 21 21.7 7
ELLINGTON (RA) AWS    991     22 260 30 29.3         23.4      30.7 14 21.7 3
WAINIKORO AWS         894     21 179 30 31.0         23.3      34.1 18 21.7 1
SAQANI AWS            U/S                 31.9        24.6      33.9 12 22.9 3
VATUREKUKA AWS        U/S                 30.1        22.5      32.5 26 21.2 1
SEAQAQA AWS          1019 237 22 350 30 32.0         24.4      34.5 19 22.3 10
KOROLEVU AWS          349     21   57 24 31.8        23.1      34.6 21 21.9 9
KORO ISLAND AWS       U/S                 U/S        U/S
KUBULAU AWS           441     18 105 28 30.4         23.5       31.9 21 22.2 10
DOBUILEVU TB3         812 200 22 269 30
NASINU TB3            463     23 126 30
TAVUA TB3             830 232 22 183 28

                    TEMPERATURE( C)HUMIDITY WIND SUN RAD
                         DRY WET RH% VP           %OF MJ/
                  MEAN    (AVERAGE AT 9AM)   KT POS SQ.M

NADI AIRPORT       27.4 28.2 25.2 78 29.6 6.2 36 16.1
SUVA/LAUCALA BAY   28.2 28.7 25.8 79 30.9        40 9$
NACOCOLEVU         27.5 28.2 26.1 85 32.3        29 17$
ROTUMA             28.0 28.6 26.2 83 32.1        53 21$
VIWA               28.4 28.8 26.3 82 32.3
UDU POINT          27.3 28.1
SAVUSAVU AIRFIELD STATION TEMPORARILY CLOSED
LABASA AIRFIELD    STATION TEMPORARILY CLOSED
NABOUWALU          STATION TEMPORARILY CLOSED
KORONIVIA          27.4 28.6 26.1 82 31.9
NAUSORI AIRPORT    27.6 28.2 25.7 82 31.2 5.7
NAVUA/TOKOTOKO     27.8 28.7
MONASAVU           22.7 23.3 21.6 86 24.5
LAUTOKA AES        27.5 28.2 26.0 84 32.1
BA/RARAWAI MILL    26.8 28.1 25.6 82 30.9
PENANG MILL        27.3 28.3 25.9 82 31.4
MATEI AIRFIELD      STATION TEMPORARILY CLOSED
VANUABALAVU        27.5 28.6 25.6 78 30.5
LAKEBA             27.8 29.0 26.1 80 31.7
YASAWA             27.4 28.3 26.4 86 33.1
VUNISEA            27.7 28.5 26.0 81 31.7
MATUKU             27.6 28.3 26.0 83 31.9
ONO-I-LAU          27.7 28.3 26.1 84 32.2
MEAN TEMPERATURE IS (MAX+MIN)/2;      WIND IS MEAN SPEED    AT 06,12,18,24 HOURS.
$ :SOLAR RADIATION CALCULATED FROM SUNSHINE DURATION. #     :DEPARTURE FROM LONG-TERM AVERAGES
(1981-2010). + :NUMBER OF DAYS WITH 0.1 MM OR MORE RAIN.    * :PERCENT OF LONG-TERM AVERAGES.
BLUE FONT: MISSING RECORDS OF LESS THAN OR EQUAL(≤) TO 5    DAYS. U/S: UNSERVICEABLE

                                                                                                            4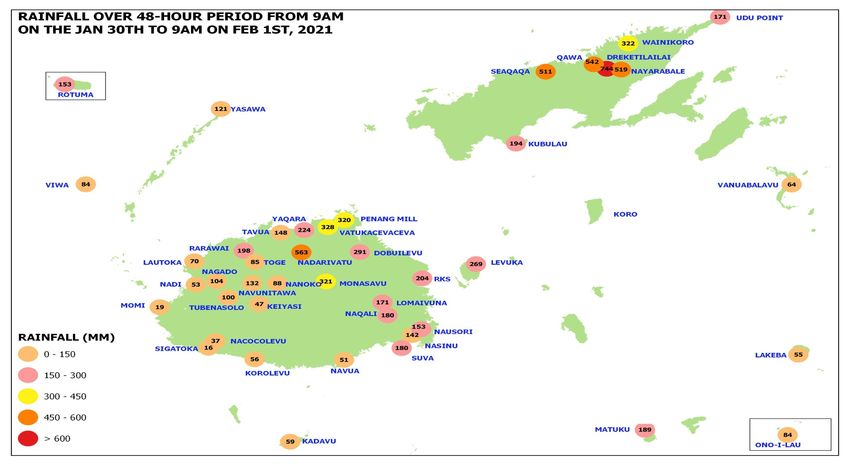
Fiji Climate Summary - January 2021   Volume 42 : Issue 01

 Figure 2

 Figure 3

 Figure 4

                                                         5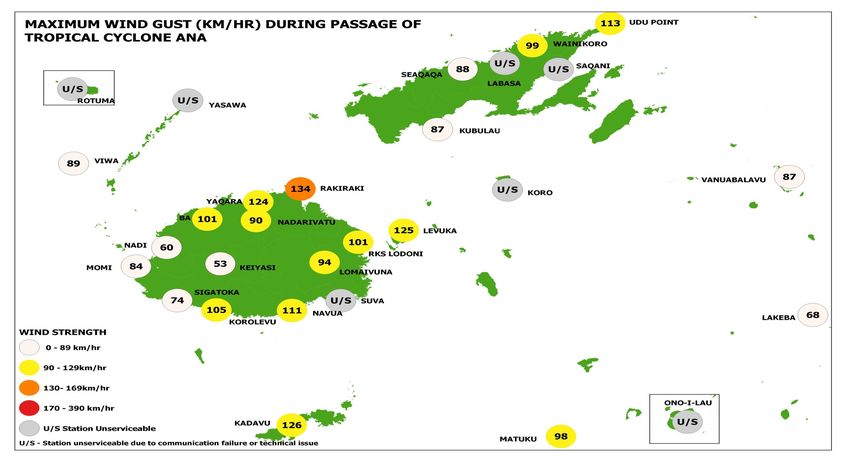
Fiji Climate Summary - January 2021                                                                                                                            Volume 42 : Issue 01

Figure 5

5.                                                DAILY RAISED PAN EVAPORATION
 Figure 6                                                                                         Daily Evaporation for January 2021
                       18
                       16                                               Nadi             Suva        Nacocolevu
                       14
 Evaporation (mm)

                       12
                       10
                                        8
                                        6
                                        4
                                        2
                                        0
                                                   1 2 3 4 5 6 7 8 9 10 11 12 13 14 15 16 17 18 19 20 21 22 23 24 25 26 27 28 29 30 31
                                                                                                                      Date
Figure 6: The total monthly evapor ation at Nadi Airpor t, Laucala Bay (Suva) and Nacocolevu (Sigatoka) were
156mm, 128mm, and 90mm, respectively. Nadi’s highest daily evaporation was 11.4mm on the 29th, with Suva’s highest
daily evaporation of 12.3mm on the 10th and Nacocolevu (Sigatoka) recorded its highest of 9.9mm on the 21st.

6.                                                SOLAR RADIATION
                                                                                                                                                            Figure 7:
 Figure 7                                                      Nadi Solar Radiation (MJ/m2) for January 2021
                                             30
                                                                                                                                                            The mean daily solar radia-
                                             25                                                                                                             tion at Nadi Airport during
                                                                                                                                                            the month was 16.0MJ/m2
             Daily Solar Radiation (MJ/m2)

                                                                                                                                                            compared to 21.2MJ/m2
                                             20

                                             15                                                                                                             over 30 year average (1981
                                                                                                                                                            -2010).
                                             10

                                             5

                                             0
                                                   1   2   3    4   5   6   7   8   9   10 11 12 13 14 15 16 17 18 19 20 21 22 23 24 25 26 27 28 29 30 31
                                                                                                         Day

                                                                                                                                                                                      6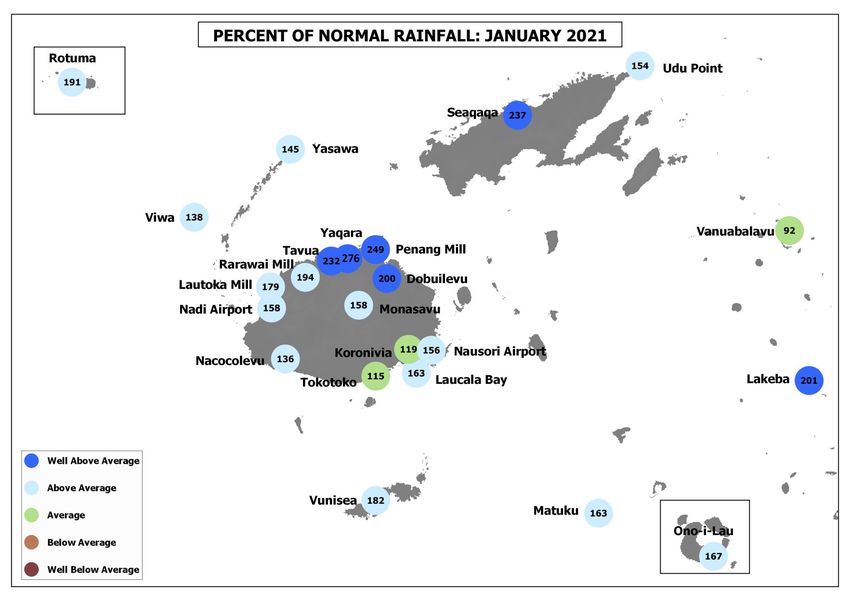
Fiji Climate Summary - January 2021                                                                   Volume 42 : Issue 01

7.      WIND SUMMARY

Figure 8a: Winds from southeast were dominant at Nadi Airport during the month, followed by north, then east. Wind
strength were generally light to moderate at the station, but fresh to strong breeze was observed during the passage of TC Ana.

Figure 8b: Winds from northwest were dominant at Nausori Airport, followed by northeast and then north. Light to
strong winds were generally observed at the station, but TC Ana brought gale force winds.
                                                                                                                             7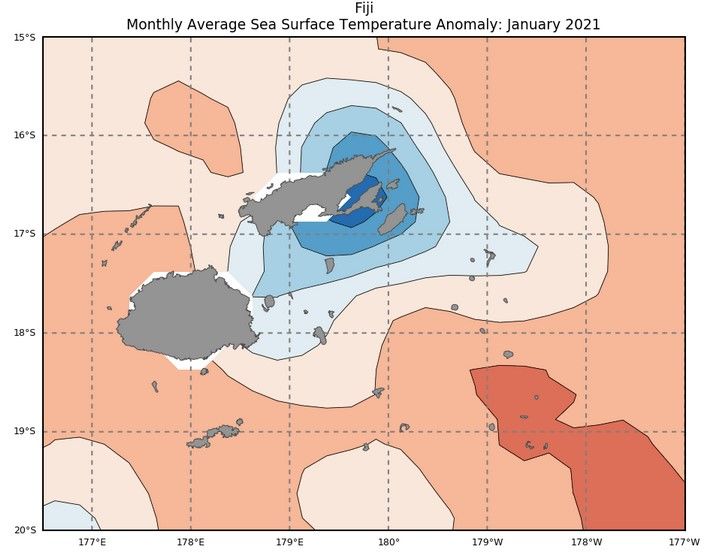
Fiji Climate Summary - January 2021          Volume 42 : Issue 01

8.     SEA SURFACE TEMPERATURE (SST)
                                       Figure 9:

                                       Cool sea surface tempera-
                                       tures continued to persist
                                       around Vanua Levu post the
                                       passage of severe tropical
                                       cyclone Yasa over the island
                                       in December 2020.

                                       Source:http://
                                       oceanportal.spc.int/portal/
                                       app.html#climate

9.     CLOUD COVER
                                       Figure 10:

                                       Above normal cloud cover
                                       was present over the Fiji re-
                                       gion during the month (Fiji
                                       in blue circle).

                                       Source: http://
                                       www.esrl.noaa.gov/psd/map/
                                       clim/olr.shtml

10.    SEA LEVEL
                                       Figure 11:

                                       Positive sea level anomalies
                                       were present in the Fiji Wa-
                                       ters during the month, with
                                       anomalies of up to +10-
                                       15cm.

                                       Source: http://
                                       oceanportal.spc.int/portal/
                                       app.html#sealevel

11.    WIND ANOMALIES
                                       Figure 12:
                                       North-westerly wind anoma-
                                       lies were observed over the
                                       Fiji Group during the month,
                                       with anomalies of up to
                                       6.0m/s over the Northern and
                                       Eastern Divisions (base peri-
                                       od: 1981-2010) (Fiji in red
                                       circle).

                                       Source: https://
                                       www.esrl.noaa.gov/psd/map/
                                       images/rnl/
                                       sfcwnd_30b.rnl.html
                                                                     8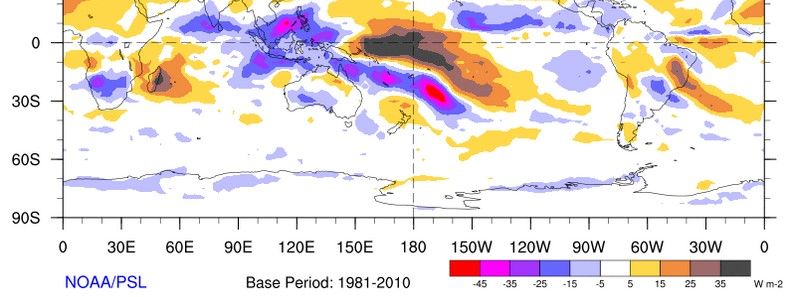
Fiji Climate Summary - January 2021 Volume 42 : Issue 01
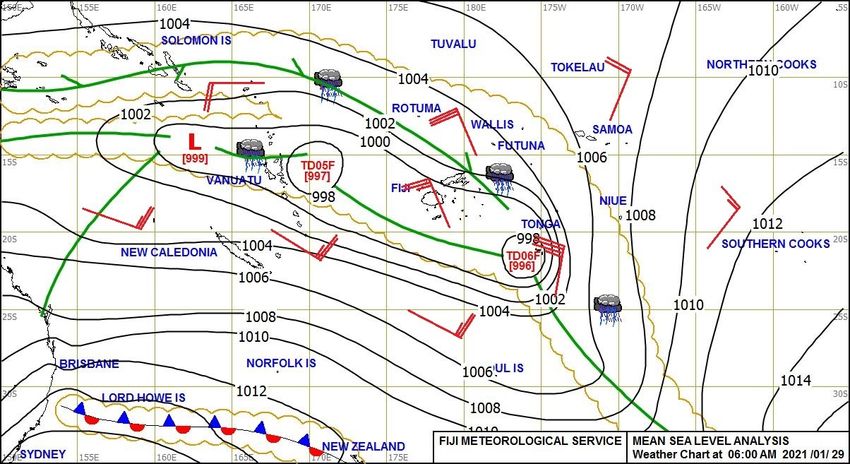
12. FLOODING: 28TH AND 29TH
The last week of January 2021 has
brought about significant rainfall
over the country which resulted in
series of flash floods as well as ma-
jor river flooding. There was wide-
spread flooding in the Western Viti
Levu on the 29th.
An active convergence zone result-
ed in widespread rainfall across the
country on the 28th and 29th (Figure
13). Rainfall over the Western Divi-
sion in particular was heavy. Over a
24-hour period from 9am on the 28th
to the 9am on the 29th, Nadarivatu
recorded an enormous 506mm of
rainfall, followed by Vatukace-
vaceva with 330mm, Ellington (Ra)
Figure 13: Mean sea level analysis at 6am on the 29th.
with 223mm, Navala with 221mm,
Toge with 217mm and Penang Mill with 212mm. Consequently, Rakiraki town was inundated with flood waters on the
28th. A number of other low lying areas and crossings around Ra were also reported flooded. This included Narara Cross-
ing, Drana Crossing, road to the Waimari Flat, Katudrau Crossing, Navatu School, surface flooding after Drauniivi School
and Matewali Crossing.
Heavy precipitation continued on the 29th with Nadarivatu registering 436mm of rainfall, followed by Navala with
282mm, Bukuya with 245mm, Navunitawa with 241mm and Nanoko with 231mm. Over a 48-hour period from 9am on
the 28th to 9am on the 30th, Nadarivatu recorded 942mm of rainfall, followed by Navala with 503mm of rainfall,
Vatukacevaceva with 479mm, Toge with 430mm and Nanoko with 426mm.
Figure 14: Rainfall across the country over 48-hour period from 9am on the 28th to 9am on the 30th.
These high intensity rainfall resulted in major flooding in Ba, Tavua and Rakiraki. Certain parts of Sigatoka, Nadi and
Lautoka also experienced flash floods. Major towns such as Rakiraki, Tavua, Ba and Nadi were also inundated with flood
waters. A life was lost when a villager drowned while trying to cross flooded Waikubukubu River in Nadarivatu.
9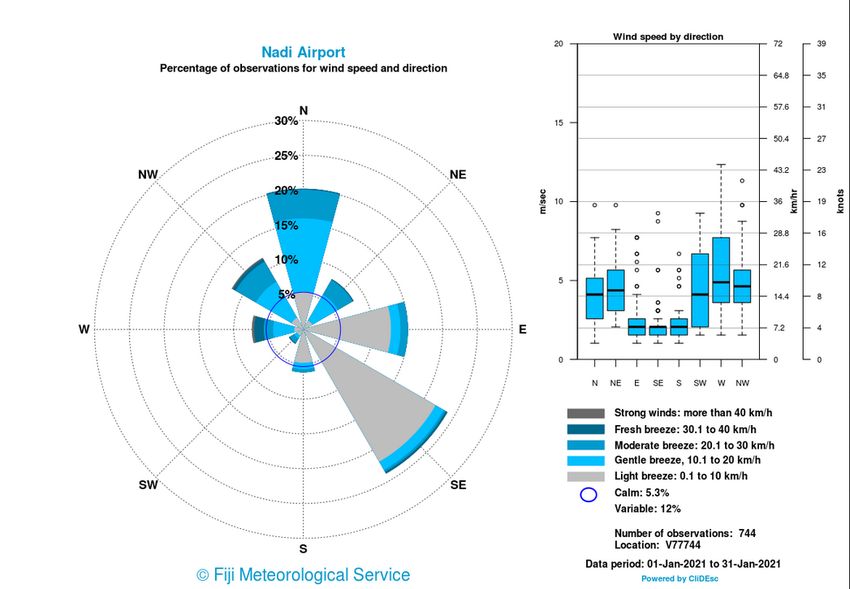
Fiji Climate Summary - January 2021                                                               Volume 42 : Issue 01

13. TROPICAL CYCLONE ANA
Tropical cyclone Ana passed through the Fiji Group during the
month. It made a landfall near Ra as a Category 2 system and
then bisected through Viti Levu exiting near Navua. It continued
its journey south making a landfall over eastern half of Kadavu
at the same intensity. Most of the destructive winds around Ana
were packed to the north and east of its centre. Consequently,
gale to storm force winds were recorded over Viti Levu, Kadvu,
Lomaiviti Group and as far as Vanua Levu. It also resulted in
severe flooding, especially in the Central and Northern Divi-
sions. Labasa recorded its worst flood since the flood associated
with severe tropical cyclone Ami in 2003.

Tropical cyclone Ana originated from a low pressure analysed
between Fiji and Vanuatu. It slowly tracked eastward toward
Vanuatu and intensified into a tropical disturbance 05F on the
26th just northeast of Port Vila. TD05F was slow moving due to
a blocking high pressure system to the south and a ridge of high
pressure to the far east of the system. This slow movement ena-
bled the system to further intensify into a Tropical Depression
05F on the 27th whilst slow moving just east of Vanuatu. It then
began to track east-northeast towards the north of Fiji early on
the 29th.
                                                                 Figure 15: Tropical cyclone Ana on the RADAR net-
                                                                                                st
At 6am on the 30th, TD05F intensified into a tropical cyclone work in Fiji at 3.20am on the 31 , with the centre sitting
and was subsequently named ‘Ana’ about 340km northwest of just off the coast of Viti Levu.
Nadi. Tropical cyclone Ana began to track east-southeast to-
wards the Fiji Group and passed the northern tip of the Yasawa Group at about 11pm on the 30th.

Ana further intensified into a Category 2 system over the Bligh waters. It reached very close to coast of Ra by around 1am
on the 31st, but it started to track west over the waters and then supposedly made a clockwise loop upon reaching waters
                                                                                                   off the coast of Ba
                                                                                                   (Figure 15). Ana finally
                                                                                                   made a landfall near
                                                                                                   Rakiraki at about 6am
                                                                                                   on the day. It made its
                                                                                                   way across Viti Levu in
                                                                                                   a south-southeast direc-
                                                                                                   tion and exited Viti Le-
                                                                                                   vu near Navua at about
                                                                                                   2pm.

                                                                                                 Ana continued to track
                                                                                                 south across the Kadavu
                                                                                                 passage and made land-
                                                                                                 fall on the eastern tip of
                                                                                                 Kadavu at about 6pm on
                                                                                                 the 31st. After passing
                                                                                                 Kadavu, the cyclone
                                                                                                 further intensified into a
                                                                                                 Category 3 system.

                                                                                                 Ana continued to track
                                                                                                 south-southeast     away
                                                                                                 from the Fiji Group and
                                                                                                 progressively weakened
                                                                                                 as it encountered high
                                                                                                 wind shear and cooler
                                                                                                 ocean waters. Ana was
                                                                                                 finally declassified to a
Figure 16: Provisional track map of tropical cyclone Ana. Pink, dark pink and red colours        tropical low at 6am on
indicate extent of gale, storm and hurricane force winds.                                        the 2nd after losing its
                                                                                                 tropical cyclone charac-
teristics. The low level center was completely sheared from its convective cloud topping.

                                                                                                                        10
Fiji Climate Summary - January 2021 Volume 42 : Issue 01
Ana resulted in very significant rainfall over the country, especially over the Northern and Central Divisions, and as well
as northwestern Viti Levu. Over the 24-hour period from 9am on the January 31st to 9am on the February 1st,
Dreketilailai registered 392mm of rainfall. Furthermore, a number of stations recorded very heavy rainfall from 9am on
the 30th to 9am on the 31st with Dreketilailai and Nadarivatu observing 352mm of rainfall, followed by Seaqaqa with
350mm, Qawa with 300mm, Penang Mill with 287mm, Nayarabale with 278mm and Vatukacevaceva with 272mm
(Figure 17). Over the 48-hour period from 9am on the January 30th to 9am on the February 1st, Dreketilailai received
744mm, followed by Nadarivatu with 563mm, Seaqaqa with 511mm, Qawa with 542mm, Nayarabale with 519mm and
Seaqaqa with 511mm (Figure 18).
Figure 17: Rainfall across the country over 24-hour period from 9am on the 30th to 9am on the 3st.
Figure 18: Rainfall across the country over 48-hour period from 9am on the Jan 30th to 9am on the Feb 1st.
11Fiji Climate Summary - January 2021 Volume 42 : Issue 01
High intensity rainfall in particular were recorded over north western and interior of Viti Levu, and Vanua Levu, with
Penang Mill registering rainfall of up to 61mm/hr, followed by Nadarivatu with 58mm/hr and Seaqaqa with 55mm/hr.
While Ana attained maximum intensity of a Category 3 system, the land areas of Fiji escaped the hurricane force winds.
Nonetheless, gale force winds covered most parts of the country, with the storm force winds extending to most of Viti
Levu, Lomaiviti Group and parts of Vanua Levu. The highest recorded sustained wind was registered at Rakiraki with
96km/hr, followed by Levuka with 95km/hr, Udu Point with 84km/hr and Vunisea (Kadavu) with 80km/hr (Figure 19).
Figure 19: Maximum recorded sustained winds during the passage of tropical cyclone Ana.
Figure 20: Maximum recorded wind gusts during the passage of tropical cyclone Ana.
12Fiji Climate Summary - January 2021 Volume 42 : Issue 01
The highest observed wind gust was at Rakiraki with 134km/hr, followed by Vunisea (Kadavu) with 126km/hr, Levuka
with 125km/hr and Yaqara with 124km/hr (Figure 20).
The destructive storm to gale force winds resulted in damages to houses, utilities, trees, crops and vegetation. It also re-
sulted in heavy swells that caused sea flooding and inundation in coastal areas.
Major river flooding were recorded over greater Vanua Levu on the January 31st till the February 1st (Figure 20). Labasa
Town was badly impacted by the flood. Major river flooding was also reported along Wainibuka River in the upper Re-
wa catchment. Rewa River broke its bank in the early hours of 31st resulting in flooding of low lying areas of Rewa Del-
ta. Rakiraki town was also inundated with flood waters. Apart from flooding, a number of landslides and roads slips were
also recorded, especially on Vanua Levu, bringing major disruptions to road transportation network. At the time of this
report, there was one causality from Bagata village in Savusavu, and two missing people from Cikobia Island.
Hourly Water Level and Rainfall Graph for Dreketilailai Station - TC Ana
8000 60
Rainfall mm Water Level (mm) Warning Threshold (mm) Bank Break Level (mm)
7000
50
6000
40
5000
Water Level (mm)
Rinfall (mm)
4000 30
3000
20
2000
10
1000
0 0
0000
0200
0400
0600
0800
1000
1200
1400
1600
1800
2000
2200
0000
0200
0400
0600
0800
1000
1200
1400
1600
1800
2000
2200
0000
0200
0400
0600
0800
1000
1200
1400
1600
1800
2000
2200
0000
0200
0400
0600
0800
1000
1200
1400
1600
1800
2000
2200
30-01-21 31-01-21 01-02-21 02-02-21
Fiji Standard Time
Figure 21: Water level and rainfall graph for Dreketilailai, Vanua Levu.
Note: All date and time in this summary are in Fiji Standard Time. Also note that the analysis for tropical cyclone Ana is
based on provisional data, which could change upon quality control of the data and the best track analysis.
13You can also read