BASELINE SURVEY REPORT - AID4MADA
←
→
Page content transcription
If your browser does not render page correctly, please read the page content below
Baseline Survey Report
1 Introduction
This report describes the results of the Baseline Survey conducted in August 2018 in the area of
Tulear, in the Region of Atsimo-Andreafana, Madagascar. The aim of the survey was, in line with
the requirements of the Gold Standard, to capture the baseline water purifying and consumption
habits as well as the fuel usage pattern for cooking and boiling purposes together with the
demographic indicators of the families living in the project area of the Gold Standard micro-scale
VPA “Water is life, Madagascar” (GS 6752) implemented under the Gold Standard Programme of
Activities called “PoA – Climate Finance for Sustainable Development” (GS 5658). The results of
this baseline survey may be applied later also for the future VPA under the PoA GS 5658
implemented within the area.
The Survey was implemented in between 13th July and 30st August 2018 by three Italian surveyors
and five native people and it was conducted at a household level through face-to-face interviews
made by using a detailed pre-prepared questionnaire (Annex 1).
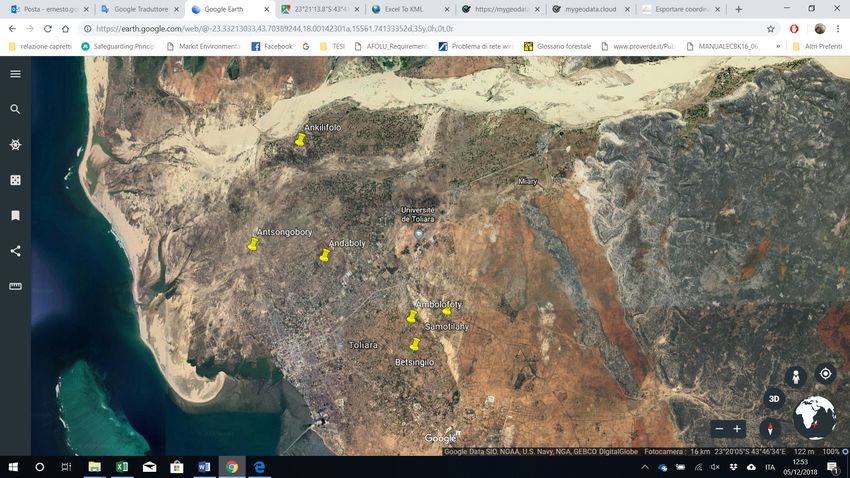
Totally 101 interviews were made to randomly selected households within 6 villages located in the
area (figures 1-2), addressing particularly the women which usually take care of the home
management (food preparation, cooking fuel collection, water fetch, etc.). As all the villages in the
area are socio-demographically homogenous and located in the surroundings of the city of Tulear,
the selected 6 villages can be considered representative for all the villages of the area.
According to the applied Gold Standard methodology (TPDDTEC, version 3.1) the following
information were captured by the surveys:
• Address or location of respondents
• Telephone number (when possible)
• Family size and income sources
• Cooking habits, types of fuels used and estimated quantities
• Sources of fuels and prices paid, or effort made
• Seasonal variations in baseline technology and fuel use
• Water use and water purification habits
25
                                                             20                              20
                  20        18
                                                                                 16
  RESPONDENTS

                                        14                                                                13
                  15

                  10

                   5

                   0
                         Ambolofoty   Andaboly           Ankilifolo        Antsongobory   Betsingilo   Samo_lahy
                Totale      18          14                   20                  16          20           13
                                                                   VILLAGES

                                             Figure 1: Villages included in the survey

                                                 Figure 2: location of the villages

2 Results
2.1 Socio-Demographic Characteristics of Respondents
The majority of the 101 respondents of the survey were female (67%) (figure 3). The average
household was composed of 7.6 persons, from which averagely 28.3% were children (figure 4).
Converted as Standard Adults the average family size corresponds to 5.7 Standard Adults.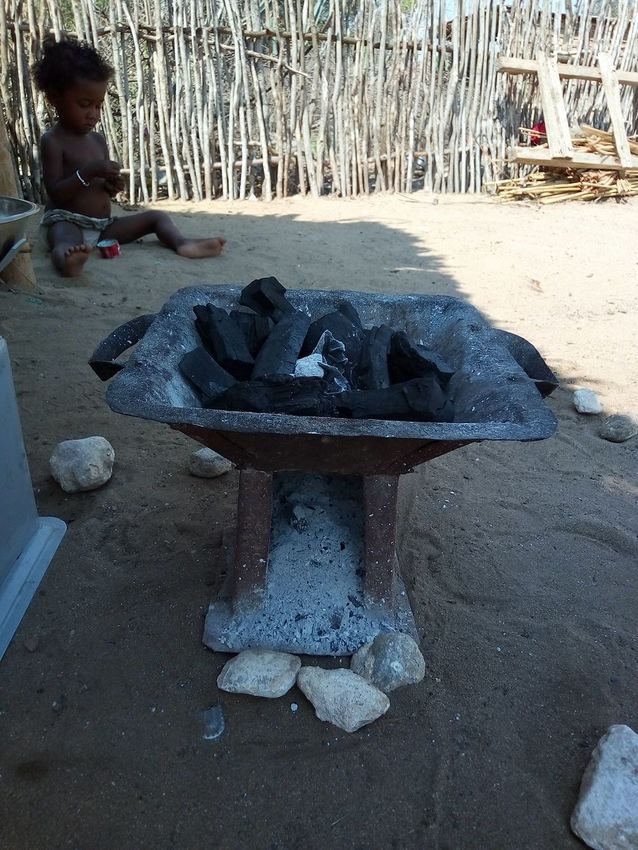
Most of the respondents indicated as their main income source temporary works (34 out of 101)
and other types of jobs, such as bricklayer, seller, smith, fisherman, cleaner, etc. (36 out of 101).
This reflects the context of suburbs and peri-urban areas of the project area. The remaining part of
families (around 32%), on the other hand, lives on agriculture and livestock (figure 4).

                                       Gender of respondents

                                          33%

                                                                                     F
                                                                  67%
                                                                                     M

                                         Figure 3: Gender of the respondents

                      Composi_on of households by gender and age
                                       classes
              30,0%       28,3%
                                                                                    27,0%

              25,0%                             23,5%
                                                                     21,1%
              20,0%

              15,0%

              10,0%

               5,0%

               0,0%
                        Child 0 - 14        Female over 15        Male 15-59     Male over 60

                                       Figure 4: Average household composition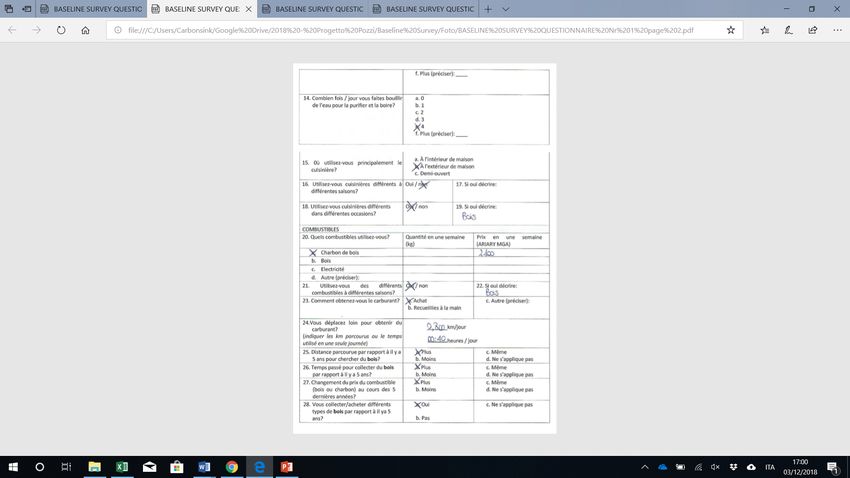
Source of income
                                 40

                                 35
                                                                       36              Conteggio di Agriculture
                                                            34
                                 30
               No. Respondents

                                 25                                                    Conteggio di Livestock
                                      25
                                 20
                                                                                       Conteggio di Temporary
                                 15                                                    work

                                 10                                                    Conteggio di Other

                                  5              7
                                  0

                                                     Figure 5: Main income sources

2.2 Cooking habits and fuel
2.2.1 Cooking frequency and used cookstove types
The majority of the respondents declared to consume averagely 2.5 meals per day which is, in fact,
according to a well-established habit in the project area. The mainly used cooking stove type is the
traditional charcoal stove (86.1%, 87 out of 101), followed by the three stone fire (13.9%, 14 out of
101) fueled by firewood (figure 6-7-8).

                                           Figure 6: example of traditional charcoal stove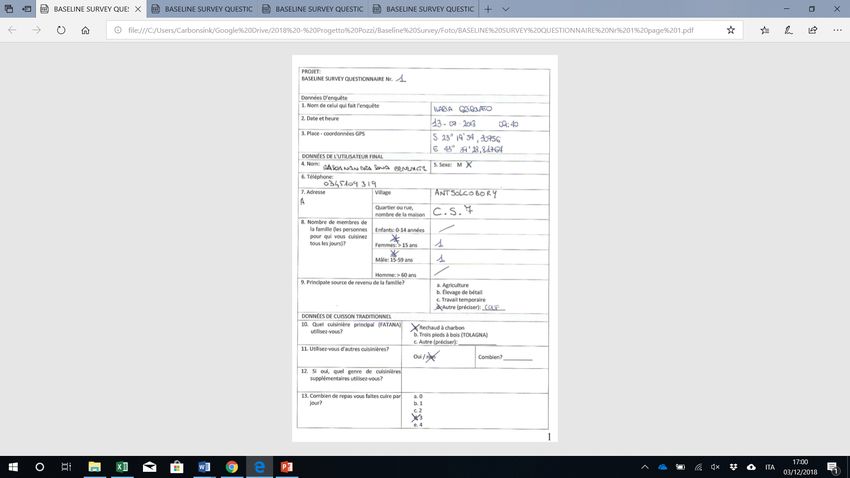
Figure 7: example of three stone fire

29 of the 87 households that use the traditional charcoal stove as their main cookstove, declared
to also use the three stone fire as an additional secondary stove. While, out of the 14 households
that use tree stone fire as their main stove, 2 also use the traditional charcoal stove as a secondary
stove.
Families were asked if they use different stoves depending on the season. 33 families out of 101
have confirmed to do so: Most (29 respondents) declared to use during the rainy season
(November to March) more tree stone fires than during the dry season.
In addition, 42 out of 97 respondents indicated to use different stoves depending on the event
and/or occasion. For example, the tree stone fires were indicated to be used during the special
family events.
Moreover, the respondents were asked if, in addition to the cooking, they boil water before
drinking it. 54.4% of the respondents (corresponding on 55 respondents out of 101) declared to
boil water before drinking it, at the average water boiling was done 2.6 times/day.
Principal stove model used by
                                         households
                  100,0%
                   90,0%                                              86,1%

                   80,0%
                   70,0%
                   60,0%
                   50,0%
                   40,0%
                   30,0%
                   20,0%             13,9%
                   10,0%
                    0,0%
                                 Three stone fire             Tradi_onal charcoal stove

                                        Figure 8: Used stove types

2.2.2 Cooking fuel types and supply
87% (88 out 101) of households said that they use charcoal as their main fuel, the remaining part
(13%, 13 out of 101) uses firewood (figure 9). In addition, 35 families out of 101 said they use
different fuels (firewood or charcoal) depending on the season. These responds correspond well
with the cookstove usage patterns discussed above in paragraph 2.2.1 as, for example, 29% of the
respondents stated to prefer tree stone fires during the wet season.
Most families (100 out of 101) said they mainly purchase fuel and that the price of the fuel has
increased in price over the past 5 years. This can have a large impact on local household budgets,
in fact 62 families out of 101 said they have skipped meals due to lack of fuel.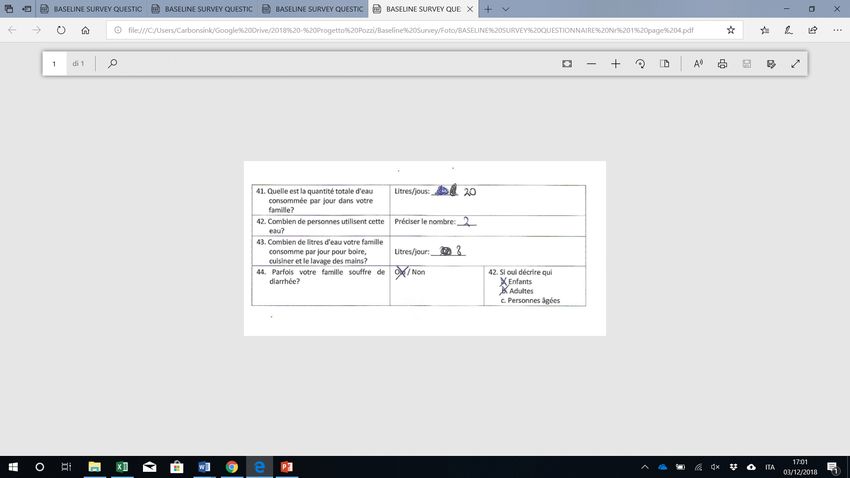
Fuel used for cooking
                                  100,00%
                                                87,13%
                                   90,00%
               N.RO RESPONDENTS    80,00%
                                   70,00%
                                   60,00%
                                   50,00%
                                   40,00%
                                   30,00%
                                   20,00%                                              12,87%
                                   10,00%
                                    0,00%
                                               Charcoal                                Wood

                                            Figure 9: fuel usage in the project area

2.3 Water use and water purification habits
2.3.1 Water supply place
The baseline survey results confirm that the local families obtain currently their drinking water
from sources which are to be considered as unsafe water sources; 51.5% of the respondents
declared to obtain their drinking water from open wells, 23.8% stated to obtain water from
borehole with hand pump and 1% from the river (figure 10). None of these baseline water sources
can be considered clean and safe as the existing well and boreholes are unprotected. Some of
families living in the villages of Antsongobory and Ankilifolo stated mainly to buy water from the
seller (23.8% of the total sample), also the purchased water is not considered as clean and safe
and, in fact, the households purchasing drinking water also purify it before drinking. Moreover,
these some families living in the village of Ankilifolo do not buy the water during the rainy season,
but they fetch it from the river (see map on Figure 2).
Main water source
60,0%
51,5%
50,0%
N.RO RESPONDENTS %
40,0%
30,0%
23,8% 23,8%
20,0%
10,0%
1,0%
0,0%
Borehole hand pump Open well River Water seller
Figure 10: Mainly source for drinking water
EXAMPLE PHOTOS OF THE CURRENT WATER SOURCES?
2.3.2 Water consume
The survey questionnaire included questions for gathering initial information on the water
consumption levels per family (the questions 41, 42 and 43 of the Annex 1).
The respondents estimated the average water consumption per family to be 115.6
litres/day/family with averagely 6.6 persons served by this quantity. Converted per person the
self-estimated water consumption is 20.3 liters/day/person. The water estimated for be consumed
only for drinking, cooking (including food preparation) and hand washing was instead 67.9
litres/day/family corresponding averagely around 11.4 litres/day/person (Figure 11).Water Consump_on / Day
120
100
47,7
80
Water for other uses (l)
60
Water for drinking etc.
40 purposes (l)
67,9
20
8,9
11,4
0
Per hh Per person
Figure 11: Self-estimated water consumption
2.3.3 Water purification
The following question was asked regarding community perception of water quality: “Is the water
that you drink clean and safe for you and your family?” The response was “No” for almost half of
the sample (47.5%), which means that a great number of the local families are aware about the
health risks related to the consume of the unsafe water.
As well known, the use of unprotected water sources and unsafe water increases the incidence of
the diseases such as diarrhea, intestinal infections and parasites. In fact, more than half of the
respondents (52.5%) reported that their family suffer diarrhea and sickness (Figure 11).
Do your family even suffer from diarrhea? Who?
50,00% 47,52%
45,00%
40,00%
N.RO RESPONDENTS
35,00%
30,00%
23,76%
25,00%
20,00%
15,00% 10,89% 9,90%
10,00% 5,94%
5,00% 1,98%
0,00%
N/A adults adults, eldery children children, children,
adults adults, eldery
N Y
Figure 12: Suffering of water based health problemsAs shown in the figure below (figure 12), 45 out of 101 respondents (44.6%) declared to purify the
water before drinking it. Clearly the most common purification method used in the area is boiling,
in fact 43 respondents (42.6% of the sample) stated to use boiling and only 2 respondents (2,0% of
the sample) to use liquid chlorine for purification purposes.
è Currently thus 2% of the baseline households consume non-boiling safe water supply.
Consequently, the value 0.02 may be applied for the parameter Cj (“Percentage of users of
project safe water supply who were already in baseline using a non boiling safe water
supply the households using in baseline situation a non boiling safe water supply”) for the
Emission Reduction calculations made in line with the TPDDTEC (ver 3.1).
Ques_ons 37-38
60 56
50
43
40
30
20
10
1 1
0
Boiling Boiling, Chlore liquide Chlore liquide N/A
Yes No
Figure 13: Question 37: Do you purify your water before drinking? Question 38: In case yes, what methods do you use?
2.3.4 Suppressed demand of clean drinking water
A key objective of this survey, concerning suppressed demand, was to understand the reasons why
the project households choose not to purify their water and for this reason all the persons who
stated currently not to purify their drinking water (as in Figure 12) were asked the reason for not
purifying (figure 13). To gather in best way the real ideas of the respondents without influencing
the answers beforehand, the surveyors asked this question as an open question (the answer
options shown in Annex 1, Question 39, were provided only if the respondent had difficulties to
understand the meaning of the question).Reasons for not purifying water
60 56
50
40
30 27
23
20
10
1 2 2 1
0
Fuel is Fuel is Fuel The water There is no No answer Total
expensive and expensive collec_ng source i use is benefit to me
its collec_ng takes too clean
takes too much _me
much _me
Figure 14: Reasons for not purifying water (question 39)
As shown in Figure 13, the reasons why baseline households do not purify water are to be sought,
on the one hand (53,5% out of 56 respondents), in the time taken to get fuel and its cost, and on
the other hand (46,5% out of 56 respondents), by the fact that the respondents do not consider to
receive benefits from purification or do think that their drinking water is safe and clean. However,
as already described in paragraph 2.3.1. the water sources currently present in project area can’t
be considered clean and safe.
To further investigate the purification preferences of the local families, the respondents were
asked to describe what method they would prefer for making the water safe to drink in case no
barriers would exist (Question 40 of Annex 1). Also, this question was asked firstly without
providing any answer options for avoiding to not influencing the responses.
The majority of the respondents that currently do not purify their water (40.6%, 41 respondents
out of 101) stated that they would boil their water for making it safe to drink in case the earlier
stated barriers would not exist. The remaining part (14.9 %) stated that they would prefer to use
chlorine liquid for the purification (i.e. to use on-GHG emitting technologies) (Figure 14).
è It can be assumed that in the absence of the VPA project activities 14.9% of the baseline
households would prefer to use liquid chlorine for water purification if it would be available
for them. Consequently, the value 0.149 may be applied for the parameter Xboil
(“Percentage of premises that in the absence of the project activity would have used non-
GHG emitting technologies like chlorine treatment techniques (if available) in the project
boundary”) for the Emission Reduction calculations made in line with the TPDDTEC (ver
3.1).Ques_on 40 - Hyphote_cal purifica_on method
50,00%
44,60%
45,00% 40,60%
40,00%
N.RO RESPONDENTS %
35,00%
30,00%
25,00%
20,00%
15,00% 12,90%
10,00%
5,00% 2,00%
0,00%
N/A Boiling Chlore liquid SurEau (Chlore liquid)
Yes No
Figure 15: Purification method that would use families if there were no barriers. The percentage under "YES" means respondents
who have declared to purify water (section 2.3.3.).3 ANNEX 1. Survey Form
PROJET:
BASELINE SURVEY QUESTIONNAIRE Nr.
Données D'enquête
I. Nom de celui qui fait l'enquête
2.Date et heure
3.Place - coordonnées GPS
DONNÉES DE L'UTILISATEUR FINAL
4.Nom : 5.Sexe: M F
6.Téléphone:
7 Adresse Village
Rue, nombre de la
maison
8.Nombre de membres Enfants : 0-14
de la famille (les années
personnes pour qui
vous cuisinez tous les Femmes > 15 ans
jours) ?
Mâle : 15-59 ans
Homme > 60 ans
9.PrincipaIe source de revenu de la famille ? a.AgricuIture
b.Élevage de bétail
c.TravaiI temporaire
d.Autre (préciser) :
__________
DONNÉES DE CUISSON TRADITIONNEL
10.QueI cuisinière principal (FATANA) a. Trois pieds à bois (TOLAGNA)
utilisez-vous ? b. Rechaud à charbon
d. autre (préciser): _____________
11.Utilisez-vous d'autres cuisinières ?
Oui/ non Combien? __________
12. Si oui, quel genre de cuisinières
supplémentaires utilisez-vous ?
13.Combien de repas vous faites cuire a.1
par jour? b.2 d.4
c.3 e.Plus (préciser)14.Combien fois / jour vous faites a.1 d.4
bouillir de l'eau pour la purifier et b.2 e.Plus (préciser)
la boire? c.3
a. À l'intérieur de maison
15.0ù utilisez-vous principalement le
b. À l'extérieur de maison
cuisinière?
c. Demi-ouvert
16.Utilisez-vous cuisinières différents à Oui/ non 17.Si oui décrire:
différentes saisons?
18.UtiIisez-vous cuisinières différents Oui / non 19. Si oui décrire:
dans différentes occasions?
COMBUSTIBLES
20.QueIs combustibles utilisez-vous ? Quantité en une semaine Prix en une semaine
(kg) (ARIARY MGA)
a.Bois
a.Charbon de bois
b.Electricité
c.Autre (préciser) :
21.1JtiIisez-vous des différents Oui/ non 22.Si oui décrire
combustibles à différentes
saisons?
23.Comment obtenez-vous le a.RecueiIIies à la c.Autre (préciser) :
carburant ? main x b.Achat
24.Vous déplacez loin pour obtenir du
carburant ? _______km/jour
(indiquer les km parcourus ou le temps
heures / jour
utilisé en une seule journée)
25. Distance parcourue par rapport à il a.PIus c.Même
y a 5 ans pour chercher du bois ? b.Moins
26. Temps passé pour collecter du a.Plus c.Même
bois par rapport à il y a 5 ans ? b.Moins
27. Changement du prix du a.Plus c.Même
combustible (bois ou charbon) b.Moins
au cours des 5 dernières
années?
28. Vous collecter/acheter a.Oui d.Ne s'applique pas
différents types de bois par
rapport à il ya 5 ans? b.Pas
29. Parfois vous sautez le repas pour a.oui b. Pas
la manque de bois pour cuir ?
CONSOMMATION D'EAU30.0ù puisez-vous principalement a. puits ouverts d. Lac
votre eau potable? b. Pompe de forage à e. Vendeur d'eau
la main f. Eau de pluie
c. Rivière g. Autre (préciser)
31.Combien de temps est la
distance parcourue pour la
______km/jour
source d'eau? (indiquer les km
parcourus ou le temps utilisé heures / jour
en une seule journée)
Oui / non 33.Si non décrire:
32. Obtenez-vous l'eau de lavage et
de nettoyage du même endroit?
34.Le point d'eau est différent Oui / non 35.Si oui décrire:
pendant la saison des pluies et la
saison sec?
36. L'eau que vous buvez est
propre et sans danger pour Oui / non
vous et votre famille?
37.Est-ce que vous purifier l'eau
Oui / non
avant de la boire?
38.Si Oui, quelle est la méthode que a. La faire bouillir d. Autre traitement
vous utilisez pour la purification? b. Tablettes de chlore chimique
c. Chlore liquide e. Filtre
(SurEau) f. Autre (préciser):
39.Si non, quelle est la raison pour a. Bois (ou autre combustible) est cher
ne pas la purifier? b. Ébullition consomme le bois (ou autre
combustible) pour la cuisson
c. Bois (ou autre combustible) est difficile à trouver
d. Collecte de bois (ou autre combustible) prend
trop de temps
e. Purifier est cher
f. II n'y a aucun avantage pour moi
g. La source d'eau que j'utilise est propre
40. Si la barrière mentionnée ci- Décrire:
dessus (manque d'argent,
l'accès au carburant, le temps,
etc.) n'existe pas, quel moyen
voulez-vous choisir pour rendre
votre eau potable?
41. Quelle est la quantité totale Litres/jous:
d'eau consommée par jour
dans votre famille?42. Combien de personnes utilisent préciser le nombre: _____
cette eau?
43. Combien de litres d'eau votre
famille consomme par jour pour
Litres/jour: _________
boire, cuisiner et le lavage des
mains?
44. Parfois votre famille souffre de Oui / Non 42.Si oui décrire qui
diarrhée ? a. Enfants
b.AduItes
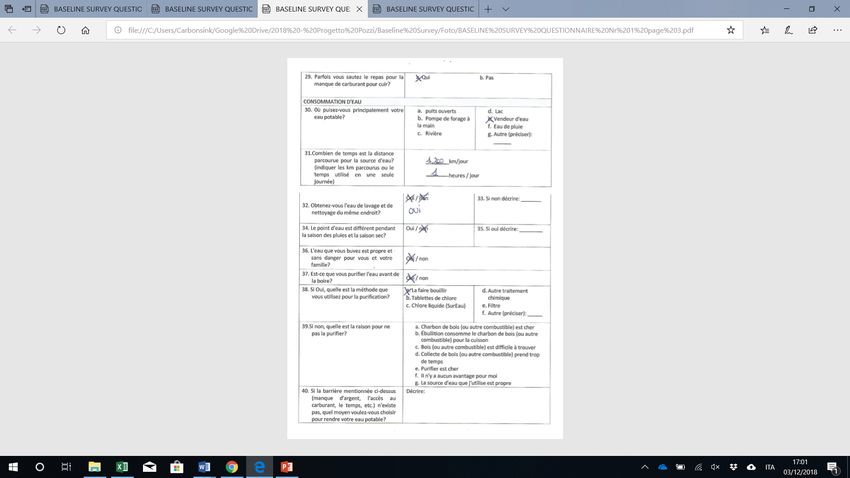
c.Personnes âgées4 Annex 2. Example of filled and scanned survey form
You can also read